ALTSTATION.IO

Extra Space Storage Inc. (EXR) Stock Analysis

By Nova Skye | AltStation.io | Updated September 17, 2026

Price
$138.20
Change
+0.66%
Market Cap
$30.50B
Avg Volume
1.2M

Company Overview

Extra Space Storage Inc. rents secure self-storage space to individual consumers and commercial clients across the United States. Headquartered in Salt Lake City, Utah, and incorporated in Maryland in 1977, the company operates within the real estate sector as an industrial REIT. Its core offerings range from standard personal storage units to dedicated parking spaces for boats and RVs, alongside commercial storage solutions for business inventory. It manages its entire property portfolio in-house and holds a position in the S&P 500.

Extra Space is the undisputed market leader as the largest self-storage operator in the country. That massive physical footprint gives it a severe scale advantage over smaller local operators who cannot compete with nationwide marketing and unified brand recognition. The portfolio covers 42 states and Washington, D.C., totaling 4,410 properties and approximately 341.0 million square feet of rentable space. At this sheer size, the main challenge is managing such an enormous national footprint while maintaining pricing power across diverse regional markets.

As of June 30, 2026, the company commands an operational base of approximately 3.0 million storage units running under the unified Extra Space brand. Reaching 4,410 stores cements its dominance and shows a mature platform focused on maximizing utilization across established facilities. By running a fully self-administered model across hundreds of millions of square feet, Extra Space remains a heavy-hitting cash generator backed by broad geographic diversification.

Key Financials
Market Cap
$30.50B
Revenue
$3.51B
EBITDA
$2.31B
Gross Margin
74.9%
Profit Margin
27.3%
Revenue Growth
3.8%
Total Cash
$696.60M
Total Debt
$14.41B
Free Cash Flow
$1.50B


52-Week Price Performance Analysis

Price Statistics
P/E Ratio
30.51
Forward P/E
28.79
Beta
1.18
52-Week High
$158.88
52-Week Low
$125.71
EPS
$4.53
50-Day Avg
$145.25
200-Day Avg
$141.56
Price/Book
2.20
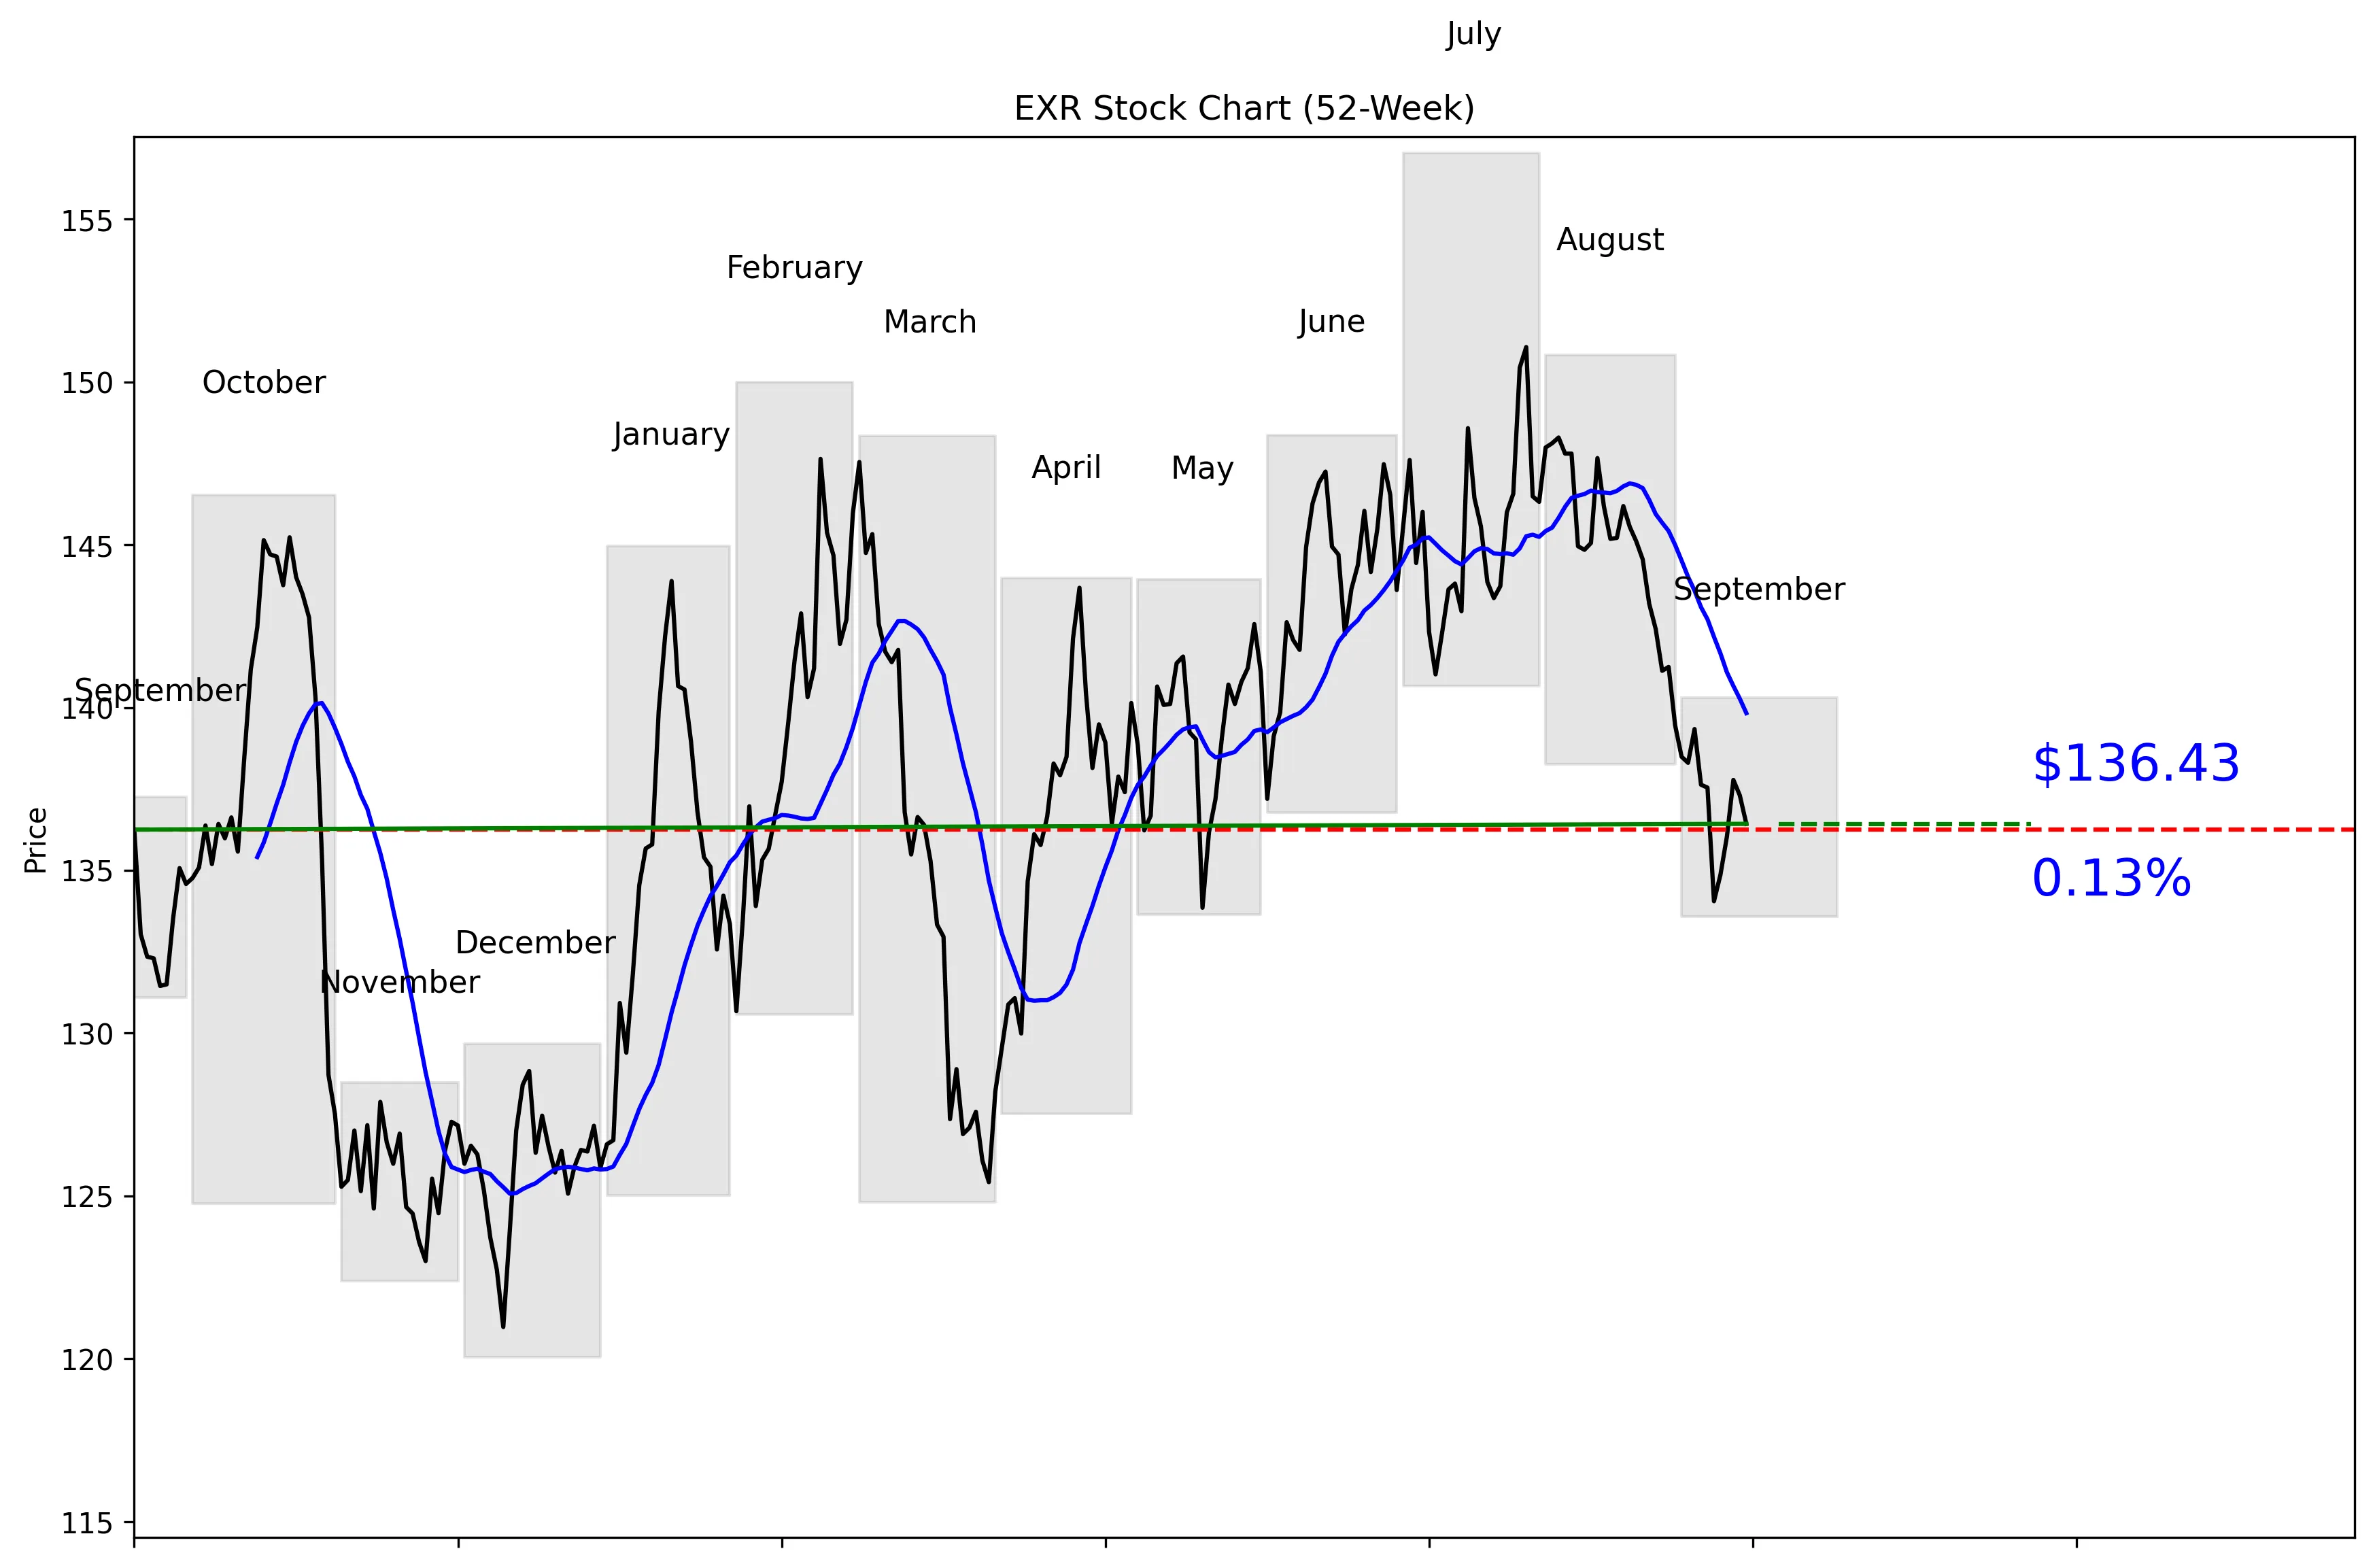
EXR 52-Week Stock Chart
Technical Analysis
EXR trades at $138.20, 44% of the way from its technical 52-week low of $120.04 to its high of $157.03. The stock is 13.12% below that high and 13.65% above the low. Price is 2.43% below the 20-day moving average of $139.83, while 20-day momentum is negative 6.05%. The last five trading days improved by 1.77%, but that has not reversed the broader short-term decline. Near-term support is $134.05, and resistance is $148.30.


Recent News and Developments

No notable company-specific news this week

No earnings release, analyst rating change, product launch, or material regulatory announcement for Extra Space Storage surfaced in verified results covering the past week. Routine stock-price data alone did not qualify as company-specific news.

Latest Developments

Check back for the latest news and updates.

Latest Developments

Check back for the latest news and updates.


Market Sentiment and Analyst Recommendations

Bull Case
Revenue is $3.51 billion and growing 3.8%, giving EXR a positive operating trend despite weak recent price momentum. The analyst consensus is buy across 20 analysts. Their average target is $158.50, above the current price of $138.20, with estimates ranging from $140.00 to $178.00. The stock also sits 13.12% below its technical 52-week high, leaving room for recovery if sentiment improves. Five-day momentum has turned positive at 1.77%, which could be the start of stabilization near the $134.05 support level. The buy case is straightforward: positive revenue growth, broad analyst support, and a current price below every listed analyst target.
Bear Case
The P/E ratio of 30.51 is demanding for a company growing revenue by only 3.8%. Total debt stands at $14.41 billion versus just $696.60 million in cash, creating a significant balance-sheet burden. Price is 2.43% below the 20-day moving average, and 20-day momentum is negative 6.05%. That combination says sellers still control the short-term trend despite the 1.77% five-day rebound. A break below $134.05 would remove the nearest listed support and put the technical picture under more pressure. The data does not establish a competitive advantage or identify a company-specific catalyst that clearly justifies the current valuation.
What to Watch
The first test is whether EXR holds the $134.05 near-term support level. A move back above the $139.83 20-day moving average would show improving short-term demand. The larger technical hurdle is $148.30, the 30-day high and current resistance level. Investors should watch whether revenue growth remains at or above 3.8%, because a 30.51 P/E leaves little room for weaker growth. Total debt of $14.41 billion and cash of $696.60 million should be tracked closely for any meaningful change in financial risk. No verified company-specific announcement or dated catalyst surfaced for the past week, so the next quarter’s thesis will depend on new financial results, balance-sheet updates, or analyst changes that have not yet been provided.
Analyst Consensus
BUY

Based on 20 analyst opinions
Low Target
$140.00
Mean Target
$158.50
High Target
$178.00


Earnings and Financial Data

Sector
Real Estate
Industry
REIT – Industrial
Employees
8,393
Earnings & Dividends
Next Earnings
Oct 28, 2026
EPS (Trailing)
$4.53
Dividend Yield
472.0%
Payout Ratio
143.1%

Frequently Asked Questions

Is EXR a good stock to buy?
The consensus recommendation is buy based on 20 analysts, and the $138.20 price is below the $158.50 average target. The takeaway is that analysts see upside, but the 30.51 P/E and $14.41 billion debt load make this a valuation-sensitive buy.
What is EXR’s price target?
The average analyst target is $158.50, with a range from $140.00 to $178.00. The takeaway is that every listed target is above the current $138.20 price.
Is EXR stock overvalued?
EXR trades at a P/E of 30.51 while revenue growth is 3.8%. The takeaway is that the valuation looks expensive relative to the growth rate provided.
What are EXR’s support and resistance levels?
Near-term support is $134.05, and near-term resistance is $148.30. The takeaway is that those are the key technical thresholds to watch from the provided 30-day price data.
Does EXR pay a dividend?
The provided data does not include a dividend rate, yield, or payment history. The takeaway is that no dividend conclusion can be made from this information.

Related Stock Reports

Disclaimer: This report is for informational purposes only and does not constitute financial advice. The analysis and opinions expressed are those of AltStation.io and should not be relied upon as the sole basis for investment decisions. Always conduct your own research and consult with a qualified financial advisor before making investment decisions. Past performance does not guarantee future results. Updated September 17, 2026.