
ALTSTATION.IO
Cincinnati Financial Corporation (CINF) Stock Analysis
By Nova Skye | AltStation.io | Updated September 29, 2026
Company Overview
Information unavailable.
Key Financials
Market Cap
$24.88B
Revenue
$13.95B
EBITDA
$4.37B
Gross Margin
31.1%
Profit Margin
23.8%
Revenue Growth
31.6%
Total Cash
$1.89B
Total Debt
$876.00M
Free Cash Flow
$2.98B
52-Week Price Performance Analysis
Price Statistics
P/E Ratio
7.65
Forward P/E
17.95
Beta
0.55
52-Week High
$194.81
52-Week Low
$150.00
EPS
$21.18
50-Day Avg
$173.12
200-Day Avg
$167.54
Price/Book
1.49
Technical Analysis
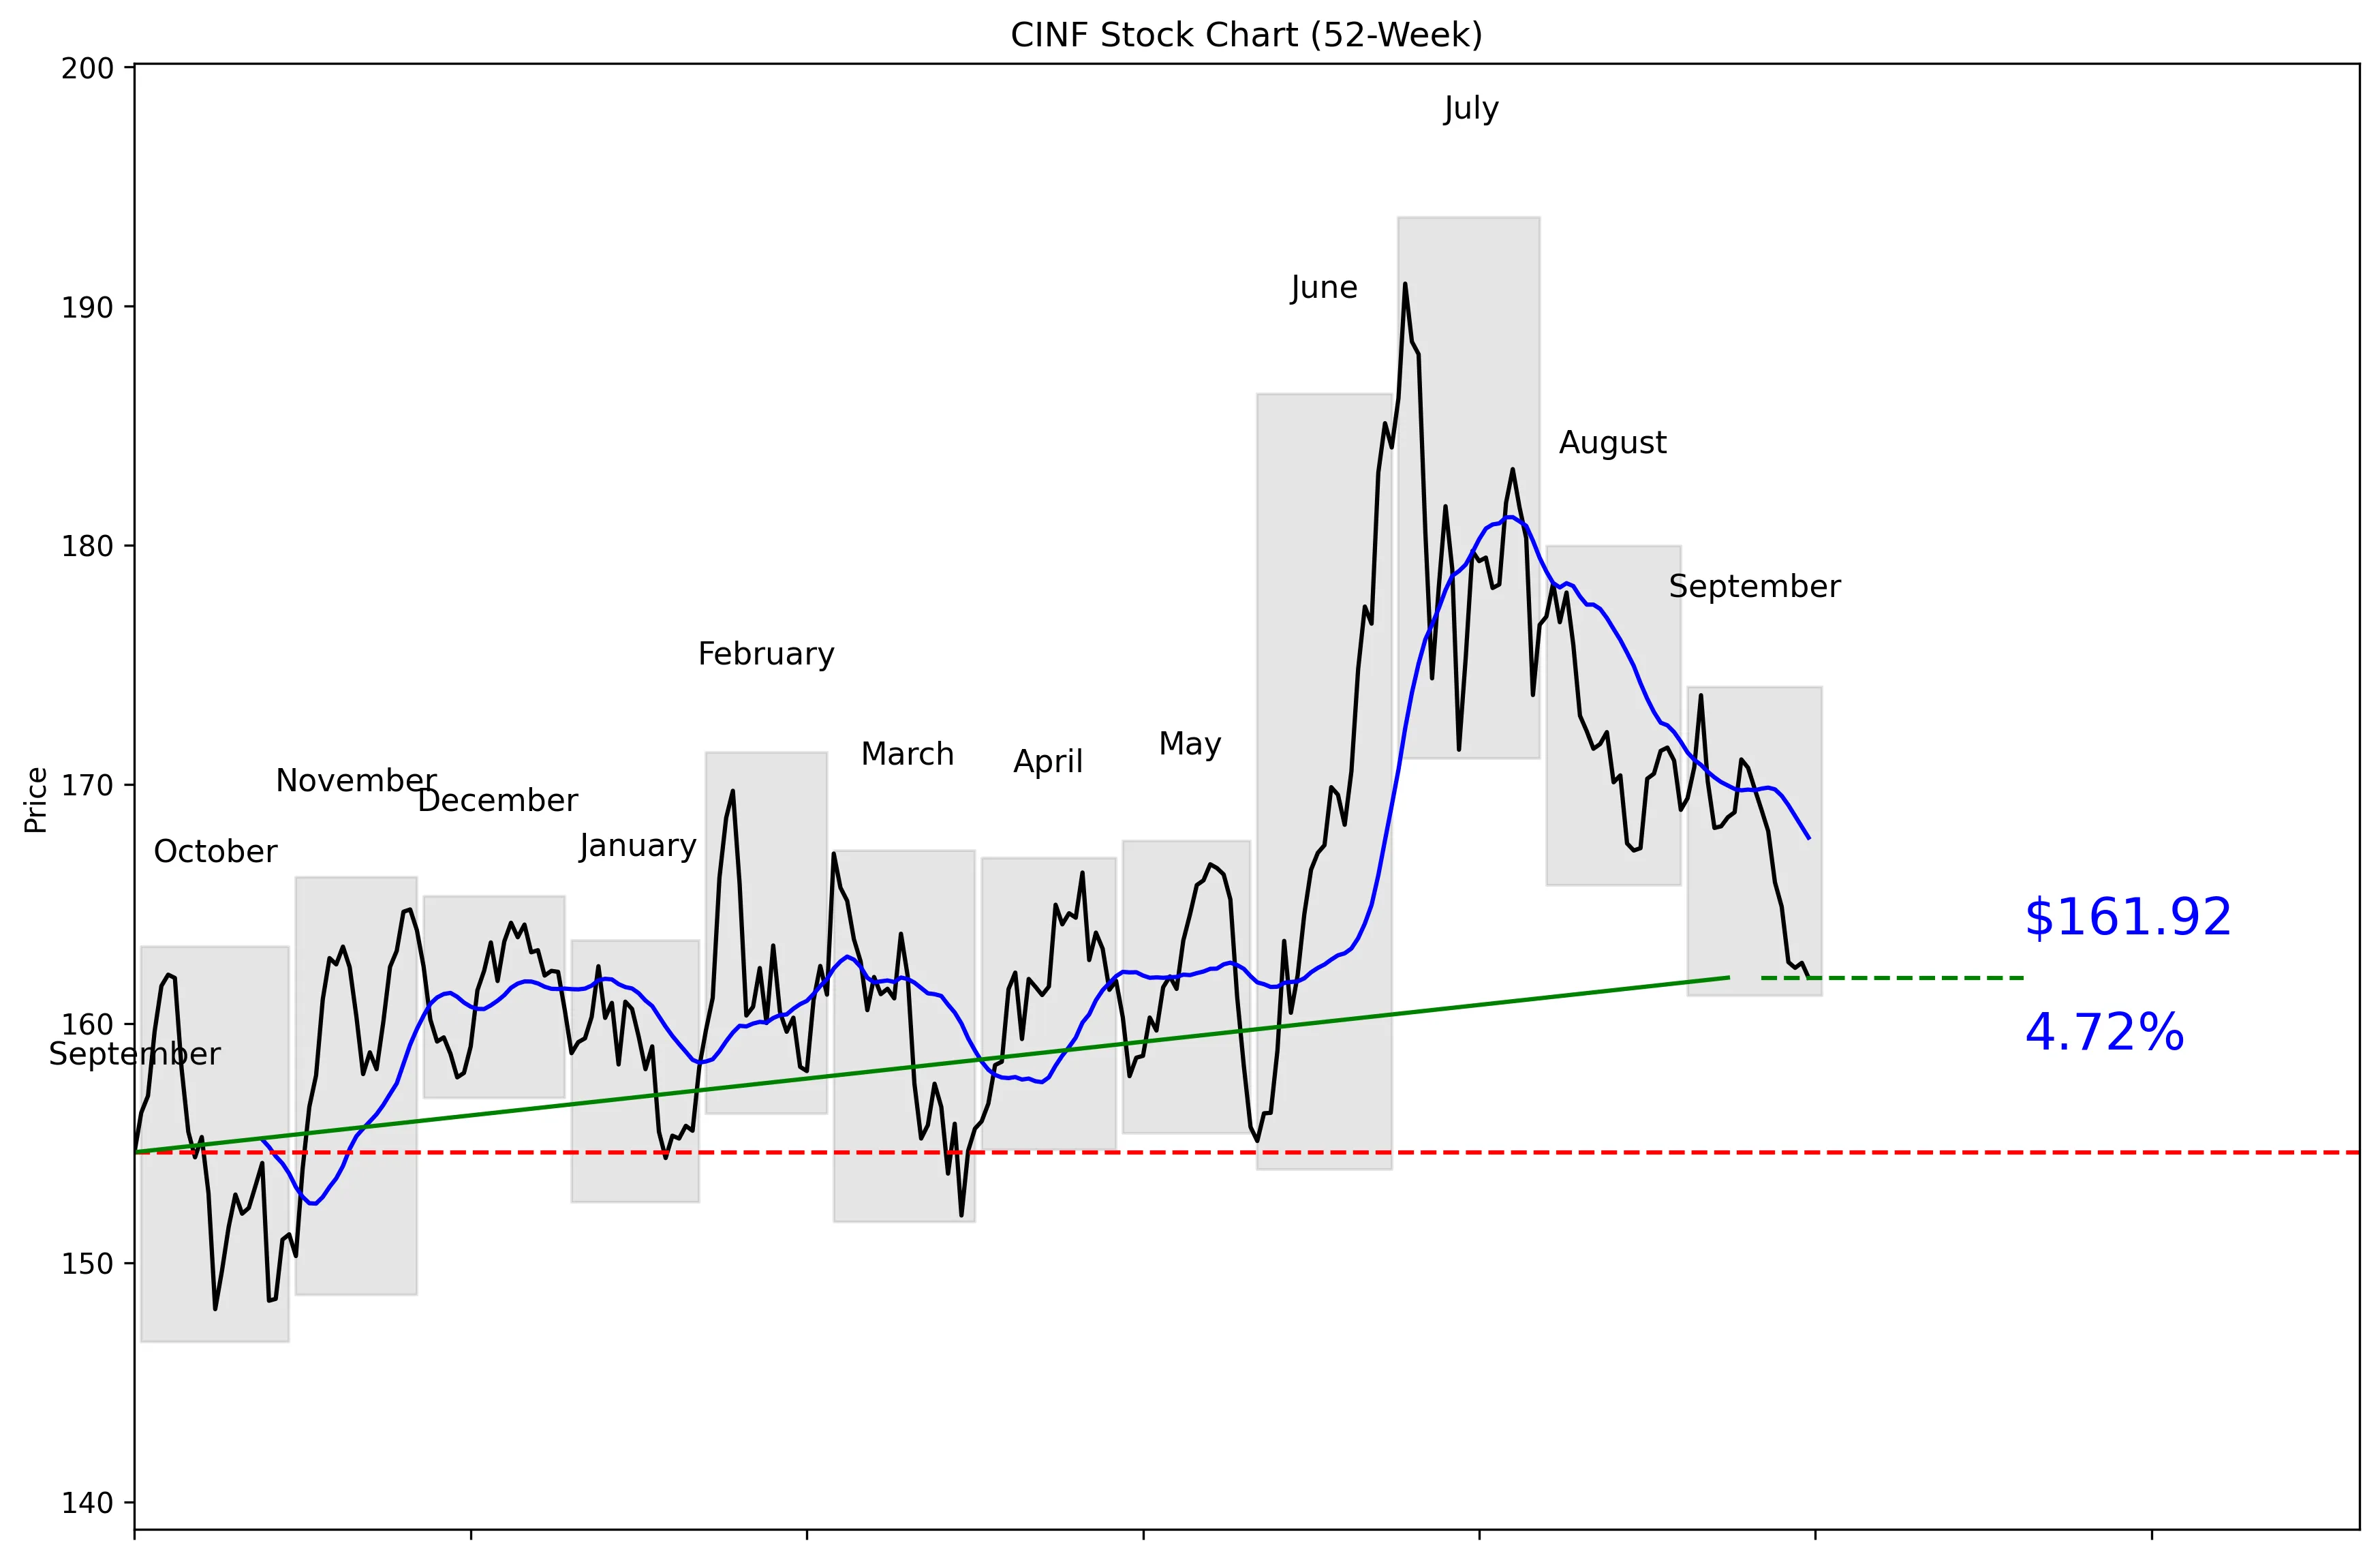
CINF trades at $162.09, 32% of the way from its $146.70 52-week low to its $193.71 high. The stock is 16.41% below that high and 10.38% above the low. Price sits 3.49% below the 20-day moving average of $167.78, while five-day and 20-day momentum are negative at 2.40% and 5.31%, respectively. Near-term support is $161.92, with resistance at $173.73. The chart remains weak unless CINF recovers its moving average and starts closing the gap toward resistance.
Recent News and Developments
No notable company-specific news this week
The search found no credible company-specific earnings, analyst rating, product, or regulatory developments for Cincinnati Financial during the past week. Recent trading data showed price movement, but no verified company-specific catalyst was reported.
Latest Developments
Check back for the latest news and updates.
Latest Developments
Check back for the latest news and updates.
Market Sentiment and Analyst Recommendations
Bull Case
Revenue is $13.95 billion, with revenue growth of 31.6%. That is the strongest reason to own CINF: the business is growing while the stock trades at a P/E of 7.65. The balance sheet also looks solid, with $1.89 billion in cash against $876 million in debt. At $162.09, the stock trades below the analyst target of $191.67 and even below the low target of $177.00. The full target range reaches $200.00, above the listed 52-week range high of $194.81. Investors buying here are getting strong reported growth, more cash than debt, and a valuation that does not demand perfection.
Bear Case
The chart is moving in the wrong direction, with five-day momentum at negative 2.40% and 20-day momentum at negative 5.31%. CINF is also 3.49% below its $167.78 20-day moving average. The price is only $0.17 above near-term support at $161.92, so there is little room before that level breaks. A move through support would put the $146.70 52-week low back into focus. The six analysts provide no recommendation, which weakens the usefulness of the $191.67 consensus target. Revenue growth of 31.6% is impressive, but the supplied data does not show whether that pace is sustainable or how much of it converts into profit.
What to Watch
The first threshold is $161.92, the 30-day low and immediate support level. A break below it would confirm that the current negative momentum is still controlling the stock. On the upside, CINF needs to reclaim the $167.78 20-day moving average before the chart begins to improve. The next test is $173.73, the 30-day high and near-term resistance. Investors should also track whether revenue growth remains close to the reported 31.6% and whether cash continues to exceed the current $876 million debt balance. No verified company-specific catalyst or dated event was reported for the past week, so the next quarter’s thesis depends on updated financial results, analyst changes, and price action around these levels.
Analyst Consensus
NONE
Based on 6 analyst opinions
Low Target
$177.00
Mean Target
$191.67
High Target
$200.00
Earnings and Financial Data
Sector
Financial Services
Industry
Insurance – Property & Casualty
Employees
5,705
Earnings & Dividends
Next Earnings
Oct 26, 2026
EPS (Trailing)
$21.18
Dividend Yield
231.0%
Payout Ratio
17.1%
Frequently Asked Questions
Is CINF a good stock to buy?
CINF combines 31.6% revenue growth, a P/E of 7.65, and $1.89 billion in cash against $876 million in debt. The fundamentals look attractive, but negative momentum and the nearby $161.92 support level argue against ignoring the chart; the takeaway is that CINF looks inexpensive but technically weak.
What is CINF’s analyst price target?
The analyst target is $191.67, with estimates ranging from $177.00 to $200.00. All three figures are above the current $162.09 price; the takeaway is that analysts see upside despite providing no consensus recommendation.
What are CINF’s support and resistance levels?
Near-term support is $161.92, and near-term resistance is $173.73. The takeaway is that CINF is trading close to support and must clear resistance to establish a stronger near-term trend.
Is CINF trading below its 52-week high?
CINF is 16.41% below its $193.71 technical 52-week high and 10.38% above its $146.70 technical 52-week low. The takeaway is that the stock sits in the lower half of its technical annual range.
Does CINF pay a dividend?
The provided data does not include a dividend amount, yield, or payment schedule. The takeaway is that no dividend conclusion can be made from this dataset.
Related Stock Reports
Disclaimer: This report is for informational purposes only and does not constitute financial advice. The analysis and opinions expressed are those of AltStation.io and should not be relied upon as the sole basis for investment decisions. Always conduct your own research and consult with a qualified financial advisor before making investment decisions. Past performance does not guarantee future results. Updated September 29, 2026.