ALTSTATION.IO

PepsiCo, Inc. (PEP) Stock Analysis

By Nova Skye | AltStation.io | Updated October 11, 2026

Price
$125.96
Change
-1.85%
Market Cap
$171.65B
Avg Volume
8.3M

Company Overview

Founded in 1898 and headquartered in Purchase, New York, PepsiCo operates in the Consumer Defensive sector under the non-alcoholic beverages industry. The business runs across 6 global operating segments, manufacturing and selling packaged convenient foods and drinks. Its catalog covers chips, granola bars, oatmeal, pasta, and dairy brands like Agusha alongside ready-to-drink teas, coffees, and SodaStream makers. PepsiCo sells directly through e-commerce platforms and supplies wholesale distributors, grocery chains, dollar stores, and foodservice operators worldwide.

PepsiCo holds a clear market leader position because it pairs a heavy beverage footprint with an extensive convenient food business. That dual-threat model gives the company unmatched leverage across grocery aisles, mass merchandisers, and membership clubs compared to single-category competitors. Its direct-store-delivery and independent bottler networks create high barriers to entry that keep niche challengers from taking meaningful shelf space. The primary risk comes from value-seeking shoppers drifting toward hard discounters and cheaper store brands.

Right now, PepsiCo is balancing its North American food and beverage divisions with targeted expansion across 4 international regions covering Latin America, Europe, the Middle East, Africa, and Asia Pacific. The company is actively shifting beyond traditional soda by scaling SodaStream sparkling water systems and expanding high-demand ready-to-drink formats. Distributing through customer warehouses, independent bottlers, and direct e-commerce gives them a resilient retail footprint. The critical watch item is whether their convenience foods and diversified beverage portfolio can maintain volume growth across global discount channels.

Key Financials
Market Cap
$171.65B
Revenue
$98.24B
EBITDA
$19.86B
Gross Margin
54.5%
Profit Margin
11.1%
Revenue Growth
5.6%
Total Cash
$11.16B
Total Debt
$51.88B
Free Cash Flow
$9.43B


52-Week Price Performance Analysis

Price Statistics
P/E Ratio
16.51
Forward P/E
14.44
Beta
N/A
52-Week High
$171.48
52-Week Low
$123.47
EPS
$7.63
50-Day Avg
$135.80
200-Day Avg
$146.79
Price/Book
7.79
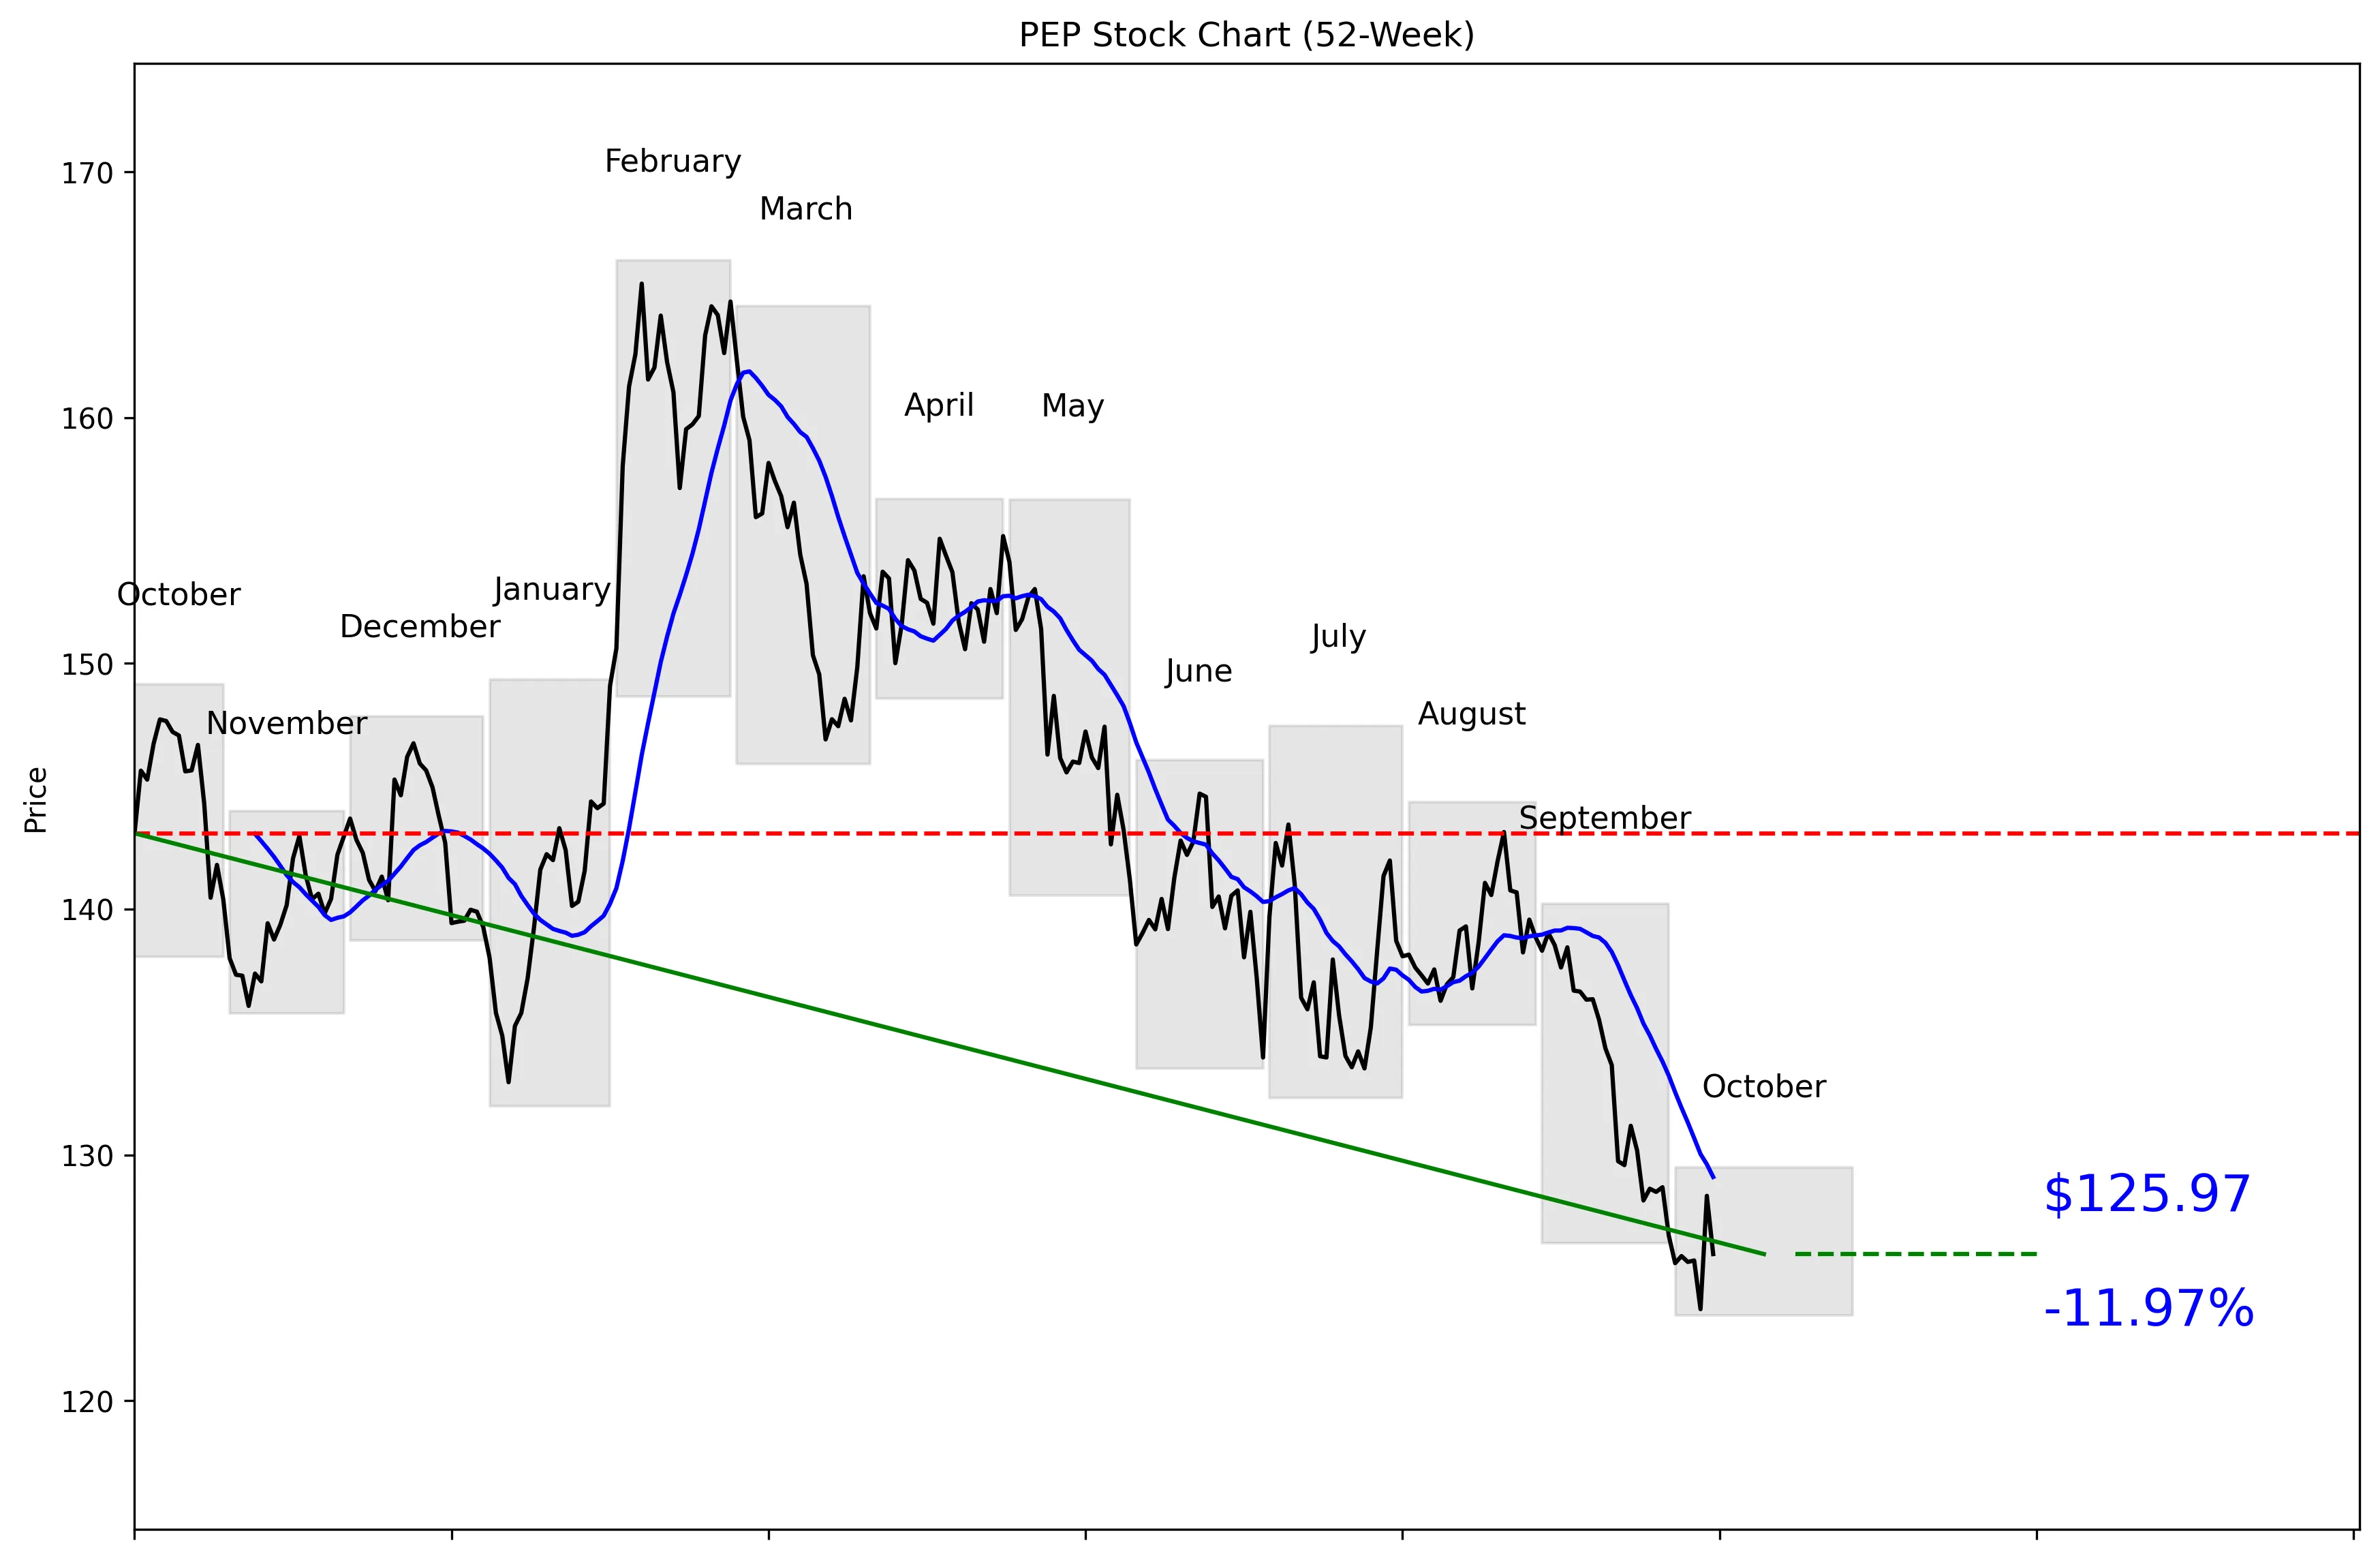
PEP 52-Week Stock Chart
Technical Analysis
PEP trades at $125.96, just 6% of the way from its $123.47 low to its $166.41 high. The stock is 24.30% below that high and only 2.02% above the low, putting it near the weakest end of its 52-week range. Price is 2.43% below the 20-day moving average of $129.11, while 20-day momentum is negative 7.59%. Five-day momentum is nearly flat at 0.06%, so selling pressure has slowed but has not reversed. Near-term support is $123.73, while $139.58 is the resistance level buyers need to reclaim.


Recent News and Developments

PepsiCo cuts 2026 profit outlook in Q3 filing

Third-quarter revenue rose 5.6% to $25.27 billion, while core EPS increased 2% to $2.34. PepsiCo cut its 2026 core EPS growth forecast to 2.5%-3.5% from the previous low end of 5%-7%. The guidance cut is the real story. Source: U.S. Securities and Exchange Commission

PepsiCo reverses course with new price increases

PepsiCo plans single-digit percentage price increases on Doritos, Ruffles, SunChips and some sodas while cutting corporate costs. North American snack volume was flat and beverage volume fell 2% during the quarter, while a $178 million tariff refund that helped offset costs will not repeat. Source: Associated Press

Freedom upgrades PepsiCo as other analysts cut targets

Freedom Broker upgraded PepsiCo from Hold to Buy but lowered its price target from $162 to $147, citing the company’s brands, geographic reach and cash generation. JPMorgan cut its target to $137 from $138, Deutsche Bank cut to $132 from $138 and Piper Sandler cut to $140 from $176. Source: The Fly via TipRanks


Market Sentiment and Analyst Recommendations

Bull Case
PepsiCo generated $98.24 billion in revenue and delivered 5.6% revenue growth, proving the business can still expand despite weak North American volumes. Third-quarter revenue rose 5.6% to $25.27 billion, and core EPS increased 2% to $2.34. The stock trades at 16.51 times earnings, which gives buyers a lower entry valuation after a 24.30% decline from the 52-week high. The $143.86 analyst target sits above the current $125.96 price, and the high-end target reaches $169.00. PepsiCo is also raising prices by single-digit percentages on major brands including Doritos, Ruffles, SunChips and some sodas. Freedom Broker upgraded the stock from Hold to Buy, citing PepsiCo’s brands, geographic reach and cash generation. The bull case is simple: investors are buying a profitable global consumer business near its 52-week low while expectations are already under pressure.
Bear Case
PepsiCo cut its 2026 core EPS growth forecast to 2.5%-3.5%, down from the previous low end of 5%-7%. That downgrade matters more than the quarter’s 5.6% revenue growth because it signals weaker profit momentum ahead. North American snack volume was flat, and beverage volume fell 2%, showing that price increases are not translating into stronger demand. Planned price increases could protect margins, but they also risk putting more pressure on volume. PepsiCo carries $51.88 billion in total debt against $11.16 billion in cash, leaving a large gap between debt and liquidity. A $178 million tariff refund helped offset costs during the quarter and will not repeat. Analyst caution is broad: JPMorgan cut its target to $137, Deutsche Bank to $132 and Piper Sandler to $140, while the overall recommendation remains Hold across 22 analysts.
What to Watch
The first test is whether PEP can hold near-term support at $123.73 and stay above its $123.47 52-week low. A move back above the $129.11 20-day moving average would be an early sign that the recent 7.59% 20-day decline is stabilizing. The stronger technical confirmation would be a break above the $139.58 30-day resistance level. Investors should track whether North American snack volume improves from flat and whether beverage volume recovers from its 2% decline. The next quarter also needs to show whether single-digit price increases can protect earnings without causing another volume setback. Watch management’s 2026 core EPS growth forecast of 2.5%-3.5%; another reduction would materially weaken the thesis. The October 8 rally of 3.73% and October 9 decline of 1.85% show that investors are reacting quickly to guidance, not just reported earnings.
Analyst Consensus
HOLD

Based on 22 analyst opinions
Low Target
$124.00
Mean Target
$143.86
High Target
$169.00


Earnings and Financial Data

Sector
Consumer Defensive
Industry
Beverages – Non-Alcoholic
Employees
306,000
Earnings & Dividends
Next Earnings
Oct 08, 2026
EPS (Trailing)
$7.63
Dividend Yield
461.0%
Payout Ratio
75.3%

Frequently Asked Questions

Is PEP a good stock to buy?
PEP trades at $125.96 with a Hold recommendation from 22 analysts. The stock is near its 52-week low, but its negative 7.59% 20-day momentum shows that the trend remains weak, so the takeaway is that PEP is not yet a confirmed turnaround.
What is PEP’s analyst price target?
The average analyst target is $143.86, with estimates ranging from $124.00 to $169.00. The takeaway is that analysts see potential above $125.96, but the wide range reflects substantial uncertainty.
Is PEP stock undervalued?
PEP trades at a P/E ratio of 16.51 and sits 24.30% below its 52-week high. Those figures make the valuation more attractive than it was at the high, but the takeaway is that the provided data does not establish a definitive fair value.
What are PEP’s support and resistance levels?
Near-term support is $123.73, and near-term resistance is $139.58. The takeaway is that a break below support would reinforce weakness, while a move above resistance would improve the technical picture.
How financially strong is PepsiCo?
PepsiCo has $11.16 billion in cash, $51.88 billion in debt and $98.24 billion in revenue. The takeaway is that PepsiCo operates at major scale, but its debt is substantially larger than its cash position.

Related Stock Reports

Disclaimer: This report is for informational purposes only and does not constitute financial advice. The analysis and opinions expressed are those of AltStation.io and should not be relied upon as the sole basis for investment decisions. Always conduct your own research and consult with a qualified financial advisor before making investment decisions. Past performance does not guarantee future results. Updated October 11, 2026.