ALTSTATION.IO

The Progressive Corporation (PGR) Stock Analysis

By Nova Skye | AltStation.io | Updated October 15, 2026

Price
$215.69
Change
+1.04%
Market Cap
$125.18B
Avg Volume
2.7M

Company Overview

The Progressive Corporation is an insurance powerhouse headquartered in Mayfield, Ohio, operating in the property and casualty sector since 1937. The company sells auto, home, and specialty vehicle policies to everyday consumers, alongside commercial liability and truck insurance to small businesses and transportation fleets. It distributes policies directly to buyers online and over the phone, as well as through a broad network of independent agencies. That dual distribution model lets Progressive capture both price-sensitive direct shoppers and clients who prefer agent guidance.

Progressive is a tier-one market leader, holding approximately 18.5% of the U.S. personal auto market as the nation’s second-largest carrier. Its defining competitive edge is granular risk segmentation and dynamic pricing analytics, which consistently outpace peers like State Farm, Allstate, and GEICO. When rising vehicle repair costs hit industry loss ratios, Progressive adjusts rates faster than slower-moving mutuals to protect its underwriting margins. The primary headwind to watch is severe weather volatility, which periodically pressures loss ratios across its residential property portfolio.

Progressive is growing at a rapid clip while keeping underwriting discipline intact. Full-year 2025 revenue reached $87.67 billion, a 16.3% increase over the $75.37 billion generated in 2024, driven by the addition of roughly 3.7 million new policies. Rather than chasing speculative pivots, the company continues to take profitable market share in its core auto and commercial transportation segments. That disciplined execution makes Progressive one of the most efficient underwriting machines in the financial sector.

Key Financials
Market Cap
$125.18B
Revenue
$91.70B
EBITDA
$15.34B
Gross Margin
17.3%
Profit Margin
12.7%
Revenue Growth
3.0%
Total Cash
$2.12B
Total Debt
$8.39B
Free Cash Flow
N/A


52-Week Price Performance Analysis

Price Statistics
P/E Ratio
11.29
Forward P/E
13.27
Beta
N/A
52-Week High
$239.38
52-Week Low
$189.20
EPS
$19.10
50-Day Avg
$214.69
200-Day Avg
$208.74
Price/Book
3.62
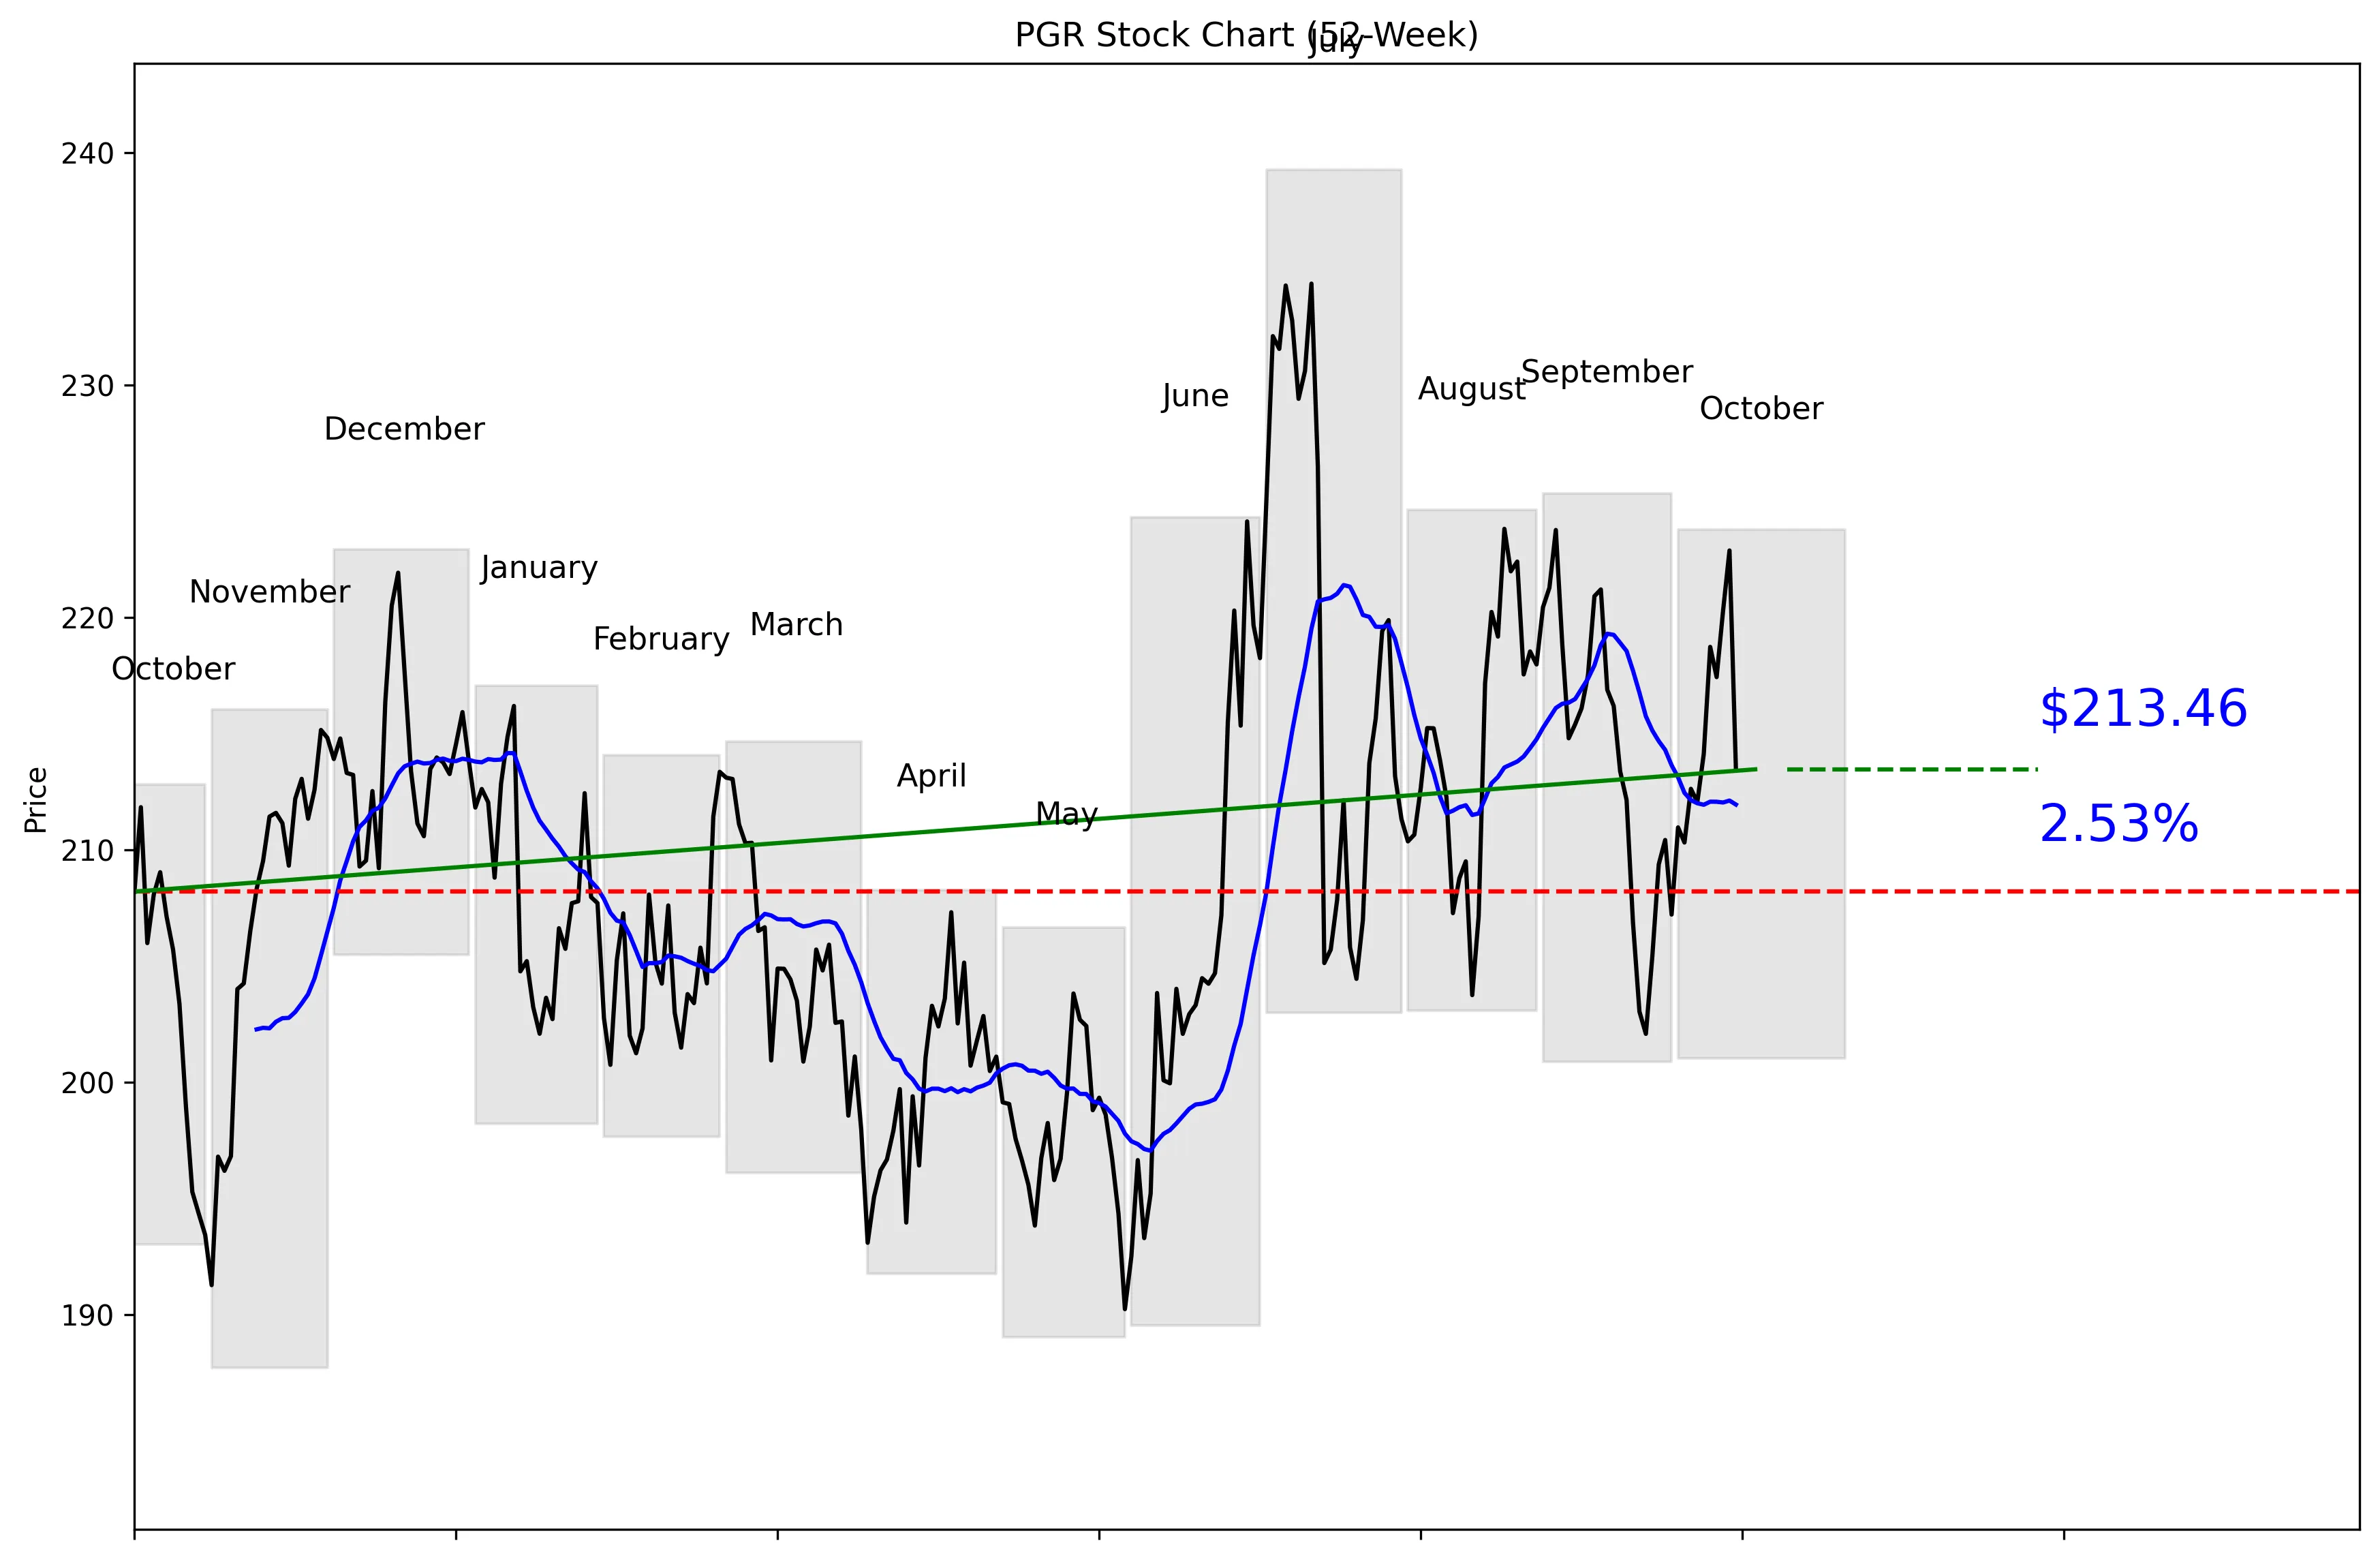
PGR 52-Week Stock Chart
Technical Analysis
PGR trades at $215.69, exactly 50% of the way from its $187.69 52-week low to its $239.26 high. The stock is 10.78% below that high and 13.73% above the low. Price is 0.72% above the 20-day moving average of $211.94. Momentum remains weak, with declines of 0.31% over five trading days and 1.58% over 20 trading days. Near-term support is $202.07, while resistance sits at $223.76.


Recent News and Developments

Progressive reports September results

September net income rose 107% year over year to $630 million, while net premiums written increased 2% to $7.255 billion. The quarterly combined ratio improved 0.8 points to 88.7%, but quarterly net income fell 3% to $2.542 billion. Source: U.S. Securities and Exchange Commission

Progressive earnings miss as shares sell off

Progressive reported third-quarter EPS of $4.37 versus the $4.42 estimate, while revenue of $22.30 billion missed the $22.50 billion forecast. Shares traded at $208.74, down 6.35%, at 1:03 p.m. EDT on October 14. Source: Investing.com

Wells Fargo cuts Progressive stock price target on growth concerns

Wells Fargo lowered its PGR price target from $201 to $196 and kept its Underweight rating. The firm cut its 2027 earnings estimate by 2.4%, citing lost policies and an accident-year loss ratio above Wall Street expectations. Source: Investing.com


Market Sentiment and Analyst Recommendations

Bull Case
Progressive generated $91.70 billion in revenue and carries a P/E of 11.29, giving buyers substantial earnings at a restrained valuation. September net income increased 107% year over year to $630 million. Net premiums written also rose 2% to $7.255 billion, while the quarterly combined ratio improved 0.8 points to 88.7%. The analyst target of $229.43 sits above the current $215.69 price, and the high-end target reaches $266.00. Keefe, Bruyette & Woods maintained its Outperform rating with a $246 target despite lowering its earnings outlook. The bull case is straightforward: improving underwriting performance and a low P/E could drive gains if premium growth and earnings stabilize.
Bear Case
Revenue growth is only 3.0%, and recent results show that growth is losing momentum. Third-quarter EPS of $4.37 missed the $4.42 estimate, while revenue of $22.30 billion missed the $22.50 billion forecast. Quarterly net income fell 3% to $2.542 billion despite stronger September results. Wells Fargo cut its target from $201 to $196, kept an Underweight rating, and reduced its 2027 earnings estimate by 2.4% because of lost policies and a weaker-than-expected accident-year loss ratio. Keefe, Bruyette & Woods also lowered its 2026 EPS estimate from $18.95 to $18.30, citing slower premium growth and higher core loss and expense ratios. Progressive also holds $8.39 billion in debt against $2.12 billion in cash, so weaker operating performance would leave less financial flexibility.
What to Watch
The next quarterly report needs to show whether the third-quarter misses were temporary or the start of a weaker earnings trend. Investors should compare future EPS with the recent $4.37 result and revenue with the latest $22.30 billion quarter. Premium growth is critical after September net premiums written increased just 2% to $7.255 billion. The combined ratio should remain near or below the latest quarterly level of 88.7%; deterioration would weaken the profitability case. Watch whether PGR holds the $202.07 support level or breaks through the $223.76 resistance level. A move toward the $196 low-end analyst target would support the bearish view, while progress toward the $229.43 consensus target or $246 Keefe, Bruyette & Woods target would strengthen the bull case.
Analyst Consensus
HOLD

Based on 21 analyst opinions
Low Target
$196.00
Mean Target
$229.43
High Target
$266.00


Earnings and Financial Data

Sector
Financial Services
Industry
Insurance – Property & Casualty
Employees
70,053
Earnings & Dividends
Next Earnings
Oct 14, 2026
EPS (Trailing)
$19.10
Dividend Yield
18.0%
Payout Ratio
69.7%

Frequently Asked Questions

Is PGR a good stock to buy?
PGR trades at $215.69 with a P/E of 11.29, but its consensus recommendation is hold based on 21 analysts. The takeaway is that the valuation looks reasonable, but analysts do not see a clear buy yet.
What is PGR’s price target?
The analyst target is $229.43, with estimates ranging from $196.00 to $266.00. The takeaway is that expectations vary widely around the current $215.69 price.
What is PGR’s 52-week range?
The key data lists a 52-week range of $189.20 to $239.38, while the computed price series shows a low of $187.69 and a high of $239.26. The takeaway is that PGR currently sits around the middle of its measured yearly range.
What are PGR’s support and resistance levels?
Near-term support is the 30-day low of $202.07, and near-term resistance is the 30-day high of $223.76. The takeaway is that these are the primary levels to watch around the current $215.69 price.
Is PGR stock showing positive momentum?
PGR is 0.72% above its $211.94 20-day moving average, but momentum is negative by 0.31% over five trading days and 1.58% over 20 trading days. The takeaway is that price remains above the moving average while short-term momentum is weak.

Related Stock Reports

Disclaimer: This report is for informational purposes only and does not constitute financial advice. The analysis and opinions expressed are those of AltStation.io and should not be relied upon as the sole basis for investment decisions. Always conduct your own research and consult with a qualified financial advisor before making investment decisions. Past performance does not guarantee future results. Updated October 15, 2026.