ALTSTATION.IO

Monster Beverage Corporation (MNST) Stock Analysis

By Nova Skye | AltStation.io | Updated September 22, 2026

Price
$44.40
Change
-0.70%
Market Cap
$86.97B
Avg Volume
10.9M

Company Overview

Monster Beverage Corporation operates in the Consumer Defensive sector, specifically within the Non-Alcoholic Beverages industry, and is headquartered in Corona, California. Founded in 1985 as Hansen Natural Corporation before changing its name in January 2012, the company develops, markets, and distributes energy drinks, ready-to-drink teas, juices, coffees, and concentrates. Their revenue flows through 4 operating segments: Monster Energy Drinks, Strategic Brands, Alcohol Brands, and Other. The distribution footprint covers virtually every major retail channel, selling to convenience and gas chains, grocery retailers, mass merchandisers, club stores, e-commerce platforms, and the military.

Monster operates as an established market leader in energy beverages, using a multi-brand strategy to control shelf space. Their primary operational edge is selling concentrates and beverage bases directly to authorized bottling and canning operations, which allows rapid global scaling through dedicated distribution networks. To protect market share against category challengers, they field dedicated performance and value lines, deploying brands like Monster Energy Ultra, Reign Total Body Fuel, NOS, Bang Energy, and Predator. Defending that shelf space requires continuous brand maintenance across dozens of regional and specialized beverage labels worldwide.

The business is actively diversifying beyond its core caffeinated drink portfolio into alcohol and adjacent beverage categories. Its Alcohol Brands segment now produces craft beers, flavored malt beverages, and hard seltzers under labels including The Beast, Beast Tea, Jai Alai IPA, and Dale’s Pale Ale. Adding Bang Energy alongside non-caffeinated products like Monster Tour Water broadens their reach across fitness, hydration, and adult beverage channels. This product expansion gives the company multiple avenues for volume growth, though execution in the alcohol segment remains the central operational test.

Key Financials
Market Cap
$86.97B
Revenue
$9.22B
EBITDA
$2.93B
Gross Margin
55.5%
Profit Margin
23.1%
Revenue Growth
20.2%
Total Cash
$3.42B
Total Debt
$92.93M
Free Cash Flow
$1.68B


52-Week Price Performance Analysis

Price Statistics
P/E Ratio
41.11
Forward P/E
33.91
Beta
0.52
52-Week High
$50.17
52-Week Low
$31.50
EPS
$1.08
50-Day Avg
$46.59
200-Day Avg
$42.10
Price/Book
9.29
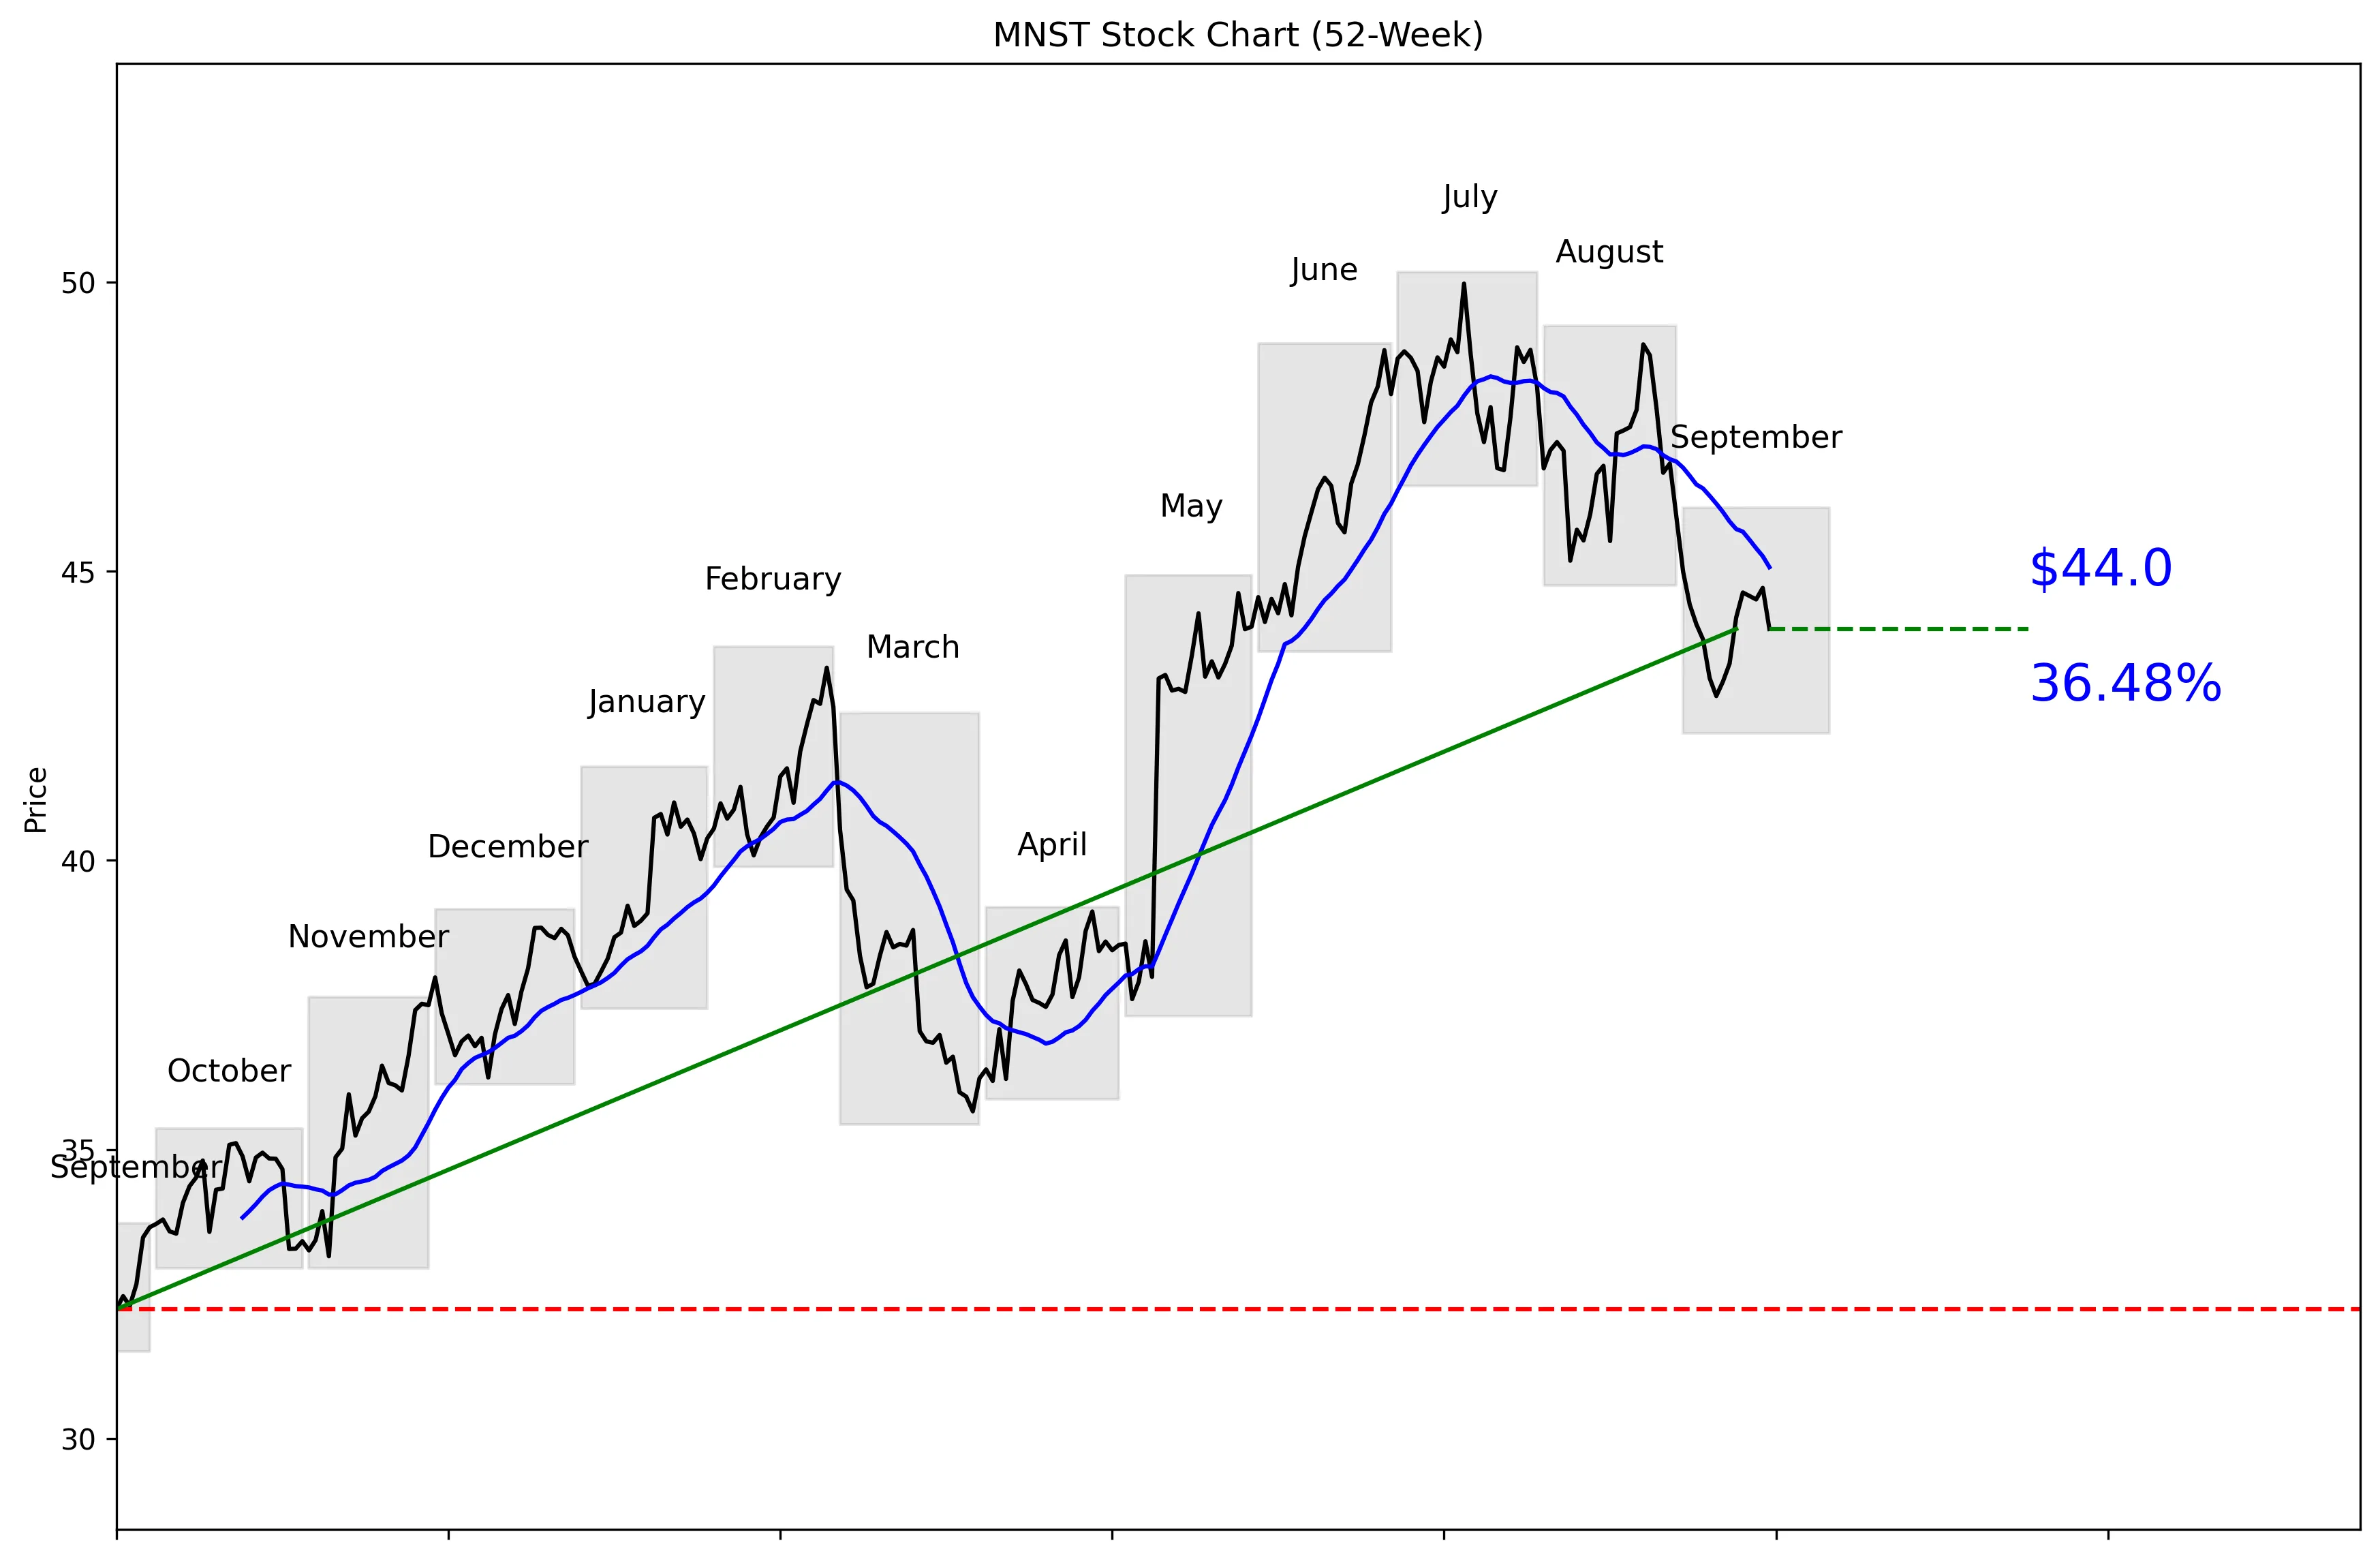
MNST 52-Week Stock Chart
Technical Analysis
MNST trades at $44.40, placing it 67% of the way from its 52-week low of $31.50 to its 52-week high of $50.17. The stock is 12.30% below that high and 39.66% above the low. Price is 2.37% below the 20-day moving average of $45.07. Momentum is negative, with a 0.45% decline over five trading days and a 7.93% decline over 20 trading days. Near-term support sits at $42.84, while resistance is $48.92.


Recent News and Developments

No notable company-specific news this week

No verified MNST-specific earnings, analyst actions, product launches, or regulatory developments were published during the past week. The only material movement found was routine share-price trading, not a company-specific news event.

Latest Developments

Check back for the latest news and updates.

Latest Developments

Check back for the latest news and updates.


Market Sentiment and Analyst Recommendations

Bull Case
Revenue growth of 20.2% is the strongest reason to own MNST. The company generated $9.22 billion in revenue, showing substantial scale alongside that growth. Its balance sheet is strong, with $3.42 billion in cash against just $92.93 million in total debt. Analysts rate the stock a buy based on recommendations from 23 analysts. Their average target is $50.24, above the current $44.40 price, while the high-end target reaches $57.00. The bull case is straightforward: strong growth, minimal debt, and analyst expectations for a higher share price.
Bear Case
The P/E ratio of 41.11 leaves little room for disappointment. Investors are already paying a premium for the company’s 20.2% revenue growth, so any slowdown could pressure the valuation. Price momentum has weakened, with MNST down 7.93% over the last 20 trading days. The stock also trades 2.37% below its 20-day moving average of $45.07, confirming that near-term momentum is negative. The analyst target range runs as low as $35.00, well below the current $44.40 price. There is no verified company-specific news this week to provide an immediate catalyst for reversing the decline.
What to Watch
The first level to watch is $42.84, the 30-day low and current near-term support. A break below that level would reinforce the negative 20-day momentum of 7.93%. On the upside, MNST needs to recover above its $45.07 moving average before the short-term chart improves. The next test is $48.92, the 30-day high and near-term resistance. Investors should also track whether revenue growth holds near the reported 20.2%, because the 41.11 P/E depends on continued strong growth. No verified earnings date, analyst action, product launch, or regulatory event was provided for the next quarter, so those events cannot be identified from the available data.
Analyst Consensus
BUY

Based on 23 analyst opinions
Low Target
$35.00
Mean Target
$50.24
High Target
$57.00


Earnings and Financial Data

Sector
Consumer Defensive
Industry
Beverages – Non-Alcoholic
Employees
5,773
Earnings & Dividends
Next Earnings
Nov 05, 2026
EPS (Trailing)
$1.08
Dividend Yield
None
Payout Ratio
0%

Frequently Asked Questions

Is MNST a good stock to buy?
The analyst recommendation is buy, based on 23 analysts, and revenue is growing 20.2%. The takeaway is that the growth case is strong, but the 41.11 P/E makes the entry price important.
What is MNST’s price target?
The average analyst target is $50.24, with estimates ranging from $35.00 to $57.00. The takeaway is that analysts see upside on average from the current $44.40 price, but their forecasts vary widely.
Is MNST overvalued?
MNST trades at a P/E ratio of 41.11 while reporting 20.2% revenue growth. The takeaway is that the stock carries a premium valuation and needs strong growth to justify it.
What are MNST’s support and resistance levels?
Near-term support is $42.84, and near-term resistance is $48.92. The takeaway is that these are the key price thresholds to watch.
Does MNST pay a dividend?
The provided data does not include dividend information. The takeaway is that no conclusion about MNST’s dividend can be made from the available figures.

Related Stock Reports

Disclaimer: This report is for informational purposes only and does not constitute financial advice. The analysis and opinions expressed are those of AltStation.io and should not be relied upon as the sole basis for investment decisions. Always conduct your own research and consult with a qualified financial advisor before making investment decisions. Past performance does not guarantee future results. Updated September 22, 2026.