ALTSTATION.IO

Exelon Corporation (EXC) Stock Analysis

By Nova Skye | AltStation.io | Updated October 12, 2026

Price
$41.79
Change
+0.14%
Market Cap
$43.05B
Avg Volume
7.8M

Company Overview

Headquartered in Chicago, United States, Exelon Corporation operates as a pure-play utility services company in the regulated electric and natural gas sector. The business model is simple: they purchase, transmit, and distribute electricity and gas rather than running power generation plants. They deliver energy to roughly 10.5 million residential, commercial, industrial, and public authority customers across six regulated utility subsidiaries. In 2024, this regulated delivery network generated $23.02 billion in revenue.

Exelon is an established market leader, standing as the largest pure-play electric transmission and distribution utility in the United States. Its primary competitive advantage is structural, holding legal geographic monopolies across 25,550 square miles where customers have no other distribution option. The company does not face direct territory battles against peers like Duke Energy or American Electric Power, but its returns are strictly capped by state utility commissions. Regulatory friction over rate hikes represents the main threat to its margins.

Exelon is currently in an infrastructure expansion cycle following its 2022 spin-off of Constellation Energy, which removed volatile merchant generation from the balance sheet. The company is deploying a capital expenditure plan of over $41 billion to modernize the grid and connect high-demand customers like data centers. Management targets annual rate base growth of approximately 7.5%, with roughly 90% of that spending covered by established cost-recovery mechanisms. The business is a steady capital compounder, though its upside depends on state regulators approving rate adjustments on schedule.

Key Financials
Market Cap
$43.05B
Revenue
$25.33B
EBITDA
$8.35B
Gross Margin
42.4%
Profit Margin
11.0%
Revenue Growth
9.9%
Total Cash
$1.81B
Total Debt
$52.67B
Free Cash Flow
-$2.69B


52-Week Price Performance Analysis

Price Statistics
P/E Ratio
15.36
Forward P/E
13.75
Beta
0.40
52-Week High
$50.65
52-Week Low
$39.73
EPS
$2.72
50-Day Avg
$43.42
200-Day Avg
$45.59
Price/Book
1.45
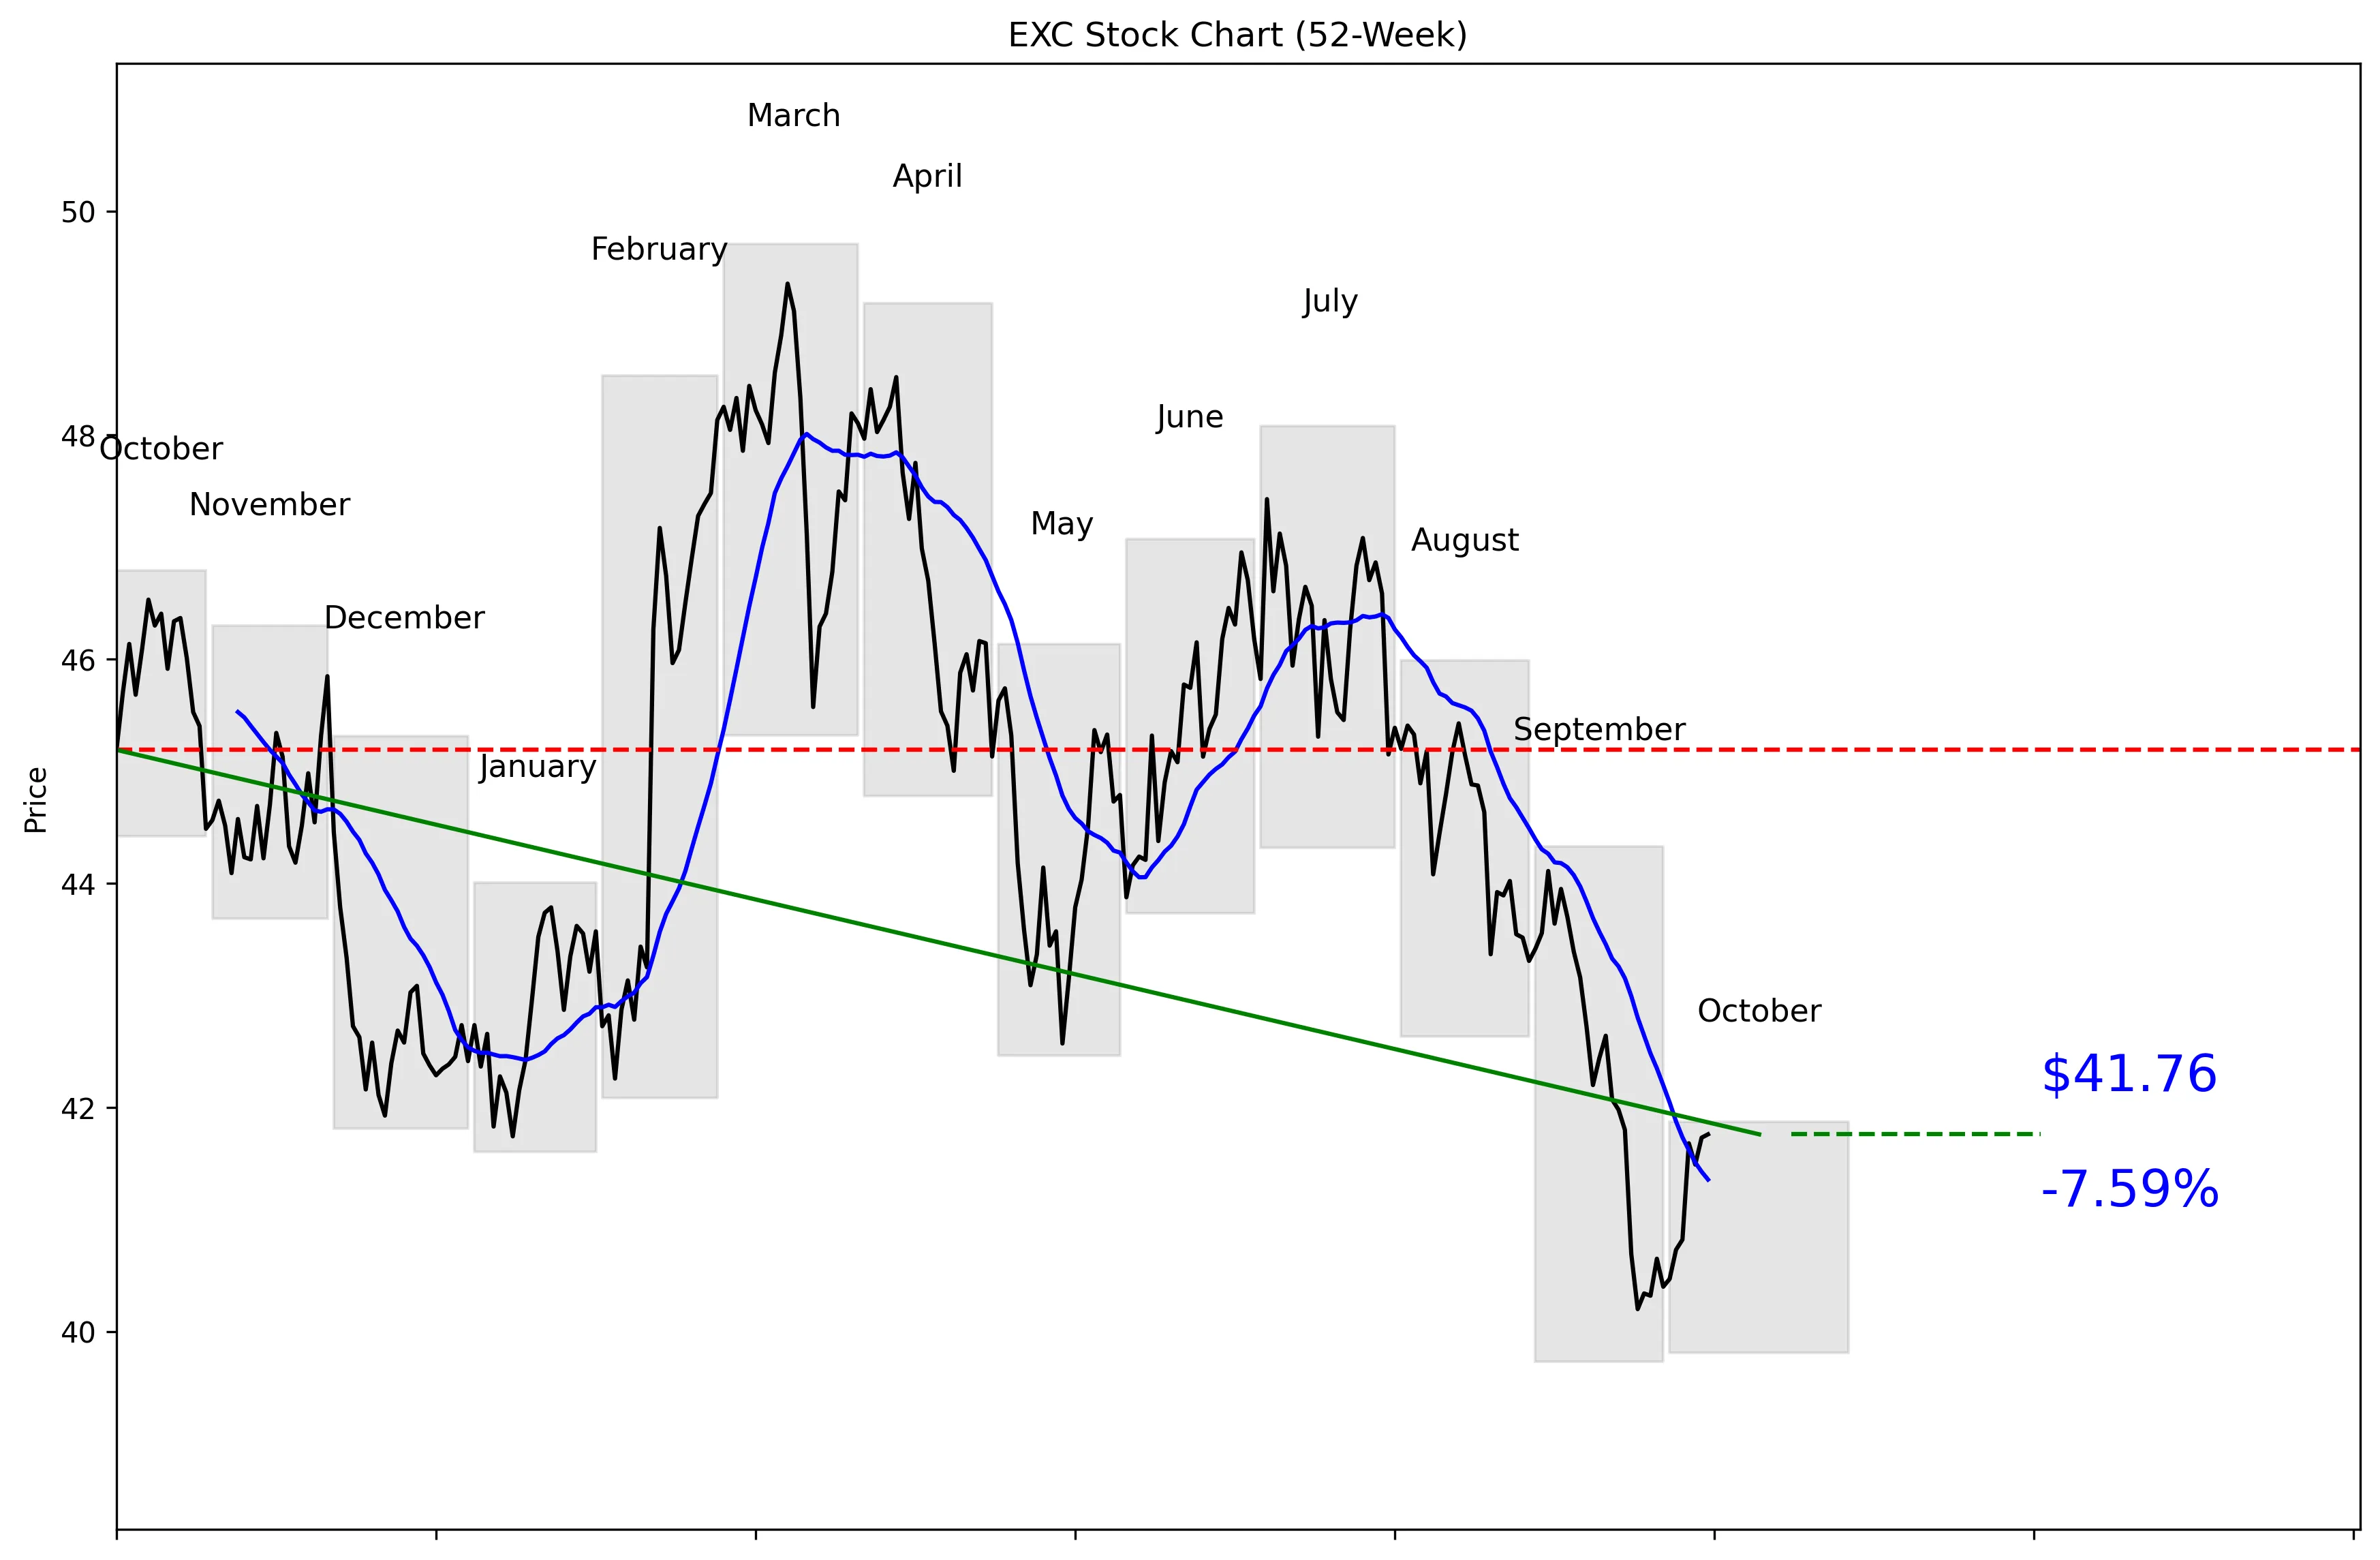
EXC 52-Week Stock Chart
Technical Analysis
EXC trades at $41.79, just 20% of the way from its $39.73 52-week low to its $49.70 52-week high. The stock is 15.98% below that high and 5.11% above the low. Price is 0.98% above the 20-day moving average of $41.36, while five-day momentum is positive at 2.53%. The broader short-term trend is weaker, with 20-day momentum at -3.24%. Near-term support is $40.20, and resistance is $44.11.


Recent News and Developments

Exelon sets October 30 date for third-quarter results

Exelon will release and discuss third-quarter 2026 earnings on October 30. Its conference call starts at 10:00 a.m. Eastern. Source: Exelon Corporation

EXC jumps 2.11% and extends winning streak

Exelon shares gained 2.11% to close at $41.68 on October 6. That marked the stock’s fourth consecutive trading-day gain. Source: MarketWatch

BGE defends natural gas system before Maryland regulators

Exelon subsidiary BGE told Maryland regulators that natural gas remains necessary for more than 700,000 customers. BGE said its gas system has added more than 8,000 customers since 2023 and argued that forced electrification would increase customer costs. Source: MarketScreener


Market Sentiment and Analyst Recommendations

Bull Case
Revenue growth of 9.9% gives Exelon a solid operating backdrop. The stock trades at 15.36 times earnings, while the $48.53 analyst target sits above the current $41.79 price. Analysts place the target range between $41.00 and $58.00, leaving room for upside if execution improves. Exelon’s 3.93% dividend yield adds an income component, and the shares have gained 46% over five years. The upcoming October 30 earnings release gives investors a clear near-term catalyst. At $41.79, with the stock only 5.11% above its 52-week low, the bull case is straightforward: buy a profitable utility near the bottom of its yearly range while collecting income and waiting for growth to show up.
Bear Case
Exelon carries $52.67 billion in total debt against only $1.81 billion in cash. That balance-sheet gap matters because expansion is already consuming significant capital. First-quarter operating cash flow was $1.72 billion, below capital expenditures of $2.36 billion. Exelon also plans to raise $3.4 billion in equity through 2029, creating dilution risk for existing shareholders. BGE’s rate application is drawing public scrutiny in Maryland, and the November 18 hearing was moved to an in-person format so customers could directly address the proposed increase. With 20-day momentum at -3.24% and 17 analysts rating the stock a hold, the market is not treating EXC as an obvious bargain.
What to Watch
Exelon reports third-quarter 2026 results on October 30, with its conference call scheduled for 10:00 a.m. Eastern. Revenue growth is currently 9.9%, so investors should watch whether that pace holds after the report. Cash generation must improve relative to spending after first-quarter operating cash flow of $1.72 billion fell short of $2.36 billion in capital expenditures. The planned $3.4 billion equity raise through 2029 also deserves attention because its timing and scale will affect dilution risk. On the regulatory side, the November 18 public hearing on BGE’s electric base-rate application could shape the outlook for customer rates and investment recovery. Technically, a move above $44.11 would break near-term resistance, while a drop below $40.20 would weaken the setup and put the $39.73 52-week low back in focus.
Analyst Consensus
HOLD

Based on 17 analyst opinions
Low Target
$41.00
Mean Target
$48.53
High Target
$58.00


Earnings and Financial Data

Sector
Utilities
Industry
Utilities – Regulated Electric
Employees
20,571
Earnings & Dividends
Next Earnings
Oct 30, 2026
EPS (Trailing)
$2.72
Dividend Yield
403.0%
Payout Ratio
60.3%

Frequently Asked Questions

Is EXC a good stock to buy?
EXC trades at $41.79 with a P/E ratio of 15.36, but the consensus recommendation from 17 analysts is hold. The takeaway is that EXC offers potential upside, but analysts do not currently view it as a clear buy.
What is EXC’s price target?
The analyst target is $48.53, with estimates ranging from $41.00 to $58.00. The takeaway is that expectations vary widely, but the consensus target is above the current $41.79 price.
What is EXC’s 52-week range?
The reported 52-week range is $39.73 to $50.65, while the technical price series shows a high of $49.70 and the same $39.73 low. The takeaway is that EXC currently trades near the lower end of its yearly range.
Is EXC stock gaining momentum?
EXC has gained 2.53% over the last five trading days but remains down 3.24% over the last 20 trading days. The takeaway is that very short-term momentum has improved, but the broader near-term trend is still negative.
What are EXC’s support and resistance levels?
Near-term support is the 30-day low of $40.20, while resistance is the 30-day high of $44.11. The takeaway is that these are the key levels to watch around the current $41.79 price.

Related Stock Reports

Disclaimer: This report is for informational purposes only and does not constitute financial advice. The analysis and opinions expressed are those of AltStation.io and should not be relied upon as the sole basis for investment decisions. Always conduct your own research and consult with a qualified financial advisor before making investment decisions. Past performance does not guarantee future results. Updated October 12, 2026.