ALTSTATION.IO

Alliant Energy Corporation (LNT) Stock Analysis

By Nova Skye | AltStation.io | Updated September 26, 2026

Price
$63.02
Change
-0.46%
Market Cap
$16.34B
Avg Volume
2.4M

Company Overview

Alliant Energy Corporation is a Madison, Wisconsin-based utility holding company operating in the regulated electric and natural gas sector. Through its core IPL and WPL operating segments, the company generates and delivers electricity and gas to retail and wholesale customers across Iowa and Wisconsin. Its customer base is tied directly to the Midwestern economy, powering agriculture, food processing, packaging, chemical, and heavy manufacturing businesses alongside local municipalities and rural electric cooperatives. Beyond standard grid delivery, the company generates steam for two industrial customers in Cedar Rapids and manages transport assets including short-line rail, an Illinois river barge terminal, and freight warehousing.

Because Alliant operates as a regulated electric and gas utility, it holds a protected territory across its core Midwestern footprint rather than fighting open-market retail power competitors. That structure secures steady demand from a captive regional customer base. The main constraint is strict regulatory oversight on rates, alongside heavy exposure to regional economic conditions in Iowa and Wisconsin manufacturing and farming. Its distinct edge lies in owning complementary supply chain assets, including freight brokerage and short-line rail infrastructure, which standard pure-play electric utilities typically do not operate.

Right now, Alliant maintains an operational footprint that balances conventional power with renewable generation and specialized industrial services. The company supports its grid with assets ranging from a natural gas-fired generating unit near Sheboygan Falls, Wisconsin, to an Oklahoma wind farm and wind turbine blade recycling operations. Rather than functioning solely as a wires-and-pipes power provider, its multi-modal freight terminal in Illinois and Iowa rail services give it diversified commercial operations. The business remains a traditional, Midwest-focused regulated utility anchored by a unique regional transport and logistics backbone.

Key Financials
Market Cap
$16.34B
Revenue
$4.43B
EBITDA
$1.83B
Gross Margin
44.5%
Profit Margin
18.4%
Revenue Growth
1.0%
Total Cash
$25.00M
Total Debt
$12.12B
Free Cash Flow
-$1.14B


52-Week Price Performance Analysis

Price Statistics
P/E Ratio
20.07
Forward P/E
17.10
Beta
0.53
52-Week High
$78.81
52-Week Low
$62.70
EPS
$3.14
50-Day Avg
$69.39
200-Day Avg
$70.34
Price/Book
2.17
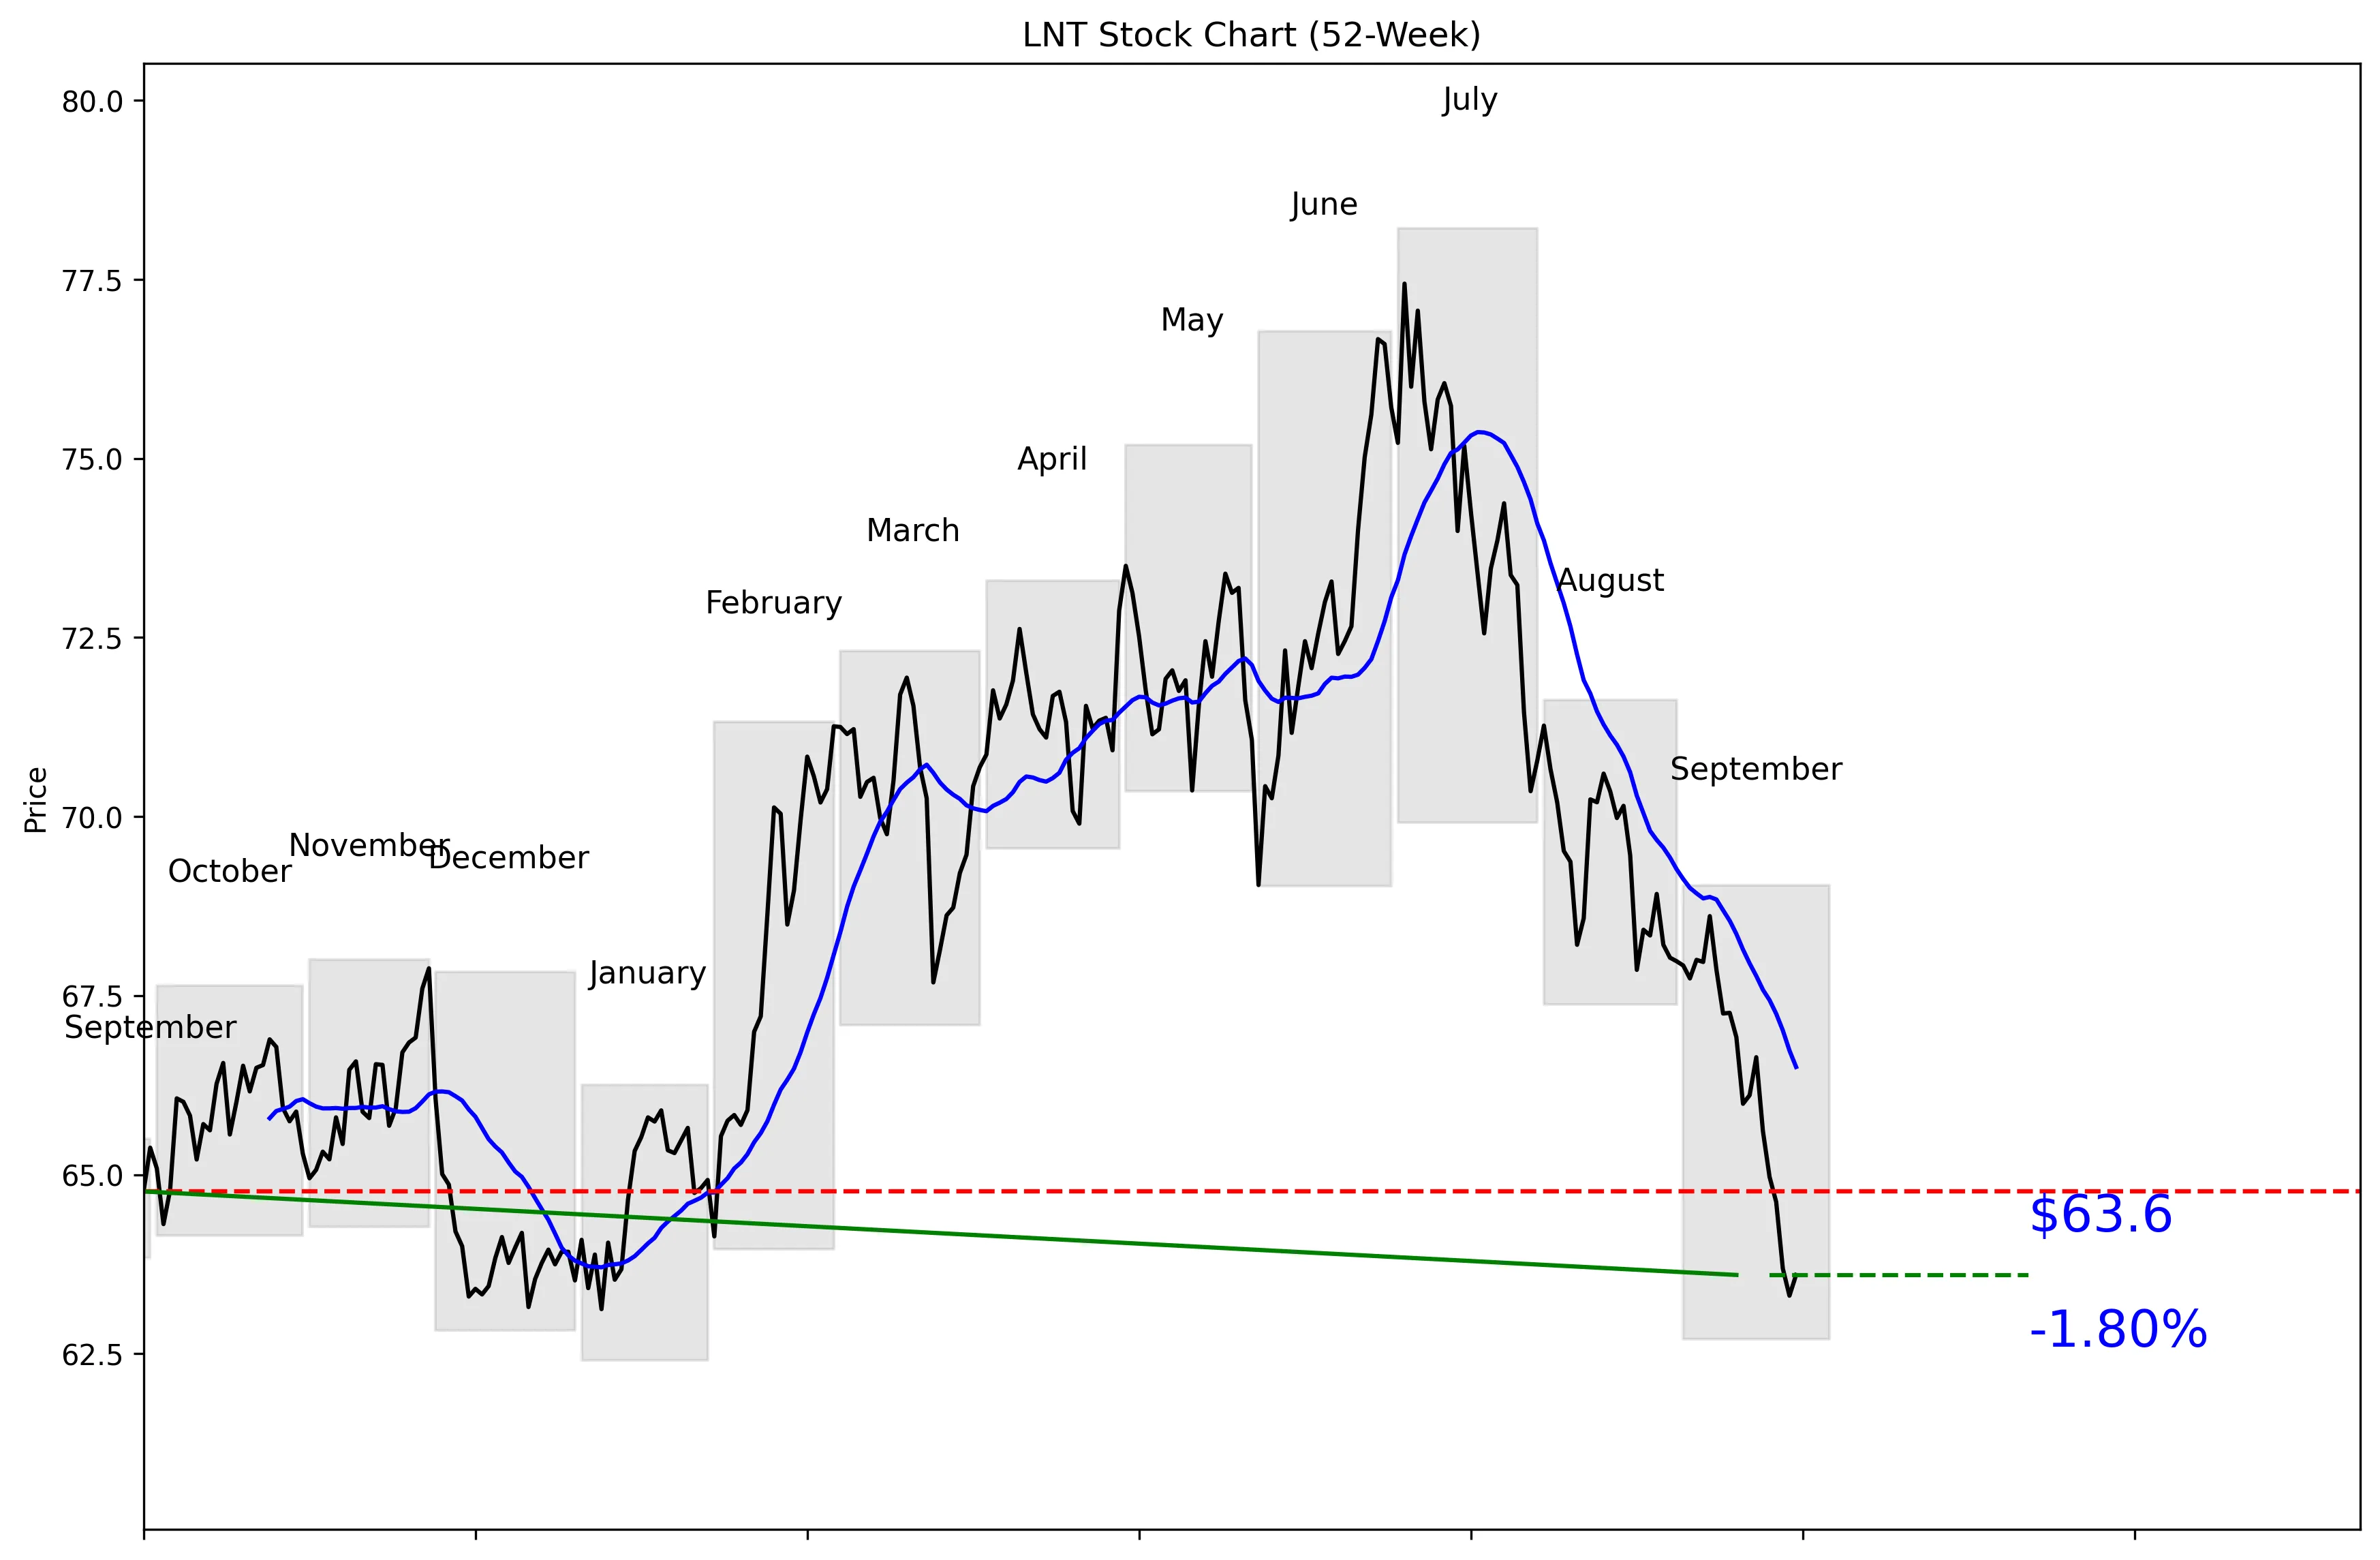
LNT 52-Week Stock Chart
Technical Analysis
LNT trades at $63.02, just 8% of the way from its $62.41 52-week low to its $78.22 high. The stock is 18.69% below that high and only 1.91% above the low. Price sits 4.37% below its 20-day moving average of $66.50, confirming a weak near-term trend. Momentum is negative at 3.06% over the last five trading days and 6.76% over the last 20 trading days. Near-term support is $63.31, while resistance sits at $70.60.


Recent News and Developments

No notable company-specific news this week

No material Alliant Energy news was found from September 20 through September 26, 2026. Searches found no new earnings release, analyst upgrade or downgrade, product launch, or significant regulatory decision involving LNT.

Latest Developments

Check back for the latest news and updates.

Latest Developments

Check back for the latest news and updates.


Market Sentiment and Analyst Recommendations

Bull Case
The strongest argument for LNT is the gap between its $63.02 price and the $78.04 analyst target. All 12 analysts included in the data collectively rate the stock a buy, with targets ranging from $73.00 to $83.00. Even the low target of $73.00 stands above the current price. The company generates $4.43 billion in revenue and has a $16.34 billion market capitalization. Revenue is still growing, although the reported rate is a modest 1.0%. With the stock trading near its 52-week low, the bull case is that current weakness already reflects much of the concern while analyst expectations remain materially higher.
Bear Case
LNT carries $12.12 billion in total debt against only $25.00 million in total cash. That balance-sheet gap is the clearest risk in the data. Revenue growth is just 1.0%, which does not provide much operating momentum. A P/E ratio of 20.07 is not obviously cheap for a company growing revenue at that rate. The technical picture is also weak, with the stock below its $66.50 moving average and down 6.76% over the last 20 trading days. The price is already below the stated $63.31 near-term support, so buyers do not yet have evidence that the decline has stabilized.
What to Watch
The first threshold is $63.31, the 30-day low identified as near-term support. LNT is currently at $63.02, so investors should watch whether it quickly recovers that level or continues toward the $62.41 52-week low. A move back above the $66.50 20-day moving average would be the first clear improvement in momentum. The next major test would be $70.60, the 30-day high and stated near-term resistance. Investors should also track whether revenue growth improves from 1.0% and whether the $12.12 billion debt load declines relative to the company’s $25.00 million cash position. No material company-specific news was found from September 20 through September 26, 2026, so the provided data does not identify a scheduled catalyst for the next quarter.
Analyst Consensus
BUY

Based on 12 analyst opinions
Low Target
$73.00
Mean Target
$78.04
High Target
$83.00


Earnings and Financial Data

Sector
Utilities
Industry
Utilities – Regulated Electric
Employees
2,948
Earnings & Dividends
Next Earnings
Nov 05, 2026
EPS (Trailing)
$3.14
Dividend Yield
338.0%
Payout Ratio
66.0%

Frequently Asked Questions

Is LNT a good stock to buy?
The analyst recommendation is buy based on 12 analysts, and the $78.04 consensus target is above the current $63.02 price. The takeaway is that analysts see upside, but current momentum remains weak.
What is LNT’s price target?
The analyst target is $78.04, with estimates ranging from $73.00 to $83.00. The takeaway is that every listed target is above the current $63.02 price.
Is LNT stock near its 52-week low?
LNT is trading at $63.02, just 1.91% above its $62.41 technical 52-week low. The takeaway is that the stock is near the bottom of its yearly range.
What are LNT’s support and resistance levels?
Near-term support is $63.31, and near-term resistance is $70.60. The takeaway is that the current $63.02 price is already below the stated support level.
Does LNT pay a dividend?
The provided data does not include dividend information, so no dividend amount or yield can be confirmed. The takeaway is that investors should verify the current dividend separately before making an income-based decision.

Related Stock Reports

Disclaimer: This report is for informational purposes only and does not constitute financial advice. The analysis and opinions expressed are those of AltStation.io and should not be relied upon as the sole basis for investment decisions. Always conduct your own research and consult with a qualified financial advisor before making investment decisions. Past performance does not guarantee future results. Updated September 26, 2026.