ALTSTATION.IO

Dollar General Corporation (DG) Stock Analysis

By Nova Skye | AltStation.io | Updated September 19, 2026

Price
$133.21
Change
+1.49%
Market Cap
$29.39B
Avg Volume
2.6M

Company Overview

Dollar General Corporation operates as a discount retailer headquartered in Goodlettsville, Tennessee, competing in the discount stores industry within the consumer defensive sector. Founded in 1939 as J.L. Turner and Son and renamed in 1968, the company serves communities across the southern, southwestern, midwestern, and eastern United States. Its inventory is dominated by daily consumables such as packaged food, paper products, cleaning supplies, over-the-counter medicine, and perishables, with supplemental sales in apparel, seasonal items, and home goods. The primary customer base is lower- to middle-income households seeking low-cost essentials without driving to larger retail centers.

Dollar General is the dominant leader in small-box retail, leveraging an immense footprint of more than 20,000 stores to outmuscle regional rivals. The company holds a massive physical moat, with roughly 73% of the United States population living within five miles of a store. This local convenience allows Dollar General to capture neighborhood foot traffic that big-box players like Walmart and Target miss in rural markets. Still, fierce pricing rivalry from Dollar Tree and Family Dollar caps pricing power, while inflation on everyday essentials routinely strains customer wallets and compresses merchandise margins.

Financially, Dollar General continues to expand its top line, growing annual revenue from $38.69 billion in fiscal 2023 to $40.61 billion in fiscal 2024, an increase of roughly 5.0%. Revenue climbed further to $42.72 billion in fiscal 2025 as the retailer continued store deployment while tightening operational control. Management is currently executing a Back to Basics operational pivot, closing roughly 140 underperforming urban stores and trimming non-core formats to refocus capital on core rural units. The strategy makes sense: cutting dead weight in competitive cities lets Dollar General defend its high-return rural turf and protect bottom-line cash flow.

Key Financials
Market Cap
$29.39B
Revenue
$43.64B
EBITDA
$3.58B
Gross Margin
31.2%
Profit Margin
3.9%
Revenue Growth
5.2%
Total Cash
$1.59B
Total Debt
$15.77B
Free Cash Flow
$1.74B


52-Week Price Performance Analysis

Price Statistics
P/E Ratio
17.30
Forward P/E
16.15
Beta
0.23
52-Week High
$158.23
52-Week Low
$95.11
EPS
$7.70
50-Day Avg
$122.81
200-Day Avg
$126.10
Price/Book
3.16
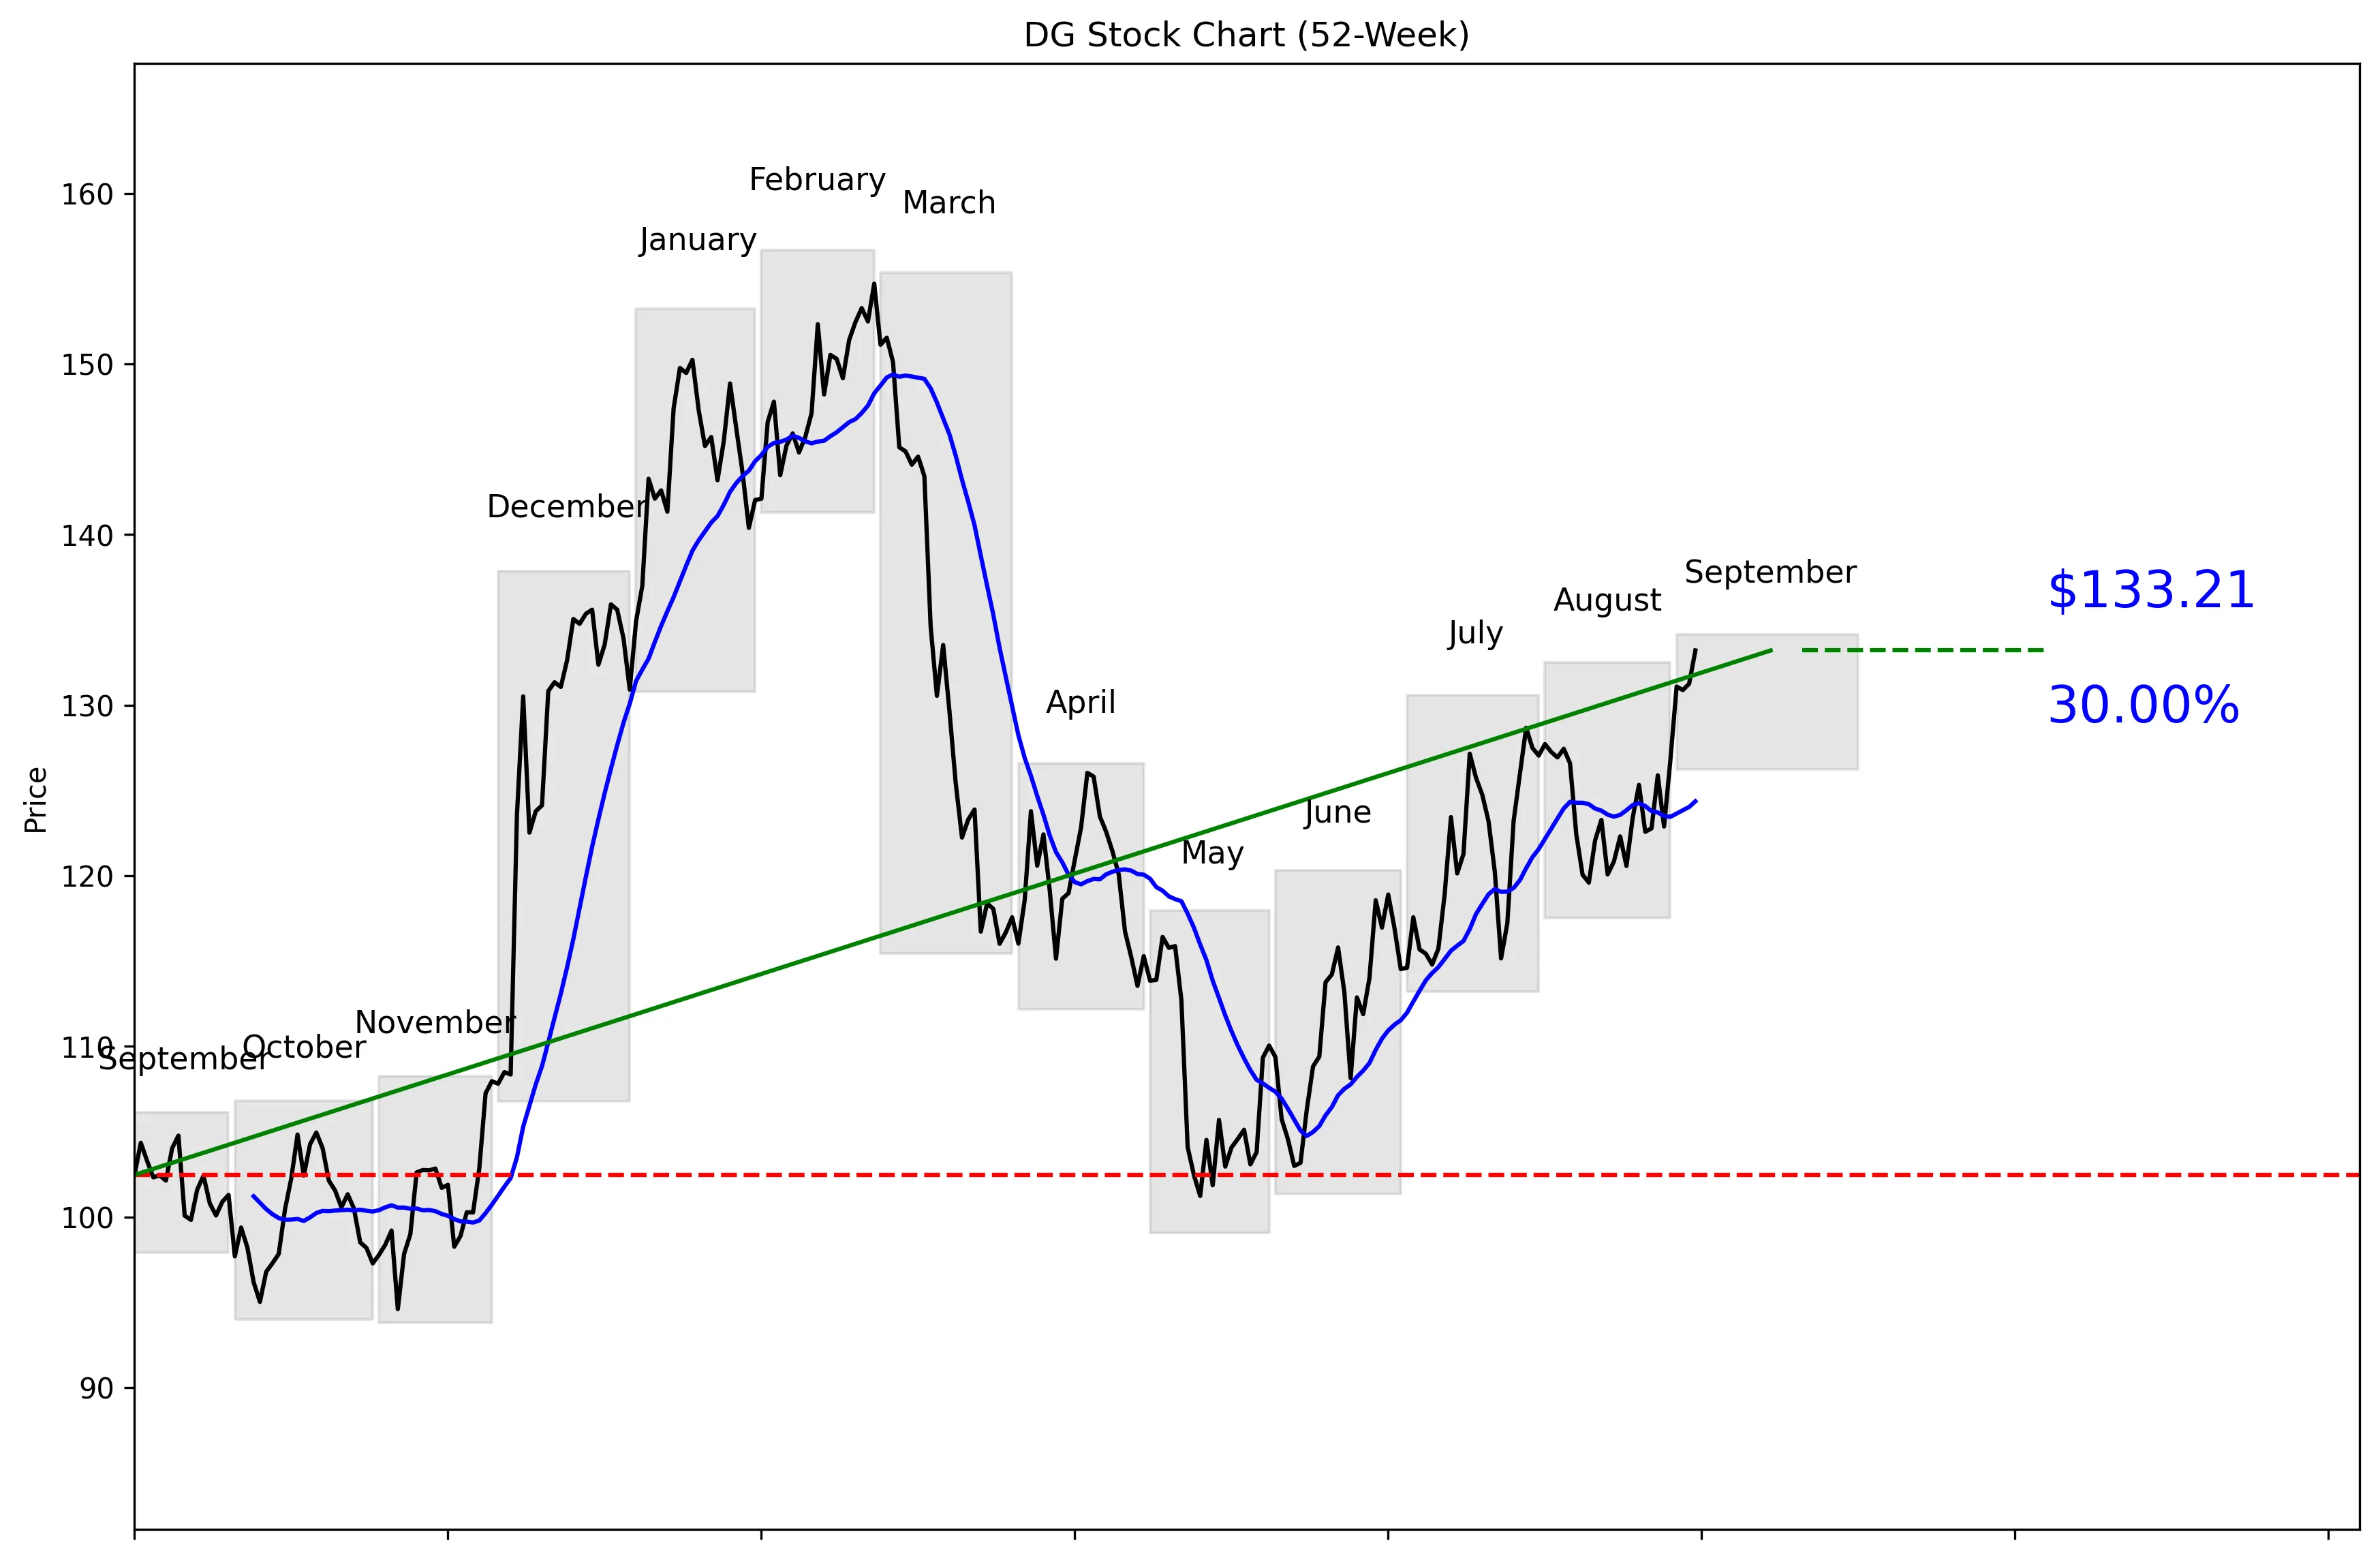
DG 52-Week Stock Chart
Technical Analysis
DG trades at $133.21, 63% of the way from its $93.78 52-week low to its $156.68 high. The stock is 14.98% below that high but 42.04% above the low. Price sits 7.11% above the 20-day moving average of $124.37. Momentum is positive, with gains of 8.40% over five trading days and 5.23% over 20 trading days. DG is testing near-term resistance at $133.21, while the 30-day low of $119.60 is the key support level.


Recent News and Developments

Argus lifts Dollar General target to $170

Argus raised its Dollar General price target from $165 to $170 on September 4 while keeping its Buy rating. The new target was 29.54% above the reported share price, a clear bullish call. Source: MarketBeat

DG gains 1.49% to close at $133.21

Dollar General shares closed at $133.21 on September 4, up 1.49% for the session. The stock also gained 3.42% on September 1, while slipping just 0.15% on September 2. Source: Stock Analysis

Dollar General executive sells $732,555 in stock

EVP and Chief People Officer Kathleen Reardon sold 5,578 DG shares at $131.33 on September 3. The transaction was worth $732,555 and reduced her directly owned position by 8.4% to 61,071 shares. Source: Insider Insights


Market Sentiment and Analyst Recommendations

Bull Case
Revenue is $43.64 billion and still growing at 5.2%, giving DG a large base with positive expansion. Demand has been strong across food, snacks, health, and beauty, while the $1 frozen-food program received a very strong customer response. Store traffic increased roughly 1% to 2% year over year during every month from March through July. The stock’s 8.40% five-day momentum and position 7.11% above its 20-day moving average show buyers are firmly in control. The 29-analyst recommendation is buy, with a consensus target of $138.93 and a high estimate of $176.00. Argus is even more bullish, raising its target from $165 to $170 while maintaining a Buy rating.
Bear Case
DG carries $15.77 billion in total debt against only $1.59 billion in cash, which is the biggest fundamental concern in the supplied data. That gap limits financial flexibility if revenue growth slows from its current 5.2% rate. At 17.30 times earnings, the valuation demands continued execution rather than merely stable sales. The consensus analyst target of $138.93 offers limited upside from the current $133.21 price. DG is also sitting directly at its $133.21 near-term resistance level after gaining 8.40% in five trading days, raising the risk of a pullback toward $119.60 support. Kathleen Reardon’s sale of 5,578 shares for $732,555 is not proof of trouble, but an 8.4% reduction in her directly owned position deserves attention after the recent rally.
What to Watch
Management’s Goldman Sachs conference appearance on September 15 at 10:45 a.m. ET is the next stated catalyst. Investors should listen for updates on store traffic after the reported 1% to 2% year-over-year monthly gains from March through July. Revenue growth must hold near or above 5.2% to support the 17.30 P/E. Price action around $133.21 matters because that level is both the current price and the 30-day high. A sustained move above $133.21 would keep the positive momentum intact, while a decline toward $119.60 would test near-term support. The balance sheet also needs scrutiny, with $15.77 billion in debt versus $1.59 billion in cash remaining the clearest threat to the thesis.
Analyst Consensus
BUY

Based on 29 analyst opinions
Low Target
$90.00
Mean Target
$138.93
High Target
$176.00


Earnings and Financial Data

Sector
Consumer Defensive
Industry
Discount Stores
Employees
194,000
Earnings & Dividends
Next Earnings
Aug 27, 2026
EPS (Trailing)
$7.70
Dividend Yield
177.0%
Payout Ratio
30.6%

Frequently Asked Questions

Is DG a good stock to buy?
The analyst recommendation is buy based on 29 analysts, and revenue is growing 5.2%. The stock also has positive five-day momentum of 8.40%, but it is currently testing resistance at $133.21. The takeaway: the data supports a bullish view, but the entry price is not cheap technically.
What is DG’s price target?
The analyst target is $138.93, with estimates ranging from $90.00 to $176.00. The current share price is $133.21. The takeaway: consensus expects upside, but the target range shows major disagreement.
What is DG’s 52-week trading range?
The key data lists a 52-week range of $95.11 to $158.23, while the computed technical price series shows a low of $93.78 and a high of $156.68. At $133.21, DG is 63% of the way from the technical low to the technical high. The takeaway: the stock sits in the upper half of its annual range.
Is DG stock overvalued?
DG trades at a P/E of 17.30 while revenue growth is 5.2%. The supplied data does not include peer valuations or historical P/E figures for comparison. The takeaway: the valuation requires continued growth, but the available data cannot establish that DG is overvalued.
What are DG’s key support and resistance levels?
Near-term support is the 30-day low of $119.60, and near-term resistance is the 30-day high of $133.21. The current price is exactly at that resistance level and 7.11% above the 20-day moving average. The takeaway: $133.21 is the immediate breakout test, while $119.60 is the key downside level.

Related Stock Reports

Disclaimer: This report is for informational purposes only and does not constitute financial advice. The analysis and opinions expressed are those of AltStation.io and should not be relied upon as the sole basis for investment decisions. Always conduct your own research and consult with a qualified financial advisor before making investment decisions. Past performance does not guarantee future results. Updated September 19, 2026.