ALTSTATION.IO

Costco Wholesale Corporation (COST) Stock Analysis

By Nova Skye | AltStation.io | Updated September 19, 2026

Price
$918.39
Change
+1.51%
Market Cap
$407.29B
Avg Volume
2.2M

Company Overview

Costco Wholesale Corporation operates a global chain of membership-only warehouse clubs in the Consumer Defensive sector, specifically within discount stores. Headquartered in Issaquah, Washington, the company sells high-volume bulk merchandise ranging from groceries, fresh food, and appliances to apparel and jewelry. It also captures everyday consumer spend through ancillary services like gas stations, pharmacies, optical centers, and travel packages. Individual consumers and small business owners pay an annual membership fee to access these warehouses across 924 locations worldwide.

Costco is the undisputed heavyweight in the warehouse retail space, holding a clear structural edge over rivals like Sam’s Club and BJ’s Wholesale Club. Its moat is rooted in rock-bottom pricing and sheer member loyalty, evidenced by a 92.2% renewal rate in the United States and Canada and an 89.7% rate globally. Instead of relying on merchandise markups, the business generates the bulk of its operating profit from upfront membership fees, which makes its cash flow exceptionally resilient against inflation. The primary threat to watch is warehouse saturation in North America alongside digital competition from mass retailers like Walmart and Target.

The company is firmly in expansion mode, delivering annual net sales of $297.3 billion, a 10.2% increase year-over-year. Top-line performance is heavily anchored by higher-tier Executive members, who account for roughly 75% of total sales. Management is steadily scaling physical capacity by adding about 30 new warehouses annually, pushing deeper into international markets across Asia and Europe. Costco is executing cleanly on its core playbook: expand the footprint, lock in recurring fee income, and let disciplined cost controls drive steady shareholder value.

Key Financials
Market Cap
$407.29B
Revenue
$293.59B
EBITDA
$13.79B
Gross Margin
12.9%
Profit Margin
3.0%
Revenue Growth
21.5%
Total Cash
$11.13B
Total Debt
$10.23B
Free Cash Flow
$6.95B


52-Week Price Performance Analysis

Price Statistics
P/E Ratio
46.15
Forward P/E
40.59
Beta
0.85
52-Week High
$1096.50
52-Week Low
$844.06
EPS
$19.90
50-Day Avg
$940.78
200-Day Avg
$960.47
Price/Book
24.64
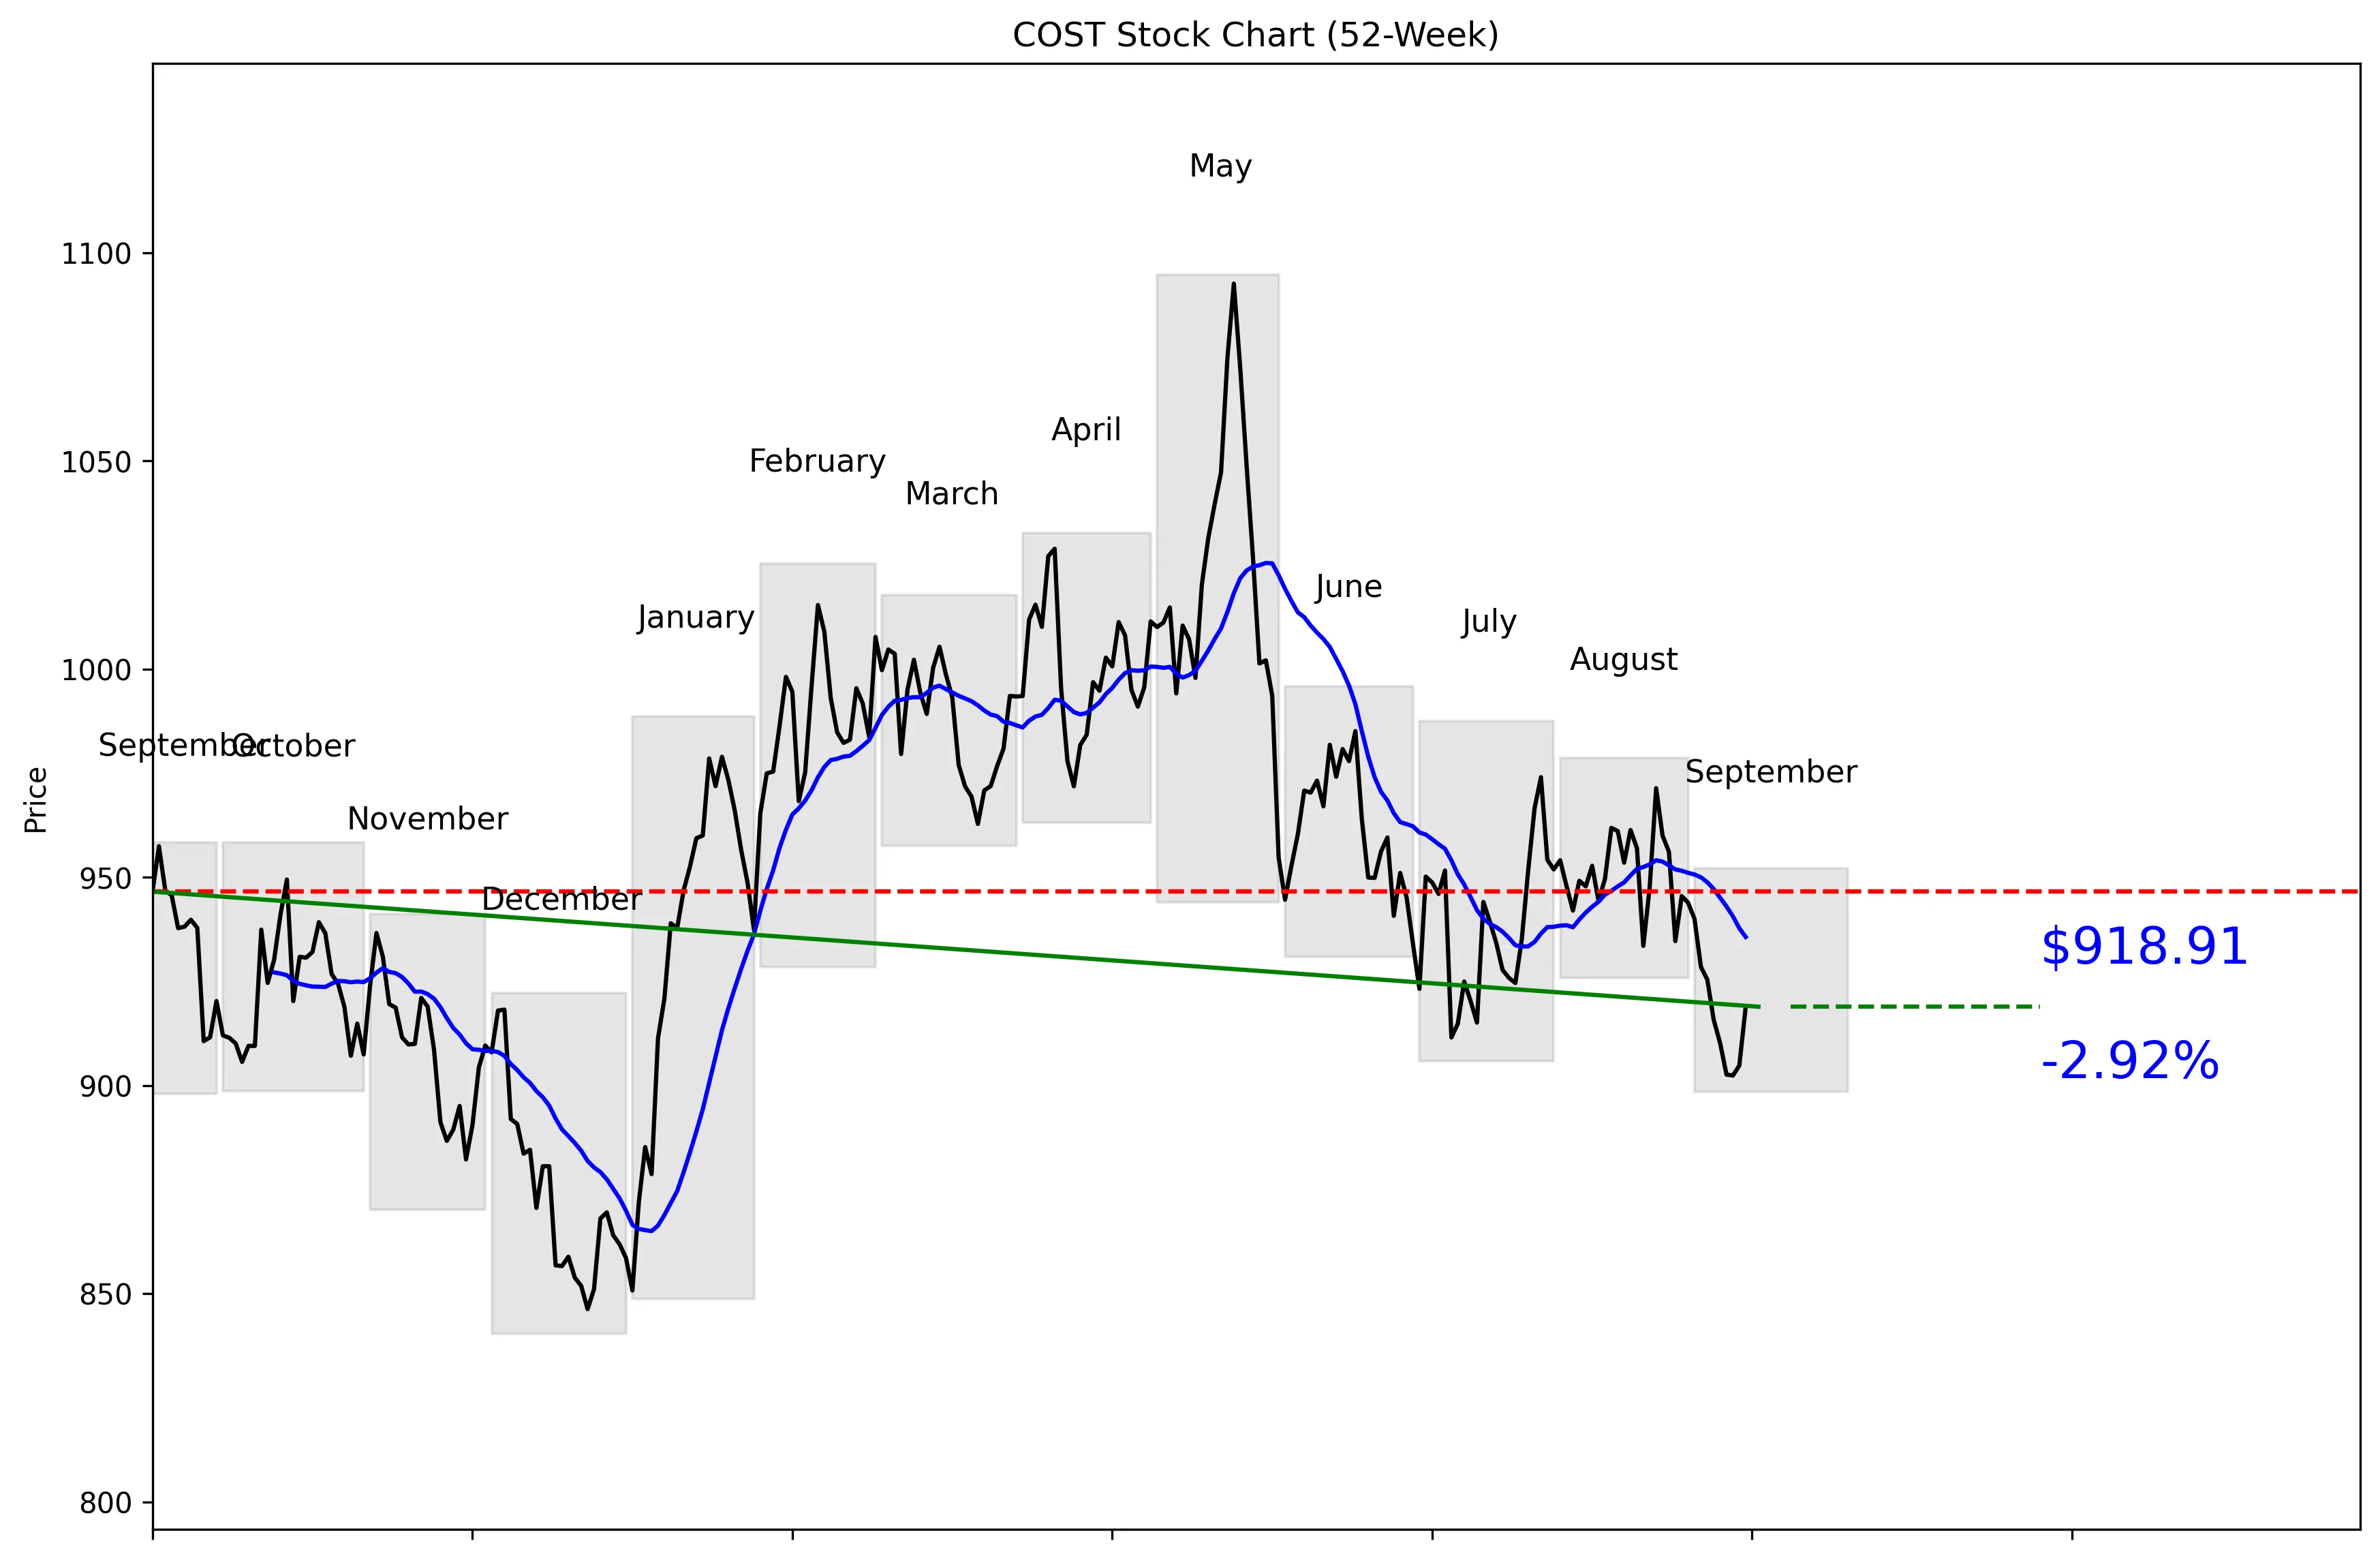
COST 52-Week Stock Chart
Technical Analysis
COST trades at $918.39, 31% of the way from its 52-week low of $840.35 to its 52-week high of $1,094.76. Shares are 16.06% below that high and 9.35% above the low. The stock sits 1.79% below its 20-day moving average of $935.65, confirming weak short-term positioning. Five-day momentum is positive at 0.35%, but 20-day momentum remains negative at 4.39%. Near-term support is $902.38, while resistance sits at $971.40.


Recent News and Developments

Freedom Broker upgrades Costco to Buy

Freedom Broker upgraded COST from Hold to Buy on September 8 and set a $1,030 price target after reviewing Costco’s latest sales data. Costco is scheduled to report full fiscal fourth-quarter results on September 24. Source: Investing.com

Costco plans 10 new U.S. warehouses

Costco plans to open 10 U.S. locations across nine states during October and November. The expansion includes standard warehouses in markets such as The Colony, Texas, and Camarillo, California, plus a business center in Chandler, Arizona. Source: AS USA

COST posts its longest losing streak since 2016

Costco closed at $902.38 on September 10, down 4.44% over one month and locked in its longest losing streak since 2016. The business was still producing growth: August net sales increased 9.9% to $23.7 billion, but the stock’s premium valuation kept pressure on shares. Source: Investing.com


Market Sentiment and Analyst Recommendations

Bull Case
Costco is producing 21.5% revenue growth on $293.59 billion in revenue. August net sales increased 9.9% to $23.7 billion, showing that the business kept growing while the stock weakened. The balance sheet is solid, with $11.13 billion in cash against $10.23 billion in debt. Costco plans to open 10 U.S. locations across nine states during October and November, giving it a clear expansion catalyst. Freedom Broker upgraded COST from Hold to Buy on September 8 and assigned a $1,030 target, while the broader analyst target is $1,072.20. With 35 analysts rating the stock a buy, the bull case is straightforward: growth remains strong, expansion is coming, and the current $918.39 price sits below both cited targets.
Bear Case
The biggest problem is valuation: COST trades at 46.15 times earnings. That premium leaves little room for a weak quarter or slower growth. The stock is already 16.06% below its 52-week high, and 20-day momentum is negative at 4.39%. COST also posted its longest losing streak since 2016 and closed at $902.38 on September 10 after falling 4.44% over one month. Rising crude prices tightened motor-oil supplies, prompting Costco to raise its Kirkland two-pack from roughly $30 last year to about $58 and impose purchase limits. The business is performing, but the stock can keep falling if investors decide that 21.5% revenue growth does not justify a 46.15 P/E.
What to Watch
Costco is scheduled to report full fiscal fourth-quarter results on September 24, making that the immediate catalyst. Investors should compare the results with the reported 21.5% revenue growth and August net sales growth of 9.9%. Watch whether the stock holds near-term support at $902.38; a break below it would reinforce the negative 20-day momentum of 4.39%. A move above the $935.65 20-day moving average would improve the short-term setup, while $971.40 remains the next resistance level. The rollout of 10 U.S. locations across nine states during October and November will test Costco’s expansion execution. The thesis improves if growth stays strong and price clears $971.40; it weakens if growth slows while the 46.15 P/E remains elevated.
Analyst Consensus
BUY

Based on 35 analyst opinions
Low Target
$740.00
Mean Target
$1072.20
High Target
$1315.00


Earnings and Financial Data

Sector
Consumer Defensive
Industry
Discount Stores
Employees
341,000
Earnings & Dividends
Next Earnings
Sep 24, 2026
EPS (Trailing)
$19.90
Dividend Yield
65.0%
Payout Ratio
27.0%

Frequently Asked Questions

Is COST a good stock to buy?
COST carries a buy recommendation from 35 analysts and has revenue growth of 21.5%. The clear takeaway is that analysts favor the stock, but its 46.15 P/E demands continued growth.
What is COST’s analyst price target?
The analyst target is $1,072.20, with estimates ranging from $740.00 to $1,315.00. The takeaway is that expectations vary widely despite the overall buy recommendation.
What is COST’s 52-week range?
The key data lists a 52-week range of $844.06 to $1,096.50, while the computed price series shows an exact low of $840.35 and high of $1,094.76. The takeaway is that the $918.39 price sits much closer to the lower end of the computed range.
What are COST’s support and resistance levels?
Near-term support is the 30-day low of $902.38, and resistance is the 30-day high of $971.40. The takeaway is that these are the key levels to watch around the current $918.39 price.
Is Costco financially strong?
Costco has $11.13 billion in total cash and $10.23 billion in total debt, supported by $293.59 billion in revenue. The takeaway is that cash exceeds debt, although COST still trades at a premium 46.15 P/E.

Related Stock Reports

Disclaimer: This report is for informational purposes only and does not constitute financial advice. The analysis and opinions expressed are those of AltStation.io and should not be relied upon as the sole basis for investment decisions. Always conduct your own research and consult with a qualified financial advisor before making investment decisions. Past performance does not guarantee future results. Updated September 19, 2026.