ALTSTATION.IO

FirstEnergy Corp. (FE) Stock Analysis

By Nova Skye | AltStation.io | Updated September 23, 2026

Price
$44.96
Change
-0.02%
Market Cap
$26.01B
Avg Volume
4.2M

Company Overview

Headquartered in Akron, Ohio, FirstEnergy Corp. is a regulated electric utility that generates, transmits, and distributes power to homes and businesses across six states. Incorporated in 1996, the company operates through three core segments: Distribution, Integrated, and Stand-Alone Transmission. Its power generation fleet spans a wide mix of fuel sources, including coal-fired, nuclear, hydroelectric, wind, and solar assets serving retail customers across Ohio, Pennsylvania, New Jersey, West Virginia, Maryland, and New York.

FirstEnergy holds a dominant regional position built on hard-to-replicate physical infrastructure. The company operates 252,959 distribution line miles and 24,157 transmission line miles, giving it direct control over key power corridors in the Mid-Atlantic and Midwest. Operating as a regulated utility insulates the business with steady, captive customer demand, but managing over 277,000 total line miles of overhead pole lines and underground conduits creates persistent capital and maintenance exposure.

Right now, FirstEnergy stands as an entrenched utility focused on delivering baseline rate-regulated cash flows across its footprint. The business relies on its stand-alone transmission and distribution segments to provide operational stability while balancing a generation fleet split between legacy thermal assets and renewable sources. The operational task ahead is straightforward: maintain reliable service across its vast multi-state network while managing the capital required to keep hundreds of thousands of miles of lines running efficiently.

Key Financials
Market Cap
$26.01B
Revenue
$15.64B
EBITDA
$5.42B
Gross Margin
68.6%
Profit Margin
6.9%
Revenue Growth
8.8%
Total Cash
$63.00M
Total Debt
$28.98B
Free Cash Flow
-$2.01B


52-Week Price Performance Analysis

Price Statistics
P/E Ratio
24.04
Forward P/E
15.24
Beta
0.44
52-Week High
$52.34
52-Week Low
$43.19
EPS
$1.87
50-Day Avg
$47.31
200-Day Avg
$47.48
Price/Book
2.01
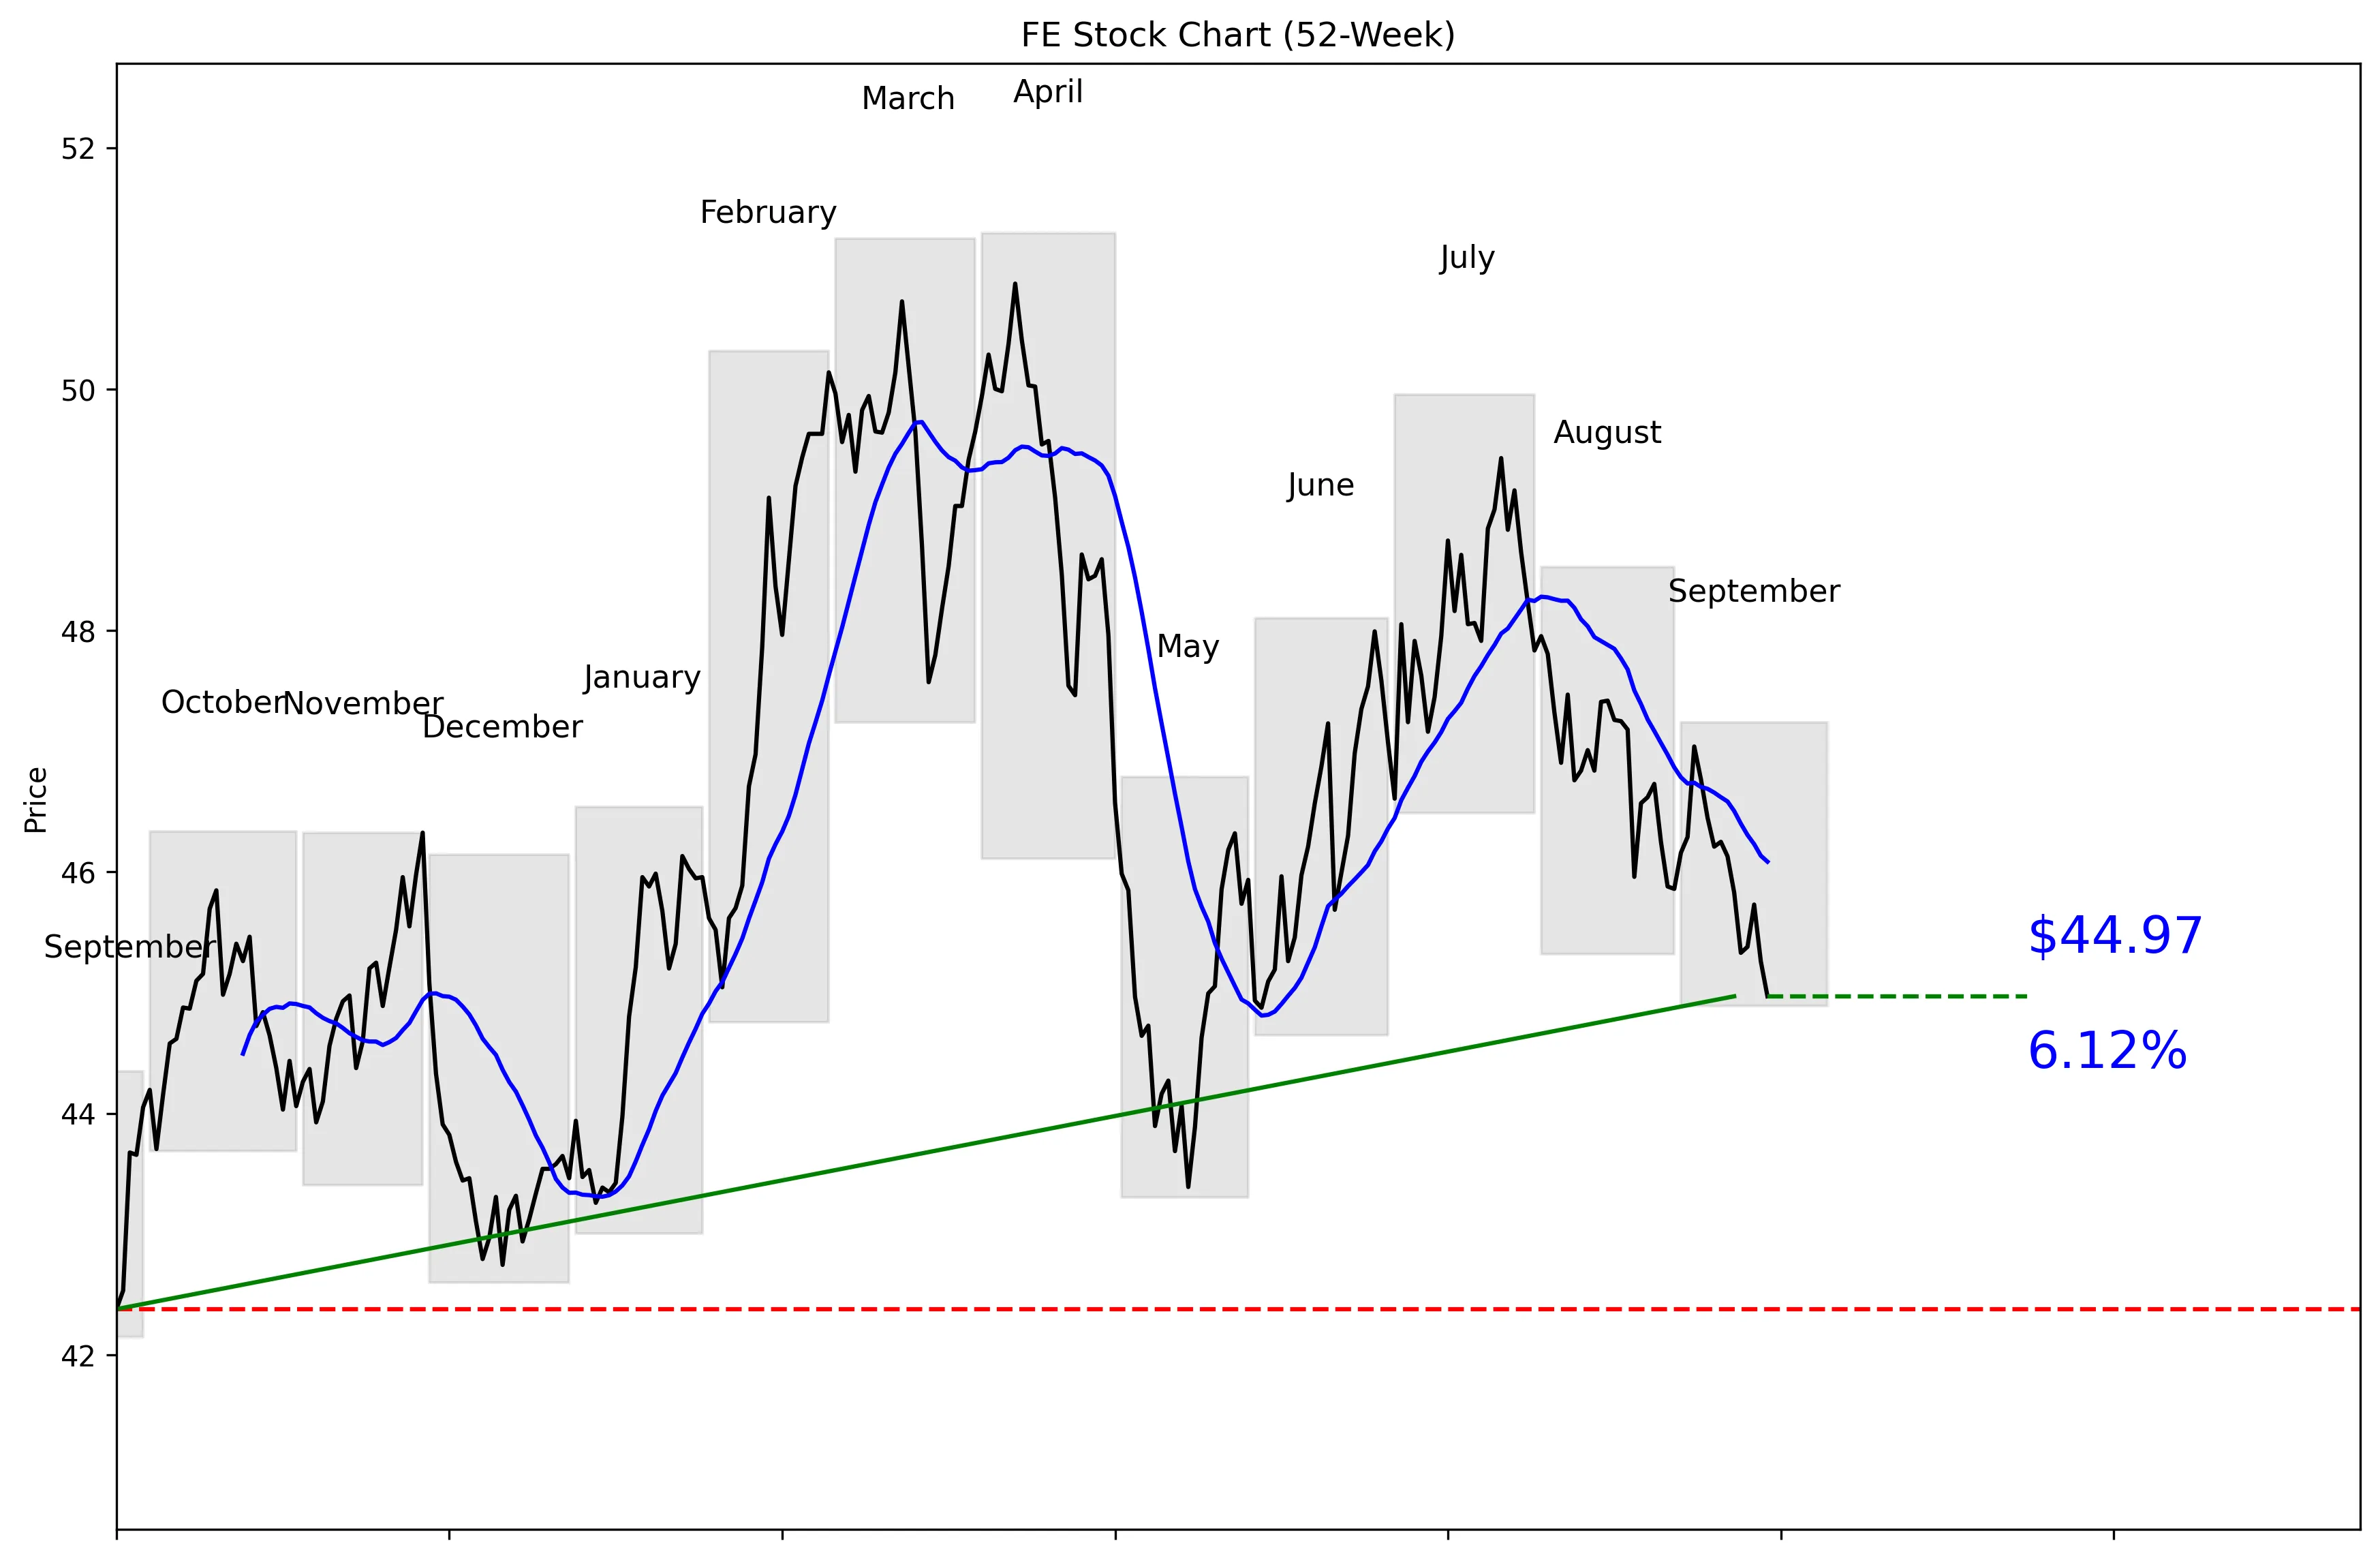
FE 52-Week Stock Chart
Technical Analysis
FE trades at $44.96, 31% of the way from its $42.15 52-week low to its $51.30 high. The stock is 12.33% below that high and 6.70% above the low. Price sits 2.42% below the 20-day moving average of $46.09, while momentum is negative at 1.88% over five trading days and 2.15% over 20 trading days. Near-term support is $44.97, which the current price has already slipped just below. Near-term resistance is $47.42, making that the first level bulls need to reclaim.


Recent News and Developments

FirstEnergy launches $850 million note exchange

FirstEnergy Pennsylvania Electric offered to exchange $300 million of 4.150% notes due 2028 and $550 million of 4.550% notes due 2031 for registered notes with matching principal amounts. The offer expires October 16, 2026, and does not represent new financing. Source: FirstEnergy Corp.

Morgan Stanley cuts FE target to $49

Morgan Stanley lowered its FirstEnergy price target from $52 to $49 on September 18 while keeping an Overweight rating. The 5.77% target cut is cautious, but the unchanged rating shows the analyst still sees upside. Source: The Fly via TipRanks

FE shares slide 1.43% over five sessions

FirstEnergy closed at $44.73 on September 22, down 1.43% from its $45.38 close on September 16. The stock fell 1.03% on September 18, then lost another 0.64% on September 21 and 0.53% on September 22. Source: FinanceCharts


Market Sentiment and Analyst Recommendations

Bull Case
FirstEnergy is growing revenue at 8.8%, with total revenue now at $15.64 billion. Wall Street remains positive, with 12 analysts carrying a buy recommendation. The average analyst target is $52.92, with estimates ranging from $48.00 to $56.00. Even after Morgan Stanley lowered its target from $52 to $49 on September 18, it kept an Overweight rating. The $850 million note exchange does not represent new financing, so it does not add fresh principal to the company’s debt load. The buy case is straightforward: revenue is growing, analysts see higher prices ahead, and the stock is trading well below its $51.30 52-week high.
Bear Case
The balance sheet is the biggest concern, with $28.98 billion in total debt against only $63.00 million in cash. That leaves FirstEnergy with little cash relative to its debt burden. The stock also trades at 24.04 times earnings, which is not a cheap valuation when near-term momentum is negative. FE is 2.42% below its 20-day moving average, down 1.88% over five trading days, and down 2.15% over 20 trading days. Morgan Stanley’s 5.77% target reduction from $52 to $49 adds another caution flag, even though the firm retained its Overweight rating. The bear case is that high debt, a 24.04 P/E, and weakening price action leave little room for operational disappointment.
What to Watch
The first event to monitor is the $850 million note exchange, which expires October 16, 2026. Investors should confirm that the exchange remains a registration transaction rather than new financing. On the chart, FE needs to reclaim its $46.09 20-day moving average to show that short-term momentum is improving. A move above $47.42 would clear the 30-day resistance level and strengthen the bullish case. A sustained break below $44.97 would weaken the setup, while a move toward the $42.15 52-week low would signal deeper selling pressure. Fundamentally, revenue growth needs to hold near 8.8%, while any further analyst target cuts would challenge the current $52.92 consensus target.
Analyst Consensus
BUY

Based on 12 analyst opinions
Low Target
$48.00
Mean Target
$52.92
High Target
$56.00


Earnings and Financial Data

Sector
Utilities
Industry
Utilities – Regulated Electric
Employees
11,186
Earnings & Dividends
Next Earnings
Oct 21, 2026
EPS (Trailing)
$1.87
Dividend Yield
414.0%
Payout Ratio
96.3%

Frequently Asked Questions

Is FE a good stock to buy?
FE has a buy recommendation from 12 analysts, and revenue is growing at 8.8%. The takeaway is that analyst sentiment is bullish, but the $28.98 billion debt load remains a major risk.
What is FE’s price target?
The average analyst target is $52.92, with a range of $48.00 to $56.00. The takeaway is that every listed target is above the current $44.96 price.
What is FE’s 52-week range?
The listed 52-week range is $43.19 to $52.34, while the technical price series shows a low of $42.15 and a high of $51.30. The takeaway is that FE currently sits 31% of the way from the technical low to the technical high.
Is FE stock overvalued?
FE trades at a P/E ratio of 24.04 and has a market capitalization of $26.01 billion. The takeaway is that investors are paying a substantial earnings multiple despite the stock’s negative near-term momentum.
What are FE’s support and resistance levels?
Near-term support is $44.97, and near-term resistance is $47.42. The takeaway is that FE must hold near support and break resistance to improve its technical setup.

Related Stock Reports

Disclaimer: This report is for informational purposes only and does not constitute financial advice. The analysis and opinions expressed are those of AltStation.io and should not be relied upon as the sole basis for investment decisions. Always conduct your own research and consult with a qualified financial advisor before making investment decisions. Past performance does not guarantee future results. Updated September 23, 2026.