ALTSTATION.IO

CMS Energy Corporation (CMS) Stock Analysis

By Nova Skye | AltStation.io | Updated October 06, 2026

Price
$64.44
Change
+1.11%
Market Cap
$20.21B
Avg Volume
3.6M

Company Overview

CMS Energy Corporation is a regulated utility headquartered in Jackson, Michigan, operating within the Regulated Electric and Gas Utilities sector. The company generates, purchases, transmits, and sells power and natural gas to 1.9 million electric customers and 1.8 million gas customers across Michigan. Its customer base covers residential, commercial, and diversified industrial users. Operations are organized across three distinct segments: Electric Utility, Gas Utility, and NorthStar Clean Energy.

CMS operates as a dominant regional incumbent with a physical infrastructure footprint that creates an immense competitive moat. The electric utility segment controls 82,854 miles of overhead distribution lines, 10,027 miles of underground lines, and 1,102 substations, while the gas unit maintains 28,433 miles of distribution mains and 14 storage fields. Regulated utility status provides predictable, recession-resistant cash flow, though state regulatory oversight caps aggressive margin upside. A captive customer base across core Michigan territories insulates the business from meaningful competitive threats.

CMS is currently managing a broad power generation mix while developing clean energy assets. Electricity generation draws from coal, wind, gas, oil, and nuclear facilities, while the NorthStar Clean Energy unit focuses on independent power production and renewable project development. System reliability across 2,337 miles of gas transmission lines and tens of thousands of miles of electric circuits drives ongoing capital allocation. CMS remains a straightforward defensive holding focused on essential power delivery and steady asset deployment.

Key Financials
Market Cap
$20.21B
Revenue
$8.81B
EBITDA
$3.02B
Gross Margin
40.3%
Profit Margin
11.6%
Revenue Growth
-0.5%
Total Cash
$241.00M
Total Debt
$19.30B
Free Cash Flow
-$2.20B


52-Week Price Performance Analysis

Price Statistics
P/E Ratio
19.35
Forward P/E
15.51
Beta
0.31
52-Week High
$80.36
52-Week Low
$62.29
EPS
$3.33
50-Day Avg
$68.42
200-Day Avg
$72.83
Price/Book
2.12
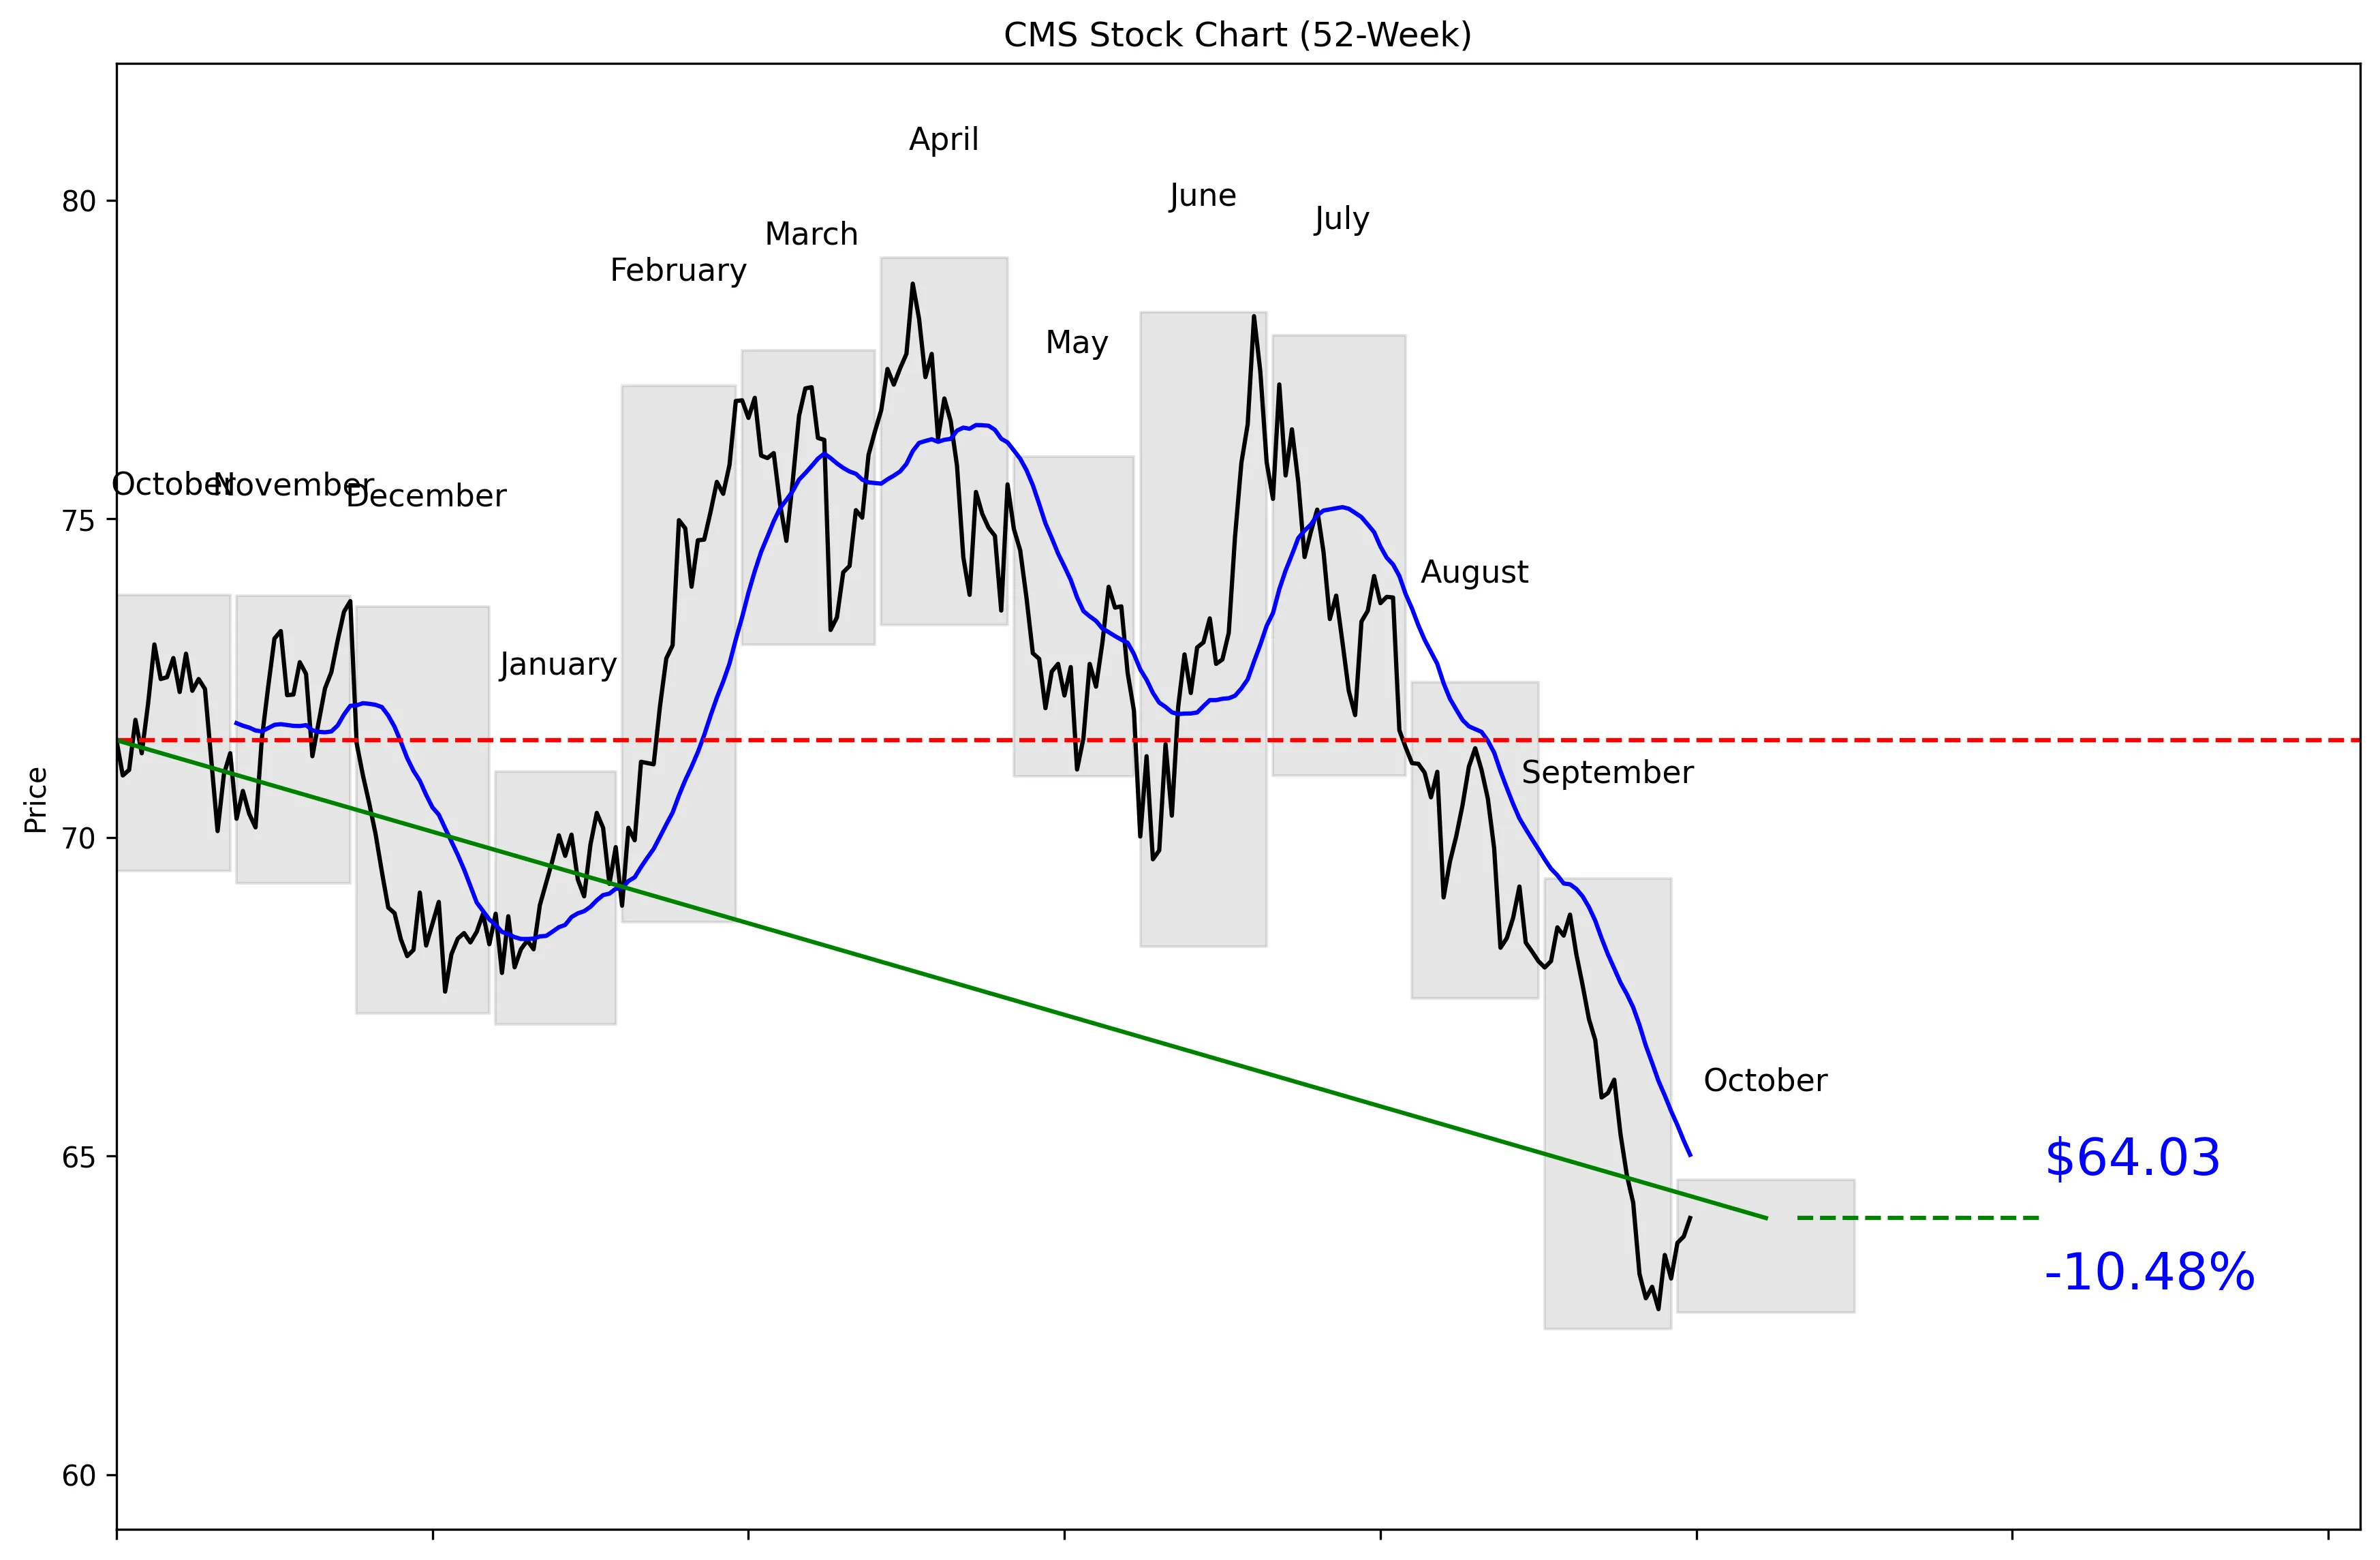
CMS 52-Week Stock Chart
Technical Analysis
CMS trades at $64.44, just 10% of the way from its $62.29 52-week low to its $79.10 52-week high. The stock is 19.05% below that high and only 2.79% above the low, putting it near the bottom of its annual range. Price sits 1.53% below the 20-day moving average of $65.02. Five-day momentum is positive at 2.28%, but 20-day momentum remains weak at -6.47%. Near-term support is $62.60, while resistance is $69.23.


Recent News and Developments

Scotiabank reiterates Sector Outperform rating

Scotiabank reiterated its Sector Outperform rating on CMS Energy on October 1 and maintained a $78 price target. The target was 23.65% above the stock’s September 30 closing price of $63.08. Source: TickerGate

CMS shares gain 0.91% over five sessions

CMS closed at $64.03 on October 5, up 0.91% from $63.45 on September 29. The stock gained 1.36% on September 29, fell 0.58% on September 30, then advanced during each of the next three sessions. Source: ChartExchange

CMS Energy publishes October investor presentation

CMS Energy held its October investor meetings on October 1 at 4:30 p.m. ET. The company published a 1.98 MB presentation for investors alongside the event. Source: CMS Energy


Market Sentiment and Analyst Recommendations

Bull Case
CMS has a buy recommendation from 12 analysts and a consensus target of $77.92. Even the low end of the analyst range, $68.00, sits above the current $64.44 price, while the high estimate reaches $86.00. Scotiabank reinforced the bullish view on October 1 by maintaining its Sector Outperform rating and $78 target. The stock also showed signs of stabilizing, gaining 0.91% across the five sessions ending October 5. Five-day momentum is now positive at 2.28%, and the shares remain close to the $62.60 near-term support level. At 19.35 times earnings, investors are buying a $20.21 billion company with $8.81 billion in revenue at a price well below the analyst consensus target.
Bear Case
Revenue growth is negative at -0.5%, so the company is not currently producing a strong top-line growth story. Total debt stands at $19.30 billion against only $241.00 million in cash, creating a heavily leveraged balance sheet. The stock trades at 19.35 times earnings despite declining revenue, which leaves little room for weak execution. CMS is 1.53% below its 20-day moving average, and 20-day momentum is -6.47%. The current price is only 2.79% above the 52-week low and remains close to $62.60 support. A break below $62.60 would weaken the technical picture, while failure to clear $69.23 would show that sellers still control the near-term trend.
What to Watch
The first threshold is $62.60, the 30-day low and nearest support level. A sustained move above the $65.02 20-day moving average would improve the short-term trend. The larger test is $69.23, the 30-day high and near-term resistance level. Investors should track whether the positive 2.28% five-day momentum can reverse the negative 6.47% 20-day reading. Revenue growth also needs attention because the current rate is -0.5%. The October 1 investor presentation should be reviewed for evidence that management can improve growth while handling $19.30 billion in debt and $241.00 million in cash. The bullish thesis strengthens above $69.23 and weakens below $62.60.
Analyst Consensus
BUY

Based on 12 analyst opinions
Low Target
$68.00
Mean Target
$77.92
High Target
$86.00


Earnings and Financial Data

Sector
Utilities
Industry
Utilities – Regulated Electric
Employees
8,350
Earnings & Dividends
Next Earnings
Oct 29, 2026
EPS (Trailing)
$3.33
Dividend Yield
358.0%
Payout Ratio
66.8%

Frequently Asked Questions

Is CMS a good stock to buy?
CMS has a buy recommendation from 12 analysts, but revenue growth is -0.5% and total debt is $19.30 billion. The takeaway is that analyst sentiment is bullish, while the financial profile still carries clear risk.
What is CMS’s price target?
The consensus analyst target is $77.92, with estimates ranging from $68.00 to $86.00. The takeaway is that every listed target is above the current $64.44 price.
What is CMS’s 52-week range?
The listed 52-week range is $62.29 to $80.36, while the technical price series shows a $62.29 low and a $79.10 high. The takeaway is that CMS is trading near the bottom of its annual range.
What are the support and resistance levels for CMS?
Near-term support is $62.60, and near-term resistance is $69.23. The takeaway is that these are the key price thresholds to watch.
Does CMS pay a dividend?
The provided data does not include CMS’s dividend rate, yield, or payment history. The takeaway is that no dividend conclusion can be made from this data alone.

Related Stock Reports

Disclaimer: This report is for informational purposes only and does not constitute financial advice. The analysis and opinions expressed are those of AltStation.io and should not be relied upon as the sole basis for investment decisions. Always conduct your own research and consult with a qualified financial advisor before making investment decisions. Past performance does not guarantee future results. Updated October 06, 2026.