ALTSTATION.IO

Elevance Health, Inc. (ELV) Stock Analysis

By Nova Skye | AltStation.io | Updated October 30, 2026

Price
$416.53
Change
-1.18%
Market Cap
$90.33B
Avg Volume
1.2M

Company Overview

Elevance Health, based in Indianapolis, Indiana, is one of the largest managed care providers in the United States healthcare sector. The company sells commercial health insurance, Medicare, Medicaid, and specialized dental and vision plans to individuals, employers, and government programs. Beyond core insurance under its Anthem Blue Cross Blue Shield and Wellpoint brands, it operates pharmacy benefit management and clinical care services through CarelonRx and Carelon Services. In total, the business serves roughly 45.7 million medical members across the country.

Elevance operates as a dominant market leader in healthcare plans, running exclusive Blue Cross Blue Shield franchises across 14 states. That regional scale gives the company solid pricing power and deeply entrenched employer relationships that competitors like UnitedHealth Group and CVS Health struggle to dislodge. The main headwind is heavy exposure to government-sponsored healthcare, where state-level Medicaid eligibility redeterminations cut into enrollment numbers. Elevance wins when commercial enrollment stays steady, but policy shifts and medical cost fluctuations in its government books remain direct threats to margin stability.

The business is actively pivoting from a traditional health insurer into an integrated health services provider, marked by its June 2022 rebrand from Anthem. Total operating revenue climbed roughly 3% to $175.2 billion in 2024, supported by double-digit expansion in its Carelon services arm. Carelon delivered $53.9 billion in operating revenue for 2024, up 12% year-over-year, demonstrating that in-house pharmacy services and clinical data analytics are cushioning core insurance attrition. Elevance is no longer just collecting premiums; it is capturing more revenue per member by treating healthcare services as its main growth engine.

Key Financials
Market Cap
$90.33B
Revenue
$201.83B
EBITDA
$8.71B
Gross Margin
26.4%
Profit Margin
2.5%
Revenue Growth
1.4%
Total Cash
$37.85B
Total Debt
$30.76B
Free Cash Flow
$7.99B


52-Week Price Performance Analysis

Price Statistics
P/E Ratio
17.69
Forward P/E
13.75
Beta
0.71
52-Week High
$450.69
52-Week Low
$274.84
EPS
$23.55
50-Day Avg
$409.29
200-Day Avg
$371.66
Price/Book
2.01
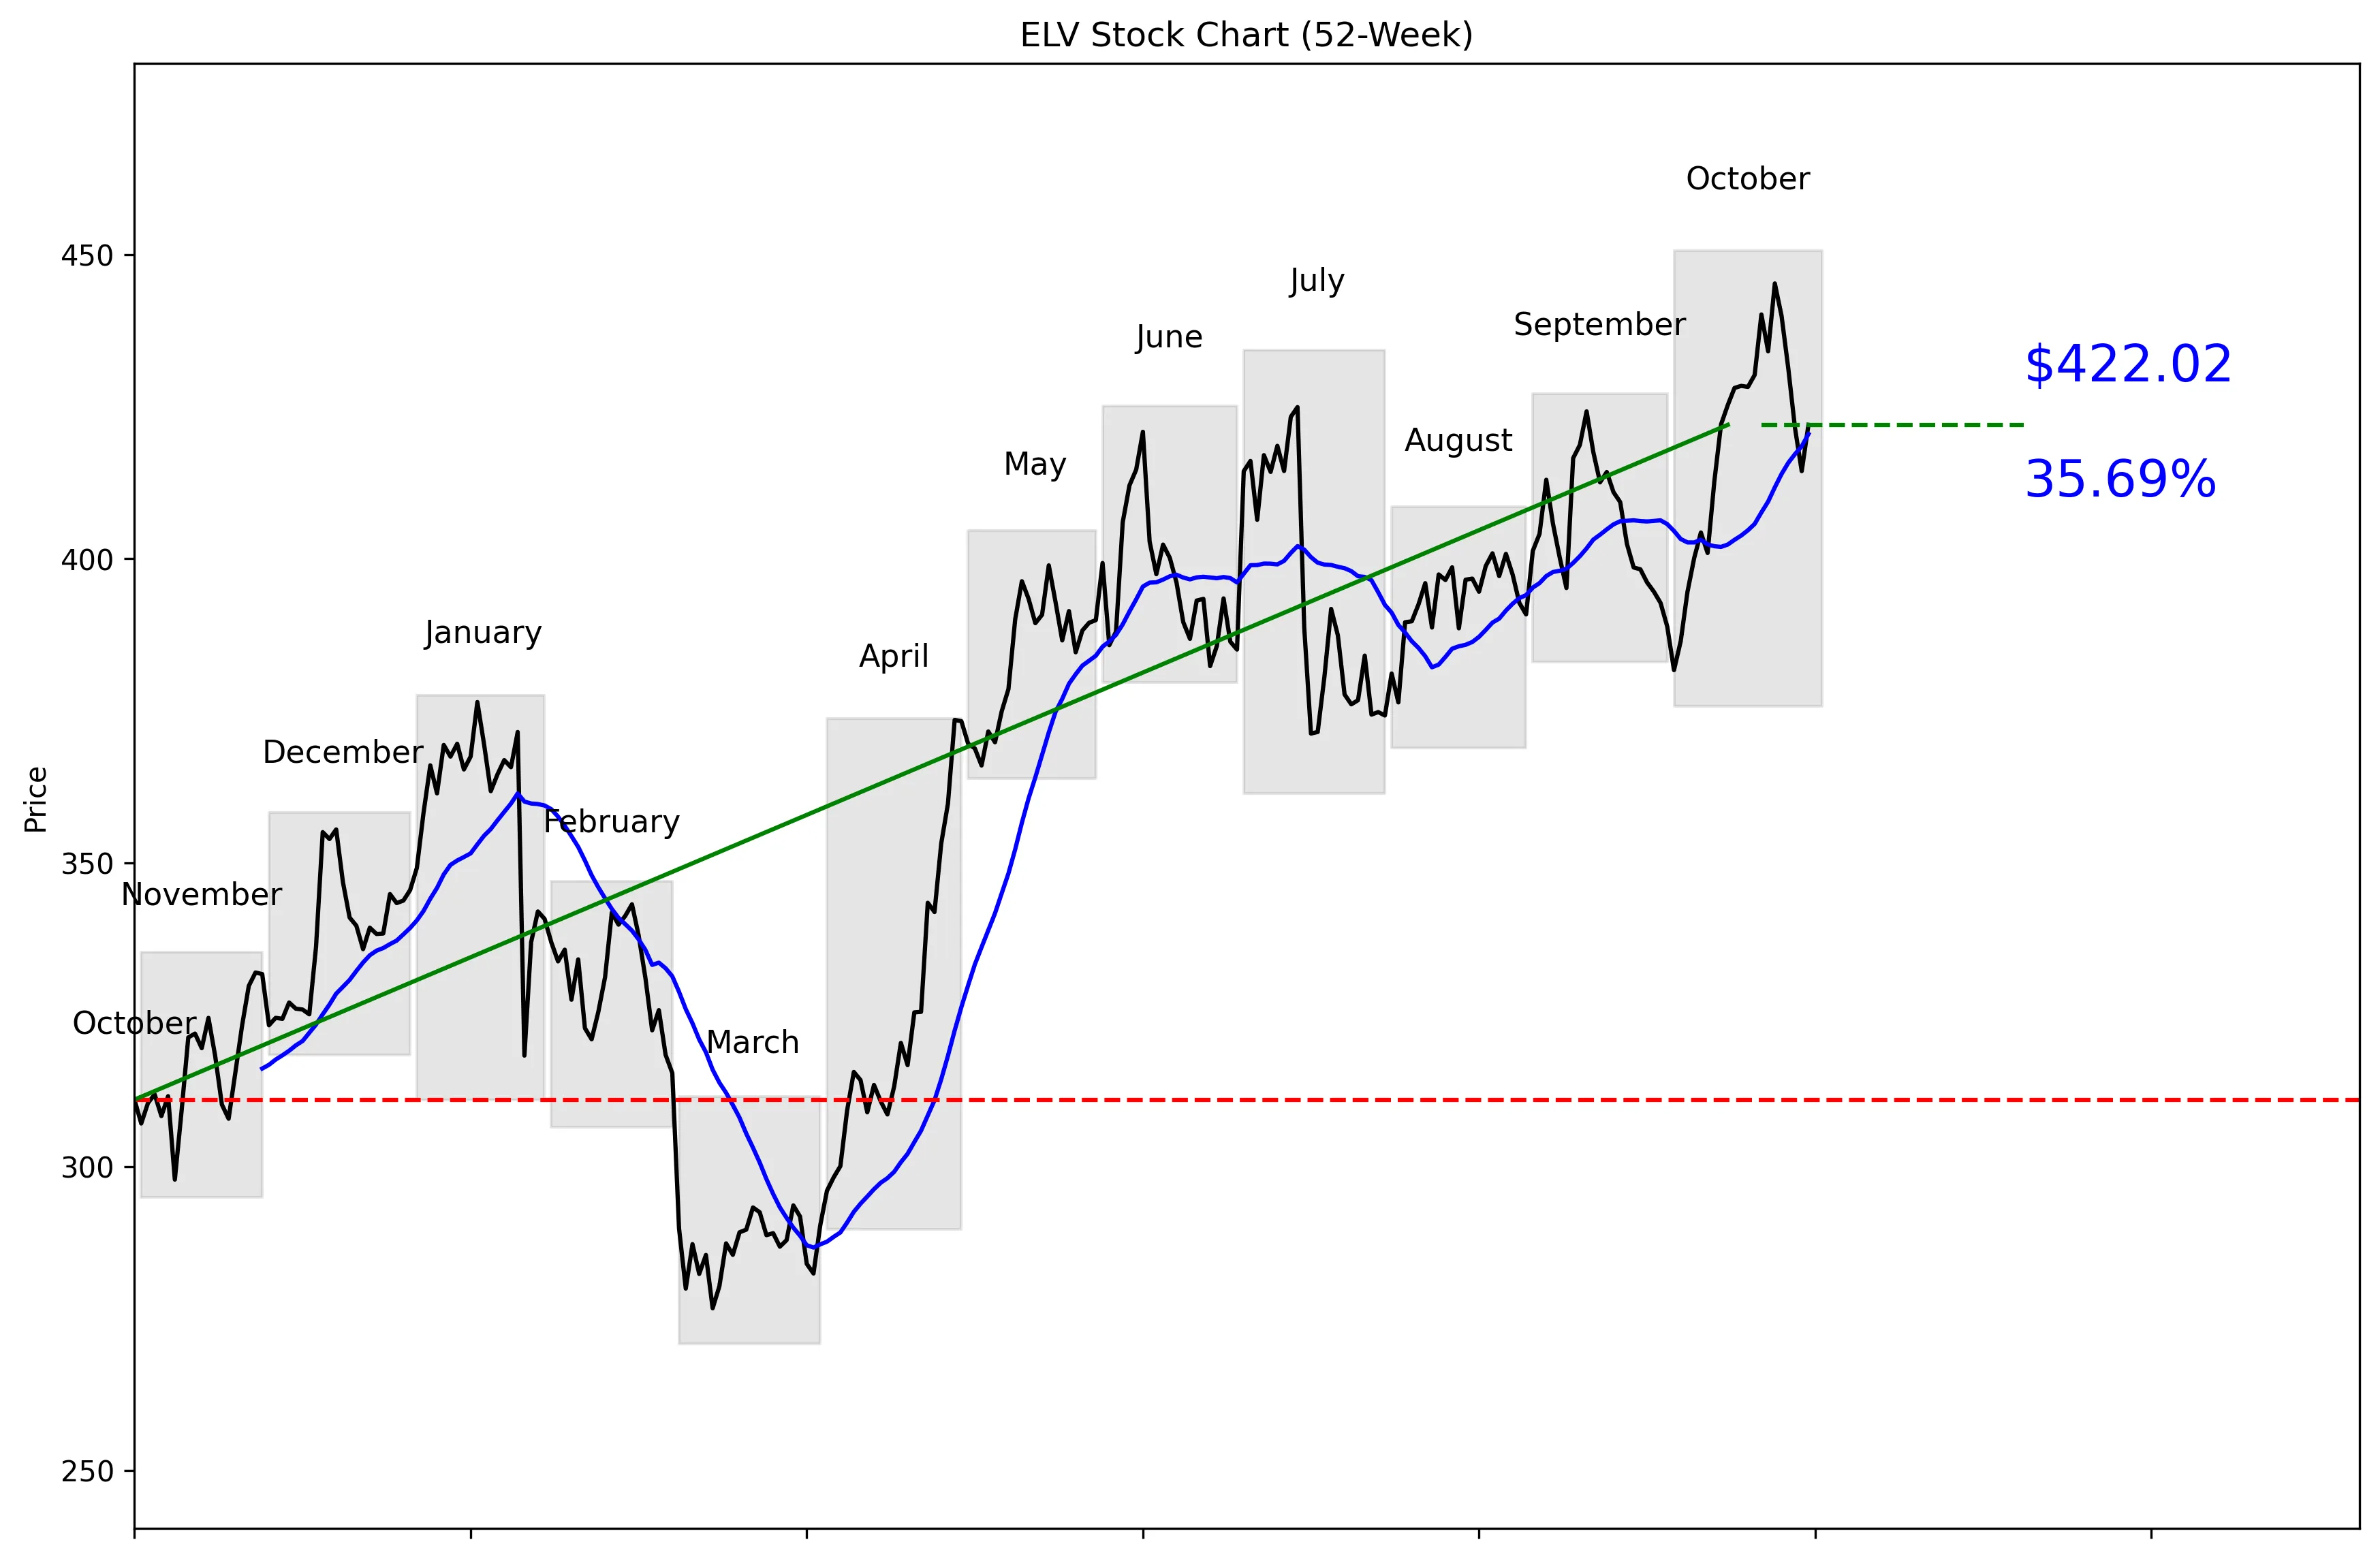
ELV 52-Week Stock Chart
Technical Analysis
ELV trades at $416.53, placing it 84% of the way from its $270.87 52-week low to its $450.69 high. The stock is 6.36% below that high and 55.80% above the low. Price sits near the $420.51 20-day moving average, with the supplied technical comparison showing a 0.36% difference. Momentum is mixed: ELV fell 5.22% over the last five trading days but gained 10.57% over the last 20. Near-term support is $381.67, while $445.28 is the resistance level to beat.


Recent News and Developments

Wells Fargo lifts Elevance target to $492

Wells Fargo analyst Stephen Baxter raised Elevance Health’s price target from $473 to $492 on October 27 while maintaining an Overweight rating. That is a bullish call, but the stock still closed at $422.02 on October 29. Source: StreetInsider

Tennessee Medicaid rates offer limited upside

Tennessee published Medicaid capitation rates effective January 1, 2027, implying roughly 5% repricing for Elevance, according to Evercore ISI. Elevance manages 395,000 Tennessee members, but Evercore expects the added 2027 adjusted EPS impact to be negligible. Source: TheFly

Elevance files broad securities shelf

Elevance filed an automatic shelf registration on October 28 covering senior and subordinated debt, preferred and common stock, depositary shares, warrants, rights, contracts, and units. The filing provides financing flexibility but does not identify a specific offering. Source: ADVFN


Market Sentiment and Analyst Recommendations

Bull Case
Elevance generated $201.83 billion in revenue and holds $37.85 billion in cash against $30.76 billion in debt. The stock trades at 17.69 times earnings, while 21 analysts rate it a buy. Their consensus target is $482.38, with the high estimate reaching $523. Wells Fargo raised its target from $473 to $492 on October 27 and maintained an Overweight rating. Goldman Sachs also lifted its target from $395 to $451, citing stronger third-quarter underwriting across Medicare Advantage, Medicaid, and ACA operations, plus Carelon expansion and efficiency gains. The bull case is straightforward: solid financial scale, more cash than debt, positive 20-day momentum, and analyst targets above the current $416.53 price.
Bear Case
Revenue growth is only 1.4%, which is weak for investors paying 17.69 times earnings. ELV is already 84% of the way through its 52-week trading range, so buyers are entering much closer to the high than the low. Five-day momentum is negative 5.22%, showing that the recent rally has lost force. Shares fell 4.1% from $439.95 on October 23 to $422.02 on October 29 despite bullish analyst calls. Tennessee’s roughly 5% Medicaid repricing sounds positive, but Evercore ISI expects the 2027 adjusted EPS impact to be negligible despite Elevance managing 395,000 members in the state. Goldman’s Neutral rating and $451 target reinforce the main risk: operating improvement may already be reflected in the valuation.
What to Watch
The first technical test is whether ELV can hold near its $420.51 20-day moving average after losing 5.22% over five trading days. A break above $445.28 would clear the 30-day resistance level and put the $450.69 52-week high back in focus. A decline toward $381.67 would test the 30-day support level and weaken the current 10.57% 20-day momentum signal. Investors should track whether revenue growth improves from 1.4% and whether stronger underwriting across Medicare Advantage, Medicaid, and ACA operations continues. Tennessee’s Medicaid rates take effect January 1, 2027, but the key question is whether the expected negligible adjusted EPS contribution improves. Elevance’s October 28 shelf registration also deserves attention because it permits multiple forms of financing, although no specific offering has been identified.
Analyst Consensus
BUY

Based on 21 analyst opinions
Low Target
$406.00
Mean Target
$482.38
High Target
$523.00


Earnings and Financial Data

Sector
Healthcare
Industry
Healthcare Plans
Employees
96,129
Earnings & Dividends
Next Earnings
Oct 21, 2026
EPS (Trailing)
$23.55
Dividend Yield
163.0%
Payout Ratio
29.2%

Frequently Asked Questions

Is ELV a good stock to buy?
ELV has a buy recommendation from 21 analysts and a consensus target of $482.38 versus a current price of $416.53. The clear takeaway is that analysts are bullish, but the stock already sits 84% of the way from its 52-week low to its high.
What is ELV’s price target?
The consensus analyst target is $482.38, with estimates ranging from $406 to $523. The takeaway is that Wall Street’s central target is above the current $416.53 price.
Is ELV overvalued?
ELV trades at a P/E ratio of 17.69 while revenue growth is 1.4%. The takeaway is that the valuation is not backed by rapid revenue growth.
What are ELV’s support and resistance levels?
Near-term support is the 30-day low of $381.67, while near-term resistance is the 30-day high of $445.28. The takeaway is that those are the key levels defining the current trading range.
Does ELV pay a dividend?
The provided data does not include dividend information. The takeaway is that investors should verify the current dividend policy separately before making an income-based decision.

Related Stock Reports

Disclaimer: This report is for informational purposes only and does not constitute financial advice. The analysis and opinions expressed are those of AltStation.io and should not be relied upon as the sole basis for investment decisions. Always conduct your own research and consult with a qualified financial advisor before making investment decisions. Past performance does not guarantee future results. Updated October 30, 2026.