ALTSTATION.IO

UnitedHealth Group Incorporated (UNH) Stock Analysis

By Nova Skye | AltStation.io | Updated October 15, 2026

Price
$410.42
Change
+3.74%
Market Cap
$368.39B
Avg Volume
5.2M

Company Overview

UnitedHealth Group is the largest player in the healthcare plans industry, headquartered in Eden Prairie, Minnesota, and founded in 1974. The company runs four key business units: UnitedHealthcare for medical insurance, Optum Health for clinical care delivery, Optum Rx for pharmacy services, and Optum Insight for healthcare software and analytics. Its customer base spans individual consumers, employers of all sizes, state and federal programs like Medicaid and Medicare, and hospital systems. It makes money by collecting health plan premiums, managing pharmacy benefits, and selling technology and healthcare services directly to providers and payers.

UnitedHealth is the undisputed market leader in U.S. managed care, controlling roughly 16% of the commercial health insurance market. Its real competitive edge is vertical integration: Optum feeds patient care, pharmacy management, and data directly into UnitedHealthcare, capturing revenue at every link of the healthcare chain. While peers like Elevance Health, CVS Health, and The Cigna Group fight for membership, UnitedHealth’s massive scale gives it pricing leverage competitors cannot match. The primary risk to its business model comes from regulatory scrutiny over pharmacy benefit managers and rising medical care utilization across government-backed plans.

The business continues to expand at a steady pace, generating $447.6 billion in revenue in 2025, which represents 12% year-over-year growth. Optum remains the primary growth engine, expanding care delivery and specialty pharmacy services alongside the core insurance division. Instead of pivoting away from managed care, UnitedHealth is doubling down on its integrated ecosystem to capture value across every patient touchpoint. For investors, this is a dominant defensive compounder with unmatched cash flow, not a turnaround story.

Key Financials
Market Cap
$368.39B
Revenue
$450.06B
EBITDA
$28.90B
Gross Margin
20.0%
Profit Margin
3.5%
Revenue Growth
-0.4%
Total Cash
$28.55B
Total Debt
$74.33B
Free Cash Flow
$26.50B


52-Week Price Performance Analysis

Price Statistics
P/E Ratio
25.19
Forward P/E
17.74
Beta
0.61
52-Week High
$461.62
52-Week Low
$255.97
EPS
$16.29
50-Day Avg
$387.47
200-Day Avg
$358.36
Price/Book
3.56
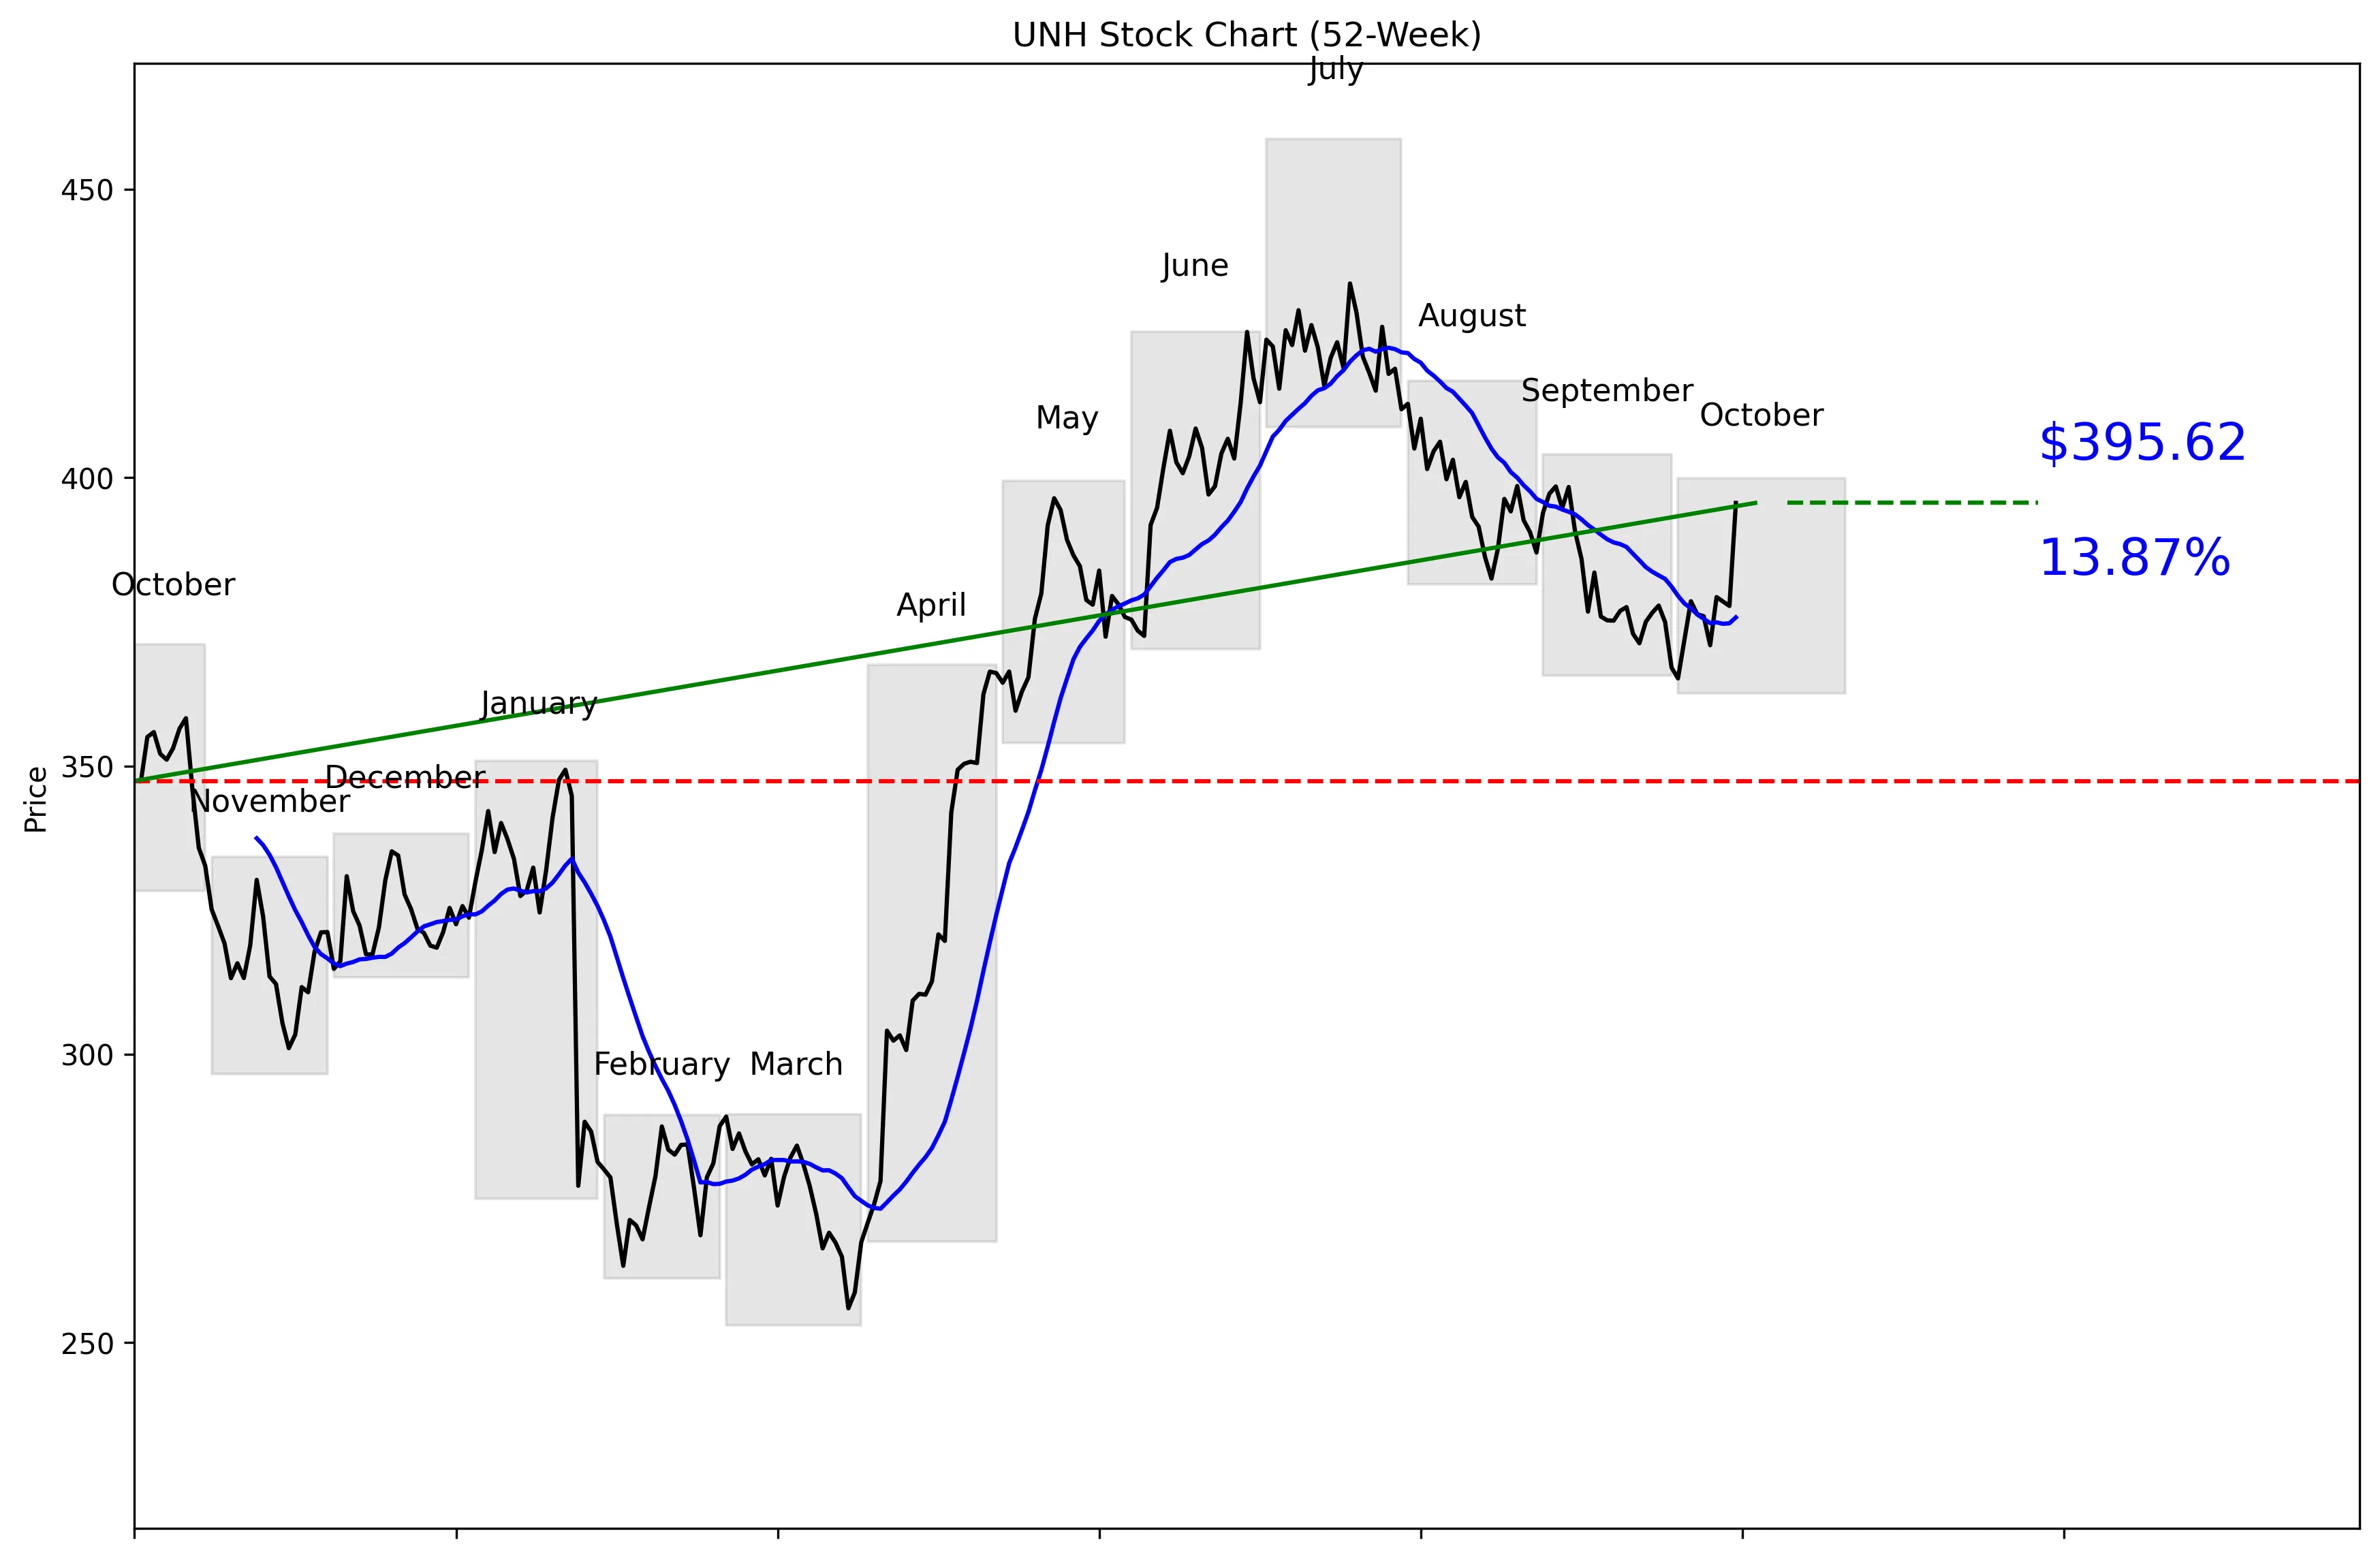
UNH 52-Week Stock Chart
Technical Analysis
UNH trades at $410.42, 13.77% below its 52-week high of $458.79 and 56.40% above its 52-week low of $252.96. The stock sits 69% of the way from that low to that high, placing it firmly in the upper half of its annual range. Five-day momentum is 5.22%, while 20-day momentum is 5.43%. The price is 5.28% above the stated 20-day moving average of $375.77, confirming positive short-term momentum. Near-term support is $365.20, while the listed near-term resistance level is $398.49.


Recent News and Developments

UnitedHealth raises 2026 outlook after $112.7 billion quarter

UnitedHealth reported third-quarter revenue of $112.7 billion, operating earnings of $6.6 billion and adjusted earnings of $4.69 per share. Management raised its full-year adjusted earnings outlook to at least $20.50 per share. Source: UnitedHealth Group

Wall Street splits on UnitedHealth after earnings

Piper Sandler kept its Overweight rating and raised its price target from $502 to $504 on October 14. Barclays maintained Overweight but trimmed its target from $441 to $440, while Baird maintained Neutral and cut its target from $453 to $427. Source: Benzinga

TD Cowen cuts UnitedHealth target by 6.5%

TD Cowen analyst Ryan Langston maintained a Hold rating on October 9 and lowered the price target from $430 to $402. That was a 6.51% reduction ahead of UnitedHealth’s third-quarter report. Source: GuruFocus


Market Sentiment and Analyst Recommendations

Bull Case
UnitedHealth produced $112.7 billion in third-quarter revenue, $6.6 billion in operating earnings and adjusted earnings of $4.69 per share. Management also raised its 2026 adjusted earnings outlook to at least $20.50 per share. That earnings performance gives buyers a clear catalyst beyond the stock’s recent 5.43% 20-day gain. The consensus recommendation is buy across 25 analysts, with an average target of $476.72. That target sits $66.30 above the current $410.42 price. Piper Sandler reinforced the bullish view on October 14 by maintaining Overweight and raising its target from $502 to $504. The bull case is straightforward: strong quarterly earnings, a higher company outlook and analyst targets that remain above the current price.
Bear Case
Revenue growth is negative at -0.4%, so the company is not currently delivering top-line expansion despite reporting $450.06 billion in revenue. The stock trades at 25.19 times earnings, which leaves less room for execution problems. Total debt of $74.33 billion exceeds total cash of $28.55 billion by $45.78 billion. Analyst conviction is also uneven: the target range runs from $380 to $529. Barclays trimmed its target from $441 to $440, Baird cut from $453 to $427 and TD Cowen lowered its target from $430 to $402. TD Cowen’s $402 target is below the current $410.42 price, while the consensus low of $380 implies additional downside. The bear case is that investors are paying a 25.19 P/E for a company with -0.4% revenue growth and substantially more debt than cash.
What to Watch
The first number to track next quarter is revenue growth, which needs to improve from -0.4% to strengthen the thesis. Investors should also test reported results against management’s raised full-year adjusted earnings outlook of at least $20.50 per share. Price action around $398.49 matters because that level is listed as near-term resistance and the current price is already above it at $410.42. A retreat toward the $375.77 20-day moving average would show that recent momentum is weakening, while $365.20 is the stated near-term support. Analyst revisions are another key signal after the October cuts from Barclays, Baird and TD Cowen contrasted with Piper Sandler’s October 14 increase to $504. The average analyst target is $476.72, but the wide $380 to $529 range shows substantial disagreement about fair value. The bullish thesis improves if revenue growth turns positive and management meets or exceeds its $20.50 adjusted earnings outlook; it weakens if the price loses $365.20 or earnings fall short of that outlook.
Analyst Consensus
BUY

Based on 25 analyst opinions
Low Target
$380.00
Mean Target
$476.72
High Target
$529.00


Earnings and Financial Data

Sector
Healthcare
Industry
Healthcare Plans
Employees
390,000
Earnings & Dividends
Next Earnings
Oct 13, 2026
EPS (Trailing)
$16.29
Dividend Yield
246.0%
Payout Ratio
57.6%

Frequently Asked Questions

Is UNH a good stock to buy?
The consensus recommendation is buy based on 25 analysts, and the average target is $476.72 versus a current price of $410.42. The takeaway is that analysts are bullish, but the 25.19 P/E and -0.4% revenue growth still demand careful scrutiny.
What is UNH’s price target?
The average analyst target is $476.72, with estimates ranging from $380 to $529. The takeaway is that the consensus sees upside, but the wide range signals meaningful uncertainty.
What is UNH’s 52-week high and low?
The technical price series shows a 52-week high of $458.79 and a low of $252.96. The takeaway is that the $410.42 price sits 69% of the way from the low to the high.
What are UNH’s support and resistance levels?
The stated near-term support is $365.20, and near-term resistance is $398.49. The takeaway is that the current $410.42 price is above the listed resistance level.
Does UNH pay a dividend?
The provided key and technical data do not include dividend information. The takeaway is that no conclusion about UNH’s dividend can be made from this dataset.

Related Stock Reports

Disclaimer: This report is for informational purposes only and does not constitute financial advice. The analysis and opinions expressed are those of AltStation.io and should not be relied upon as the sole basis for investment decisions. Always conduct your own research and consult with a qualified financial advisor before making investment decisions. Past performance does not guarantee future results. Updated October 15, 2026.