
The Cigna Group (CI) Stock Analysis
By Nova Skye | AltStation.io | Updated September 28, 2026
Company Overview
The Cigna Group operates in the healthcare sector, selling medical coverage and pharmacy services from its headquarters in Bloomfield, Connecticut. The company runs two main engines: Evernorth Health Services and Cigna Healthcare. Evernorth manages pharmacy benefits, specialty drug distribution, and home delivery, while Cigna Healthcare provides medical, dental, behavioral health, and stop-loss plans. Their customers include individual policyholders, labor unions, and large employers accessing plans directly or through brokers and public or private exchanges.
Cigna operates as an established market heavyweight whose primary edge is the integration of commercial health coverage with Evernorth’s pharmacy benefit scale. Administering retail pharmacy networks and specialty drug claims gives them direct leverage over pharmacy supply chains that standard insurers lack. The main operational risk stems from their reliance on employer-sponsored commercial accounts, which face continuous margin pressure from corporate cost-cutting and rising medical utilization.
Founded in 1792, the company rebranded from Cigna Corporation to The Cigna Group in February 2023 to reflect its dual identity across health coverage and pharmacy services. Strategic momentum now leans heavily on expanding Evernorth’s specialty pharmacy, drug formulary management, and care services alongside its core commercial health plans. By treating pharmacy benefit management and coordinated health solutions as connected revenue drivers, Cigna maintains steady footing across the healthcare plans industry.
52-Week Price Performance Analysis
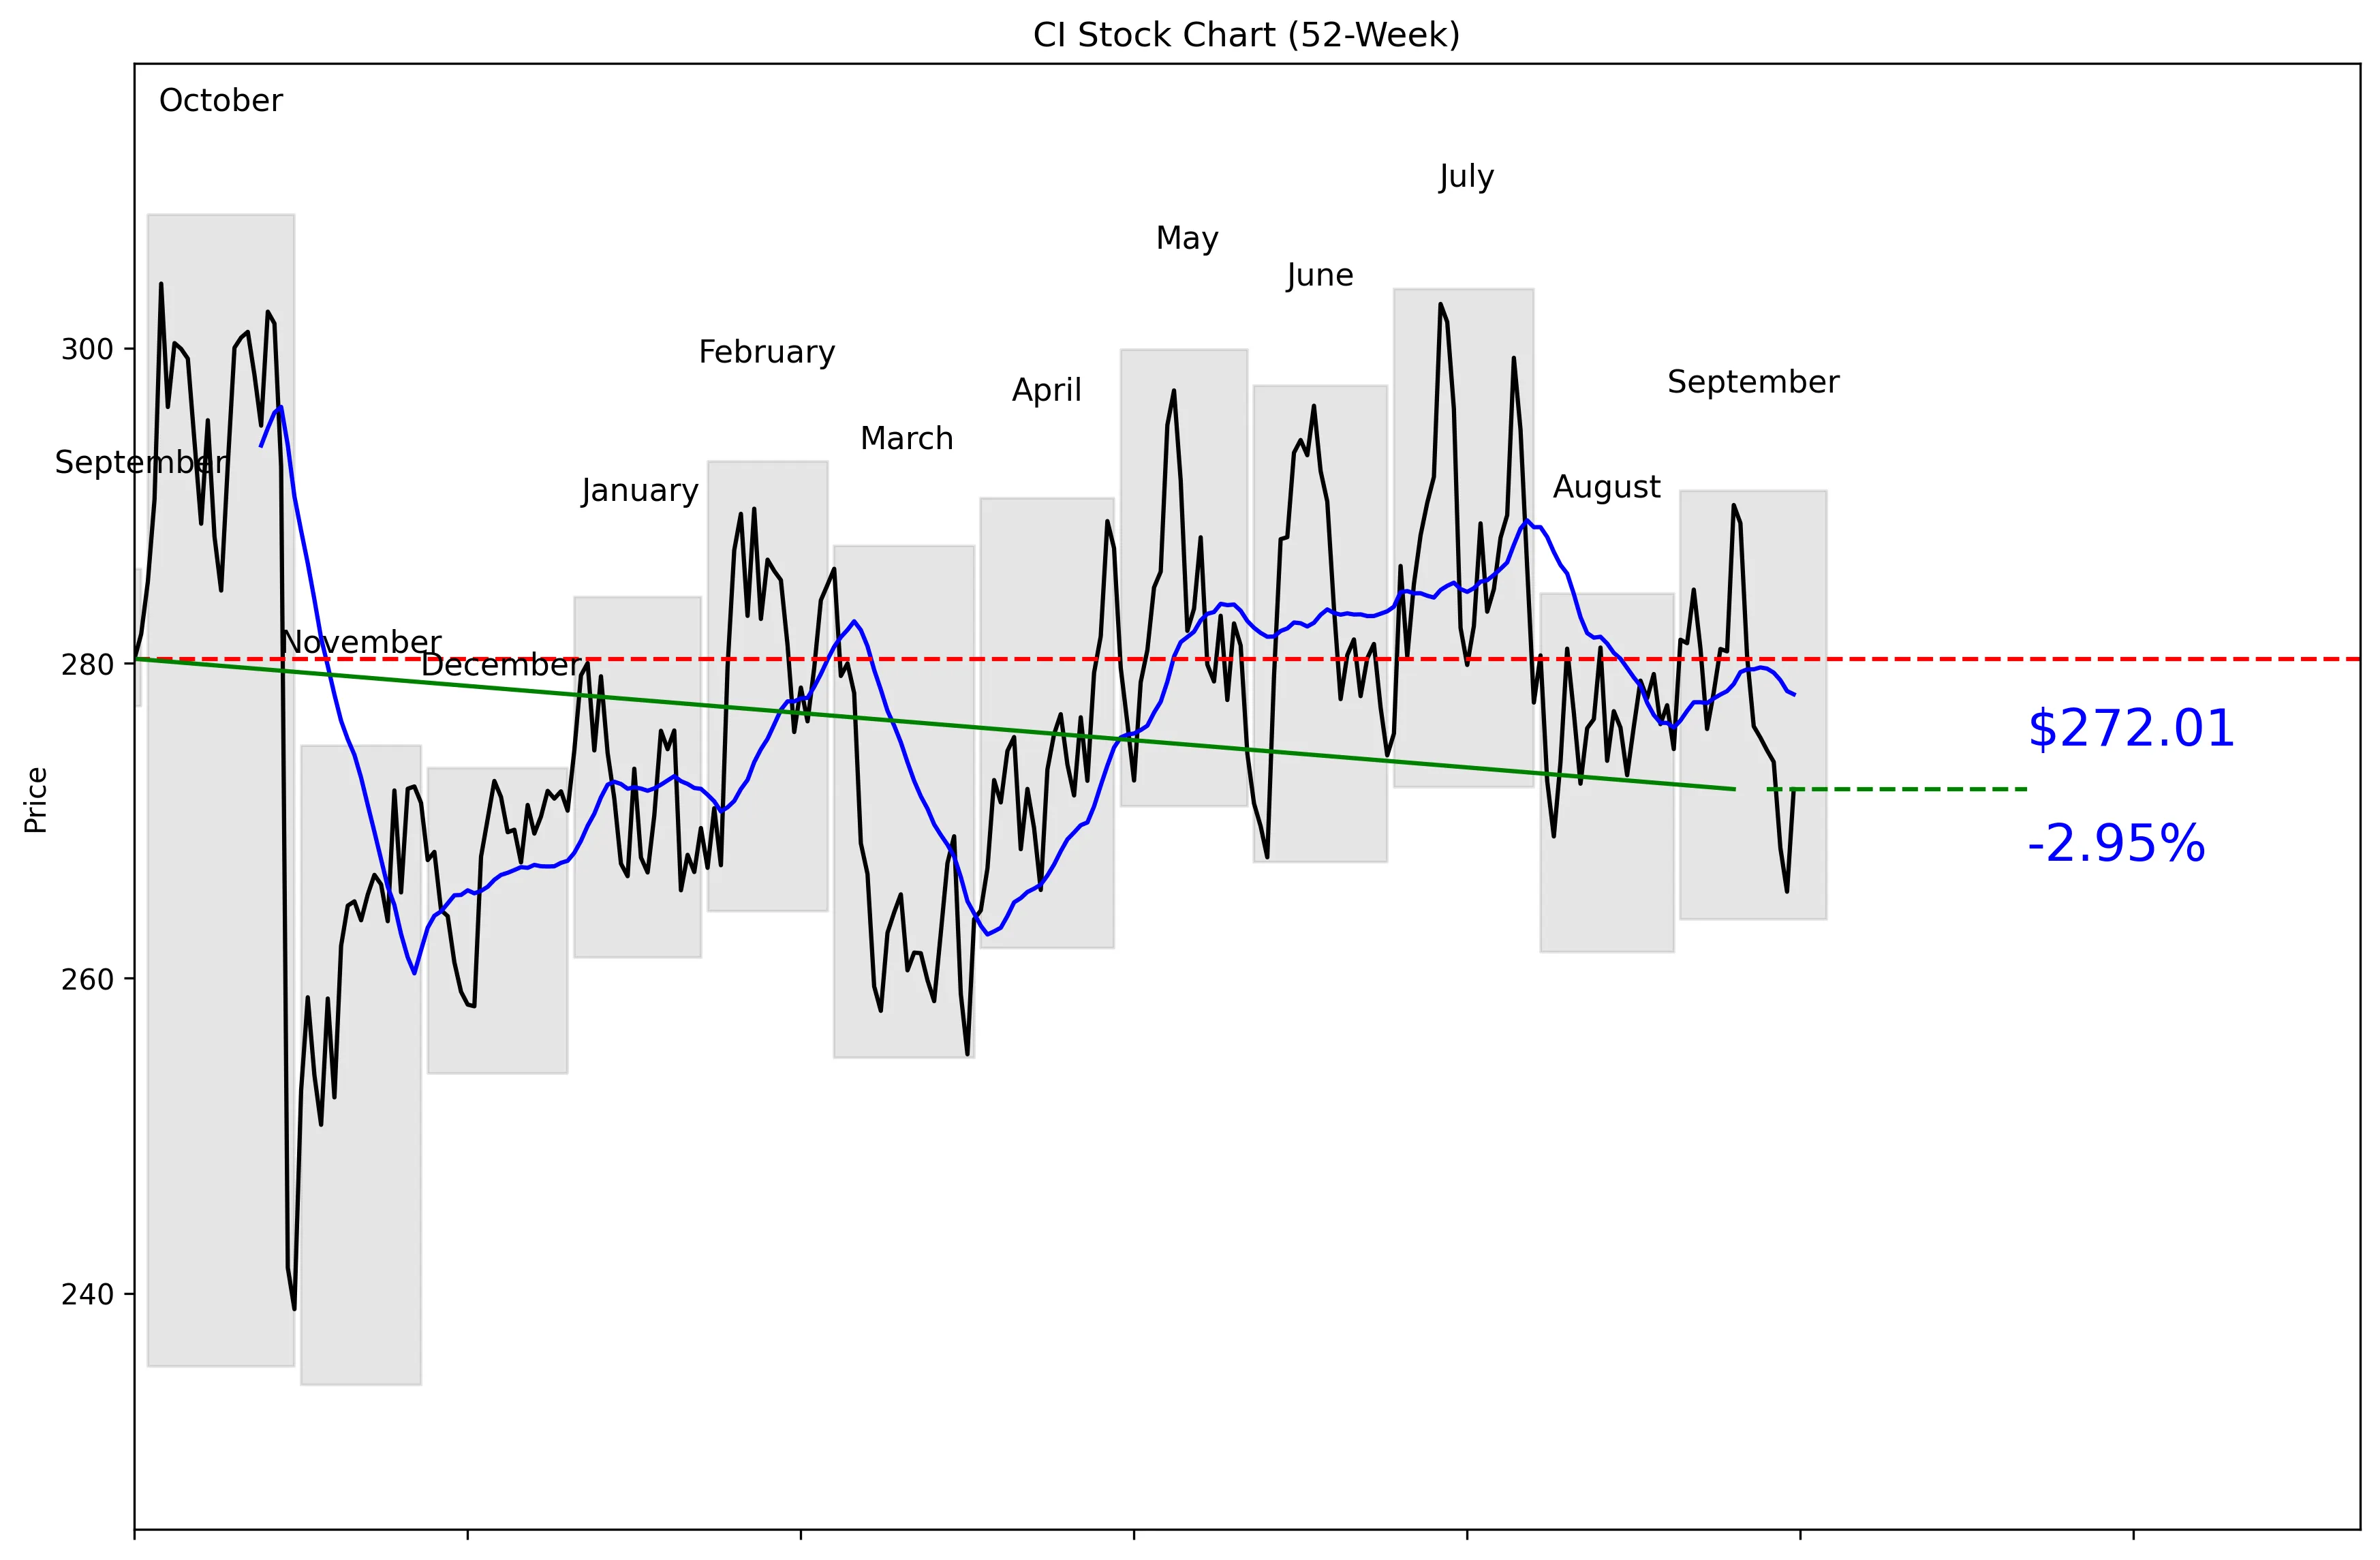
The stock is 11.82% below that high and 16.14% above the low.
Price is 2.17% below its $278.03 20-day moving average, while five-day and 20-day momentum are negative at 1.19% and 1.49%, respectively.
Near-term support is $265.50, with resistance at $290.05.
The chart is neutral over 52 weeks but weak in the near term.
Recent News and Developments
Cigna Healthcare joined the initial group of health plans participating in CertifyOS’s National Shared Credentialing Program. The centralized service is scheduled to launch in fall 2026 and aims to reduce duplicate provider checks and administrative work. Source: Cigna Provider Newsroom
Cigna outlined free interpreter services and Spanish or Traditional Chinese translations available to eligible California members with limited English proficiency. In-network providers must offer telephone interpretation and document any refusal to use a trained interpreter. Source: Cigna Provider Newsroom
Cigna said eligible New Mexico members can receive free telephone, in-person, video, and American Sign Language interpretation. Providers should allow at least three business days to arrange in-person Spanish interpretation and five business days for other languages or ASL. Source: Cigna Provider Newsroom
Market Sentiment and Analyst Recommendations
The stock trades at 11.15 times earnings, a modest valuation for a company with that revenue base.
The $341.83 analyst target implies 26.75% upside from $269.68.
Even the low analyst target of $290.00 sits above the current price, while the high target reaches $400.00.
The recommendation is buy across 24 analysts.
Cigna’s participation in the National Shared Credentialing Program could reduce duplicate provider checks and administrative work when the service launches in fall 2026.
The bull case is straightforward: positive growth, a low earnings multiple, and analyst targets above the current price.
That balance-sheet gap limits flexibility if growth slows or operating demands increase.
Revenue growth of 6.7% is positive, but the stock’s current momentum is not: it is down 1.19% over five trading days and 1.49% over 20 trading days.
CI also trades 2.17% below its $278.03 20-day moving average, confirming near-term weakness.
The price is only $4.18 above the $265.50 near-term support level.
A break below that support would weaken the chart, while $290.05 remains a clear barrier overhead.
The supplied data does not identify specific competitive threats or macro headwinds, so the measurable risks here are leverage, slowing price momentum, and failure to convert revenue growth into stronger investor demand.
A sustained move above the $278.03 20-day moving average would be an early sign that momentum is improving.
The larger technical test is $290.05, the 30-day high and near-term resistance level.
Investors should monitor whether revenue growth holds at or above 6.7%.
Debt of $31.88 billion and cash of $7.26 billion should also be tracked for evidence that the balance sheet is strengthening or weakening.
The planned fall 2026 launch of the National Shared Credentialing Program is worth watching for signs that reduced administrative duplication produces measurable benefits.
The thesis improves above $290.05 with maintained growth; it weakens below $265.50 or if revenue growth falls from 6.7%.
Earnings and Financial Data
Frequently Asked Questions
Related Stock Reports