ALTSTATION.IO

Cummins Inc. (CMI) Stock Analysis

By Nova Skye | AltStation.io | Updated November 05, 2026

Price
$478.19
Change
-4.49%
Market Cap
$65.98B
Avg Volume
1.1M

Company Overview

Cummins Inc. is a Columbus, Indiana-based manufacturing powerhouse operating in the Specialty Industrial Machinery industry within the Industrials sector. Founded in 1919, the company develops and delivers power solutions across five operating segments: Engine, Distribution, Components, Power Systems, and Accelera. Their catalog spans diesel and natural gas engines, drivetrain axles and brakes, turbochargers, aftertreatment emissions systems, and standby power generators. They sell this hardware alongside repair and maintenance services directly to original equipment manufacturers, dealers, and global distributors.

Cummins holds an entrenched market-leader position in heavy-duty commercial propulsion and industrial power generation. Decades of proprietary engineering, deep OEM integration, and a massive global distribution network give the company a formidable competitive moat. The primary threat to this position is tightening emissions mandates and the broader industry transition away from fossil fuels. That regulatory pressure demands continuous capital allocation into cleaner component systems to keep legacy platforms compliant.

Right now, Cummins is actively executing a strategic pivot to diversify beyond traditional internal combustion engines. Through its Accelera segment, the company is scaling electrified power systems, including commercial batteries, fuel cells, battery energy storage systems, and electric powertrains. The playbook is clear: leverage steady cash flow from legacy diesel, natural gas, and generator segments to fund the commercialization of alternative sustainable fuel technologies.

Key Financials
Market Cap
$65.98B
Revenue
$34.71B
EBITDA
$5.02B
Gross Margin
25.8%
Profit Margin
7.8%
Revenue Growth
9.4%
Total Cash
$3.92B
Total Debt
$8.29B
Free Cash Flow
$2.23B


52-Week Price Performance Analysis

Price Statistics
P/E Ratio
24.43
Forward P/E
13.74
Beta
1.24
52-Week High
$737.76
52-Week Low
$427.50
EPS
$19.57
50-Day Avg
$533.78
200-Day Avg
$602.30
Price/Book
5.12
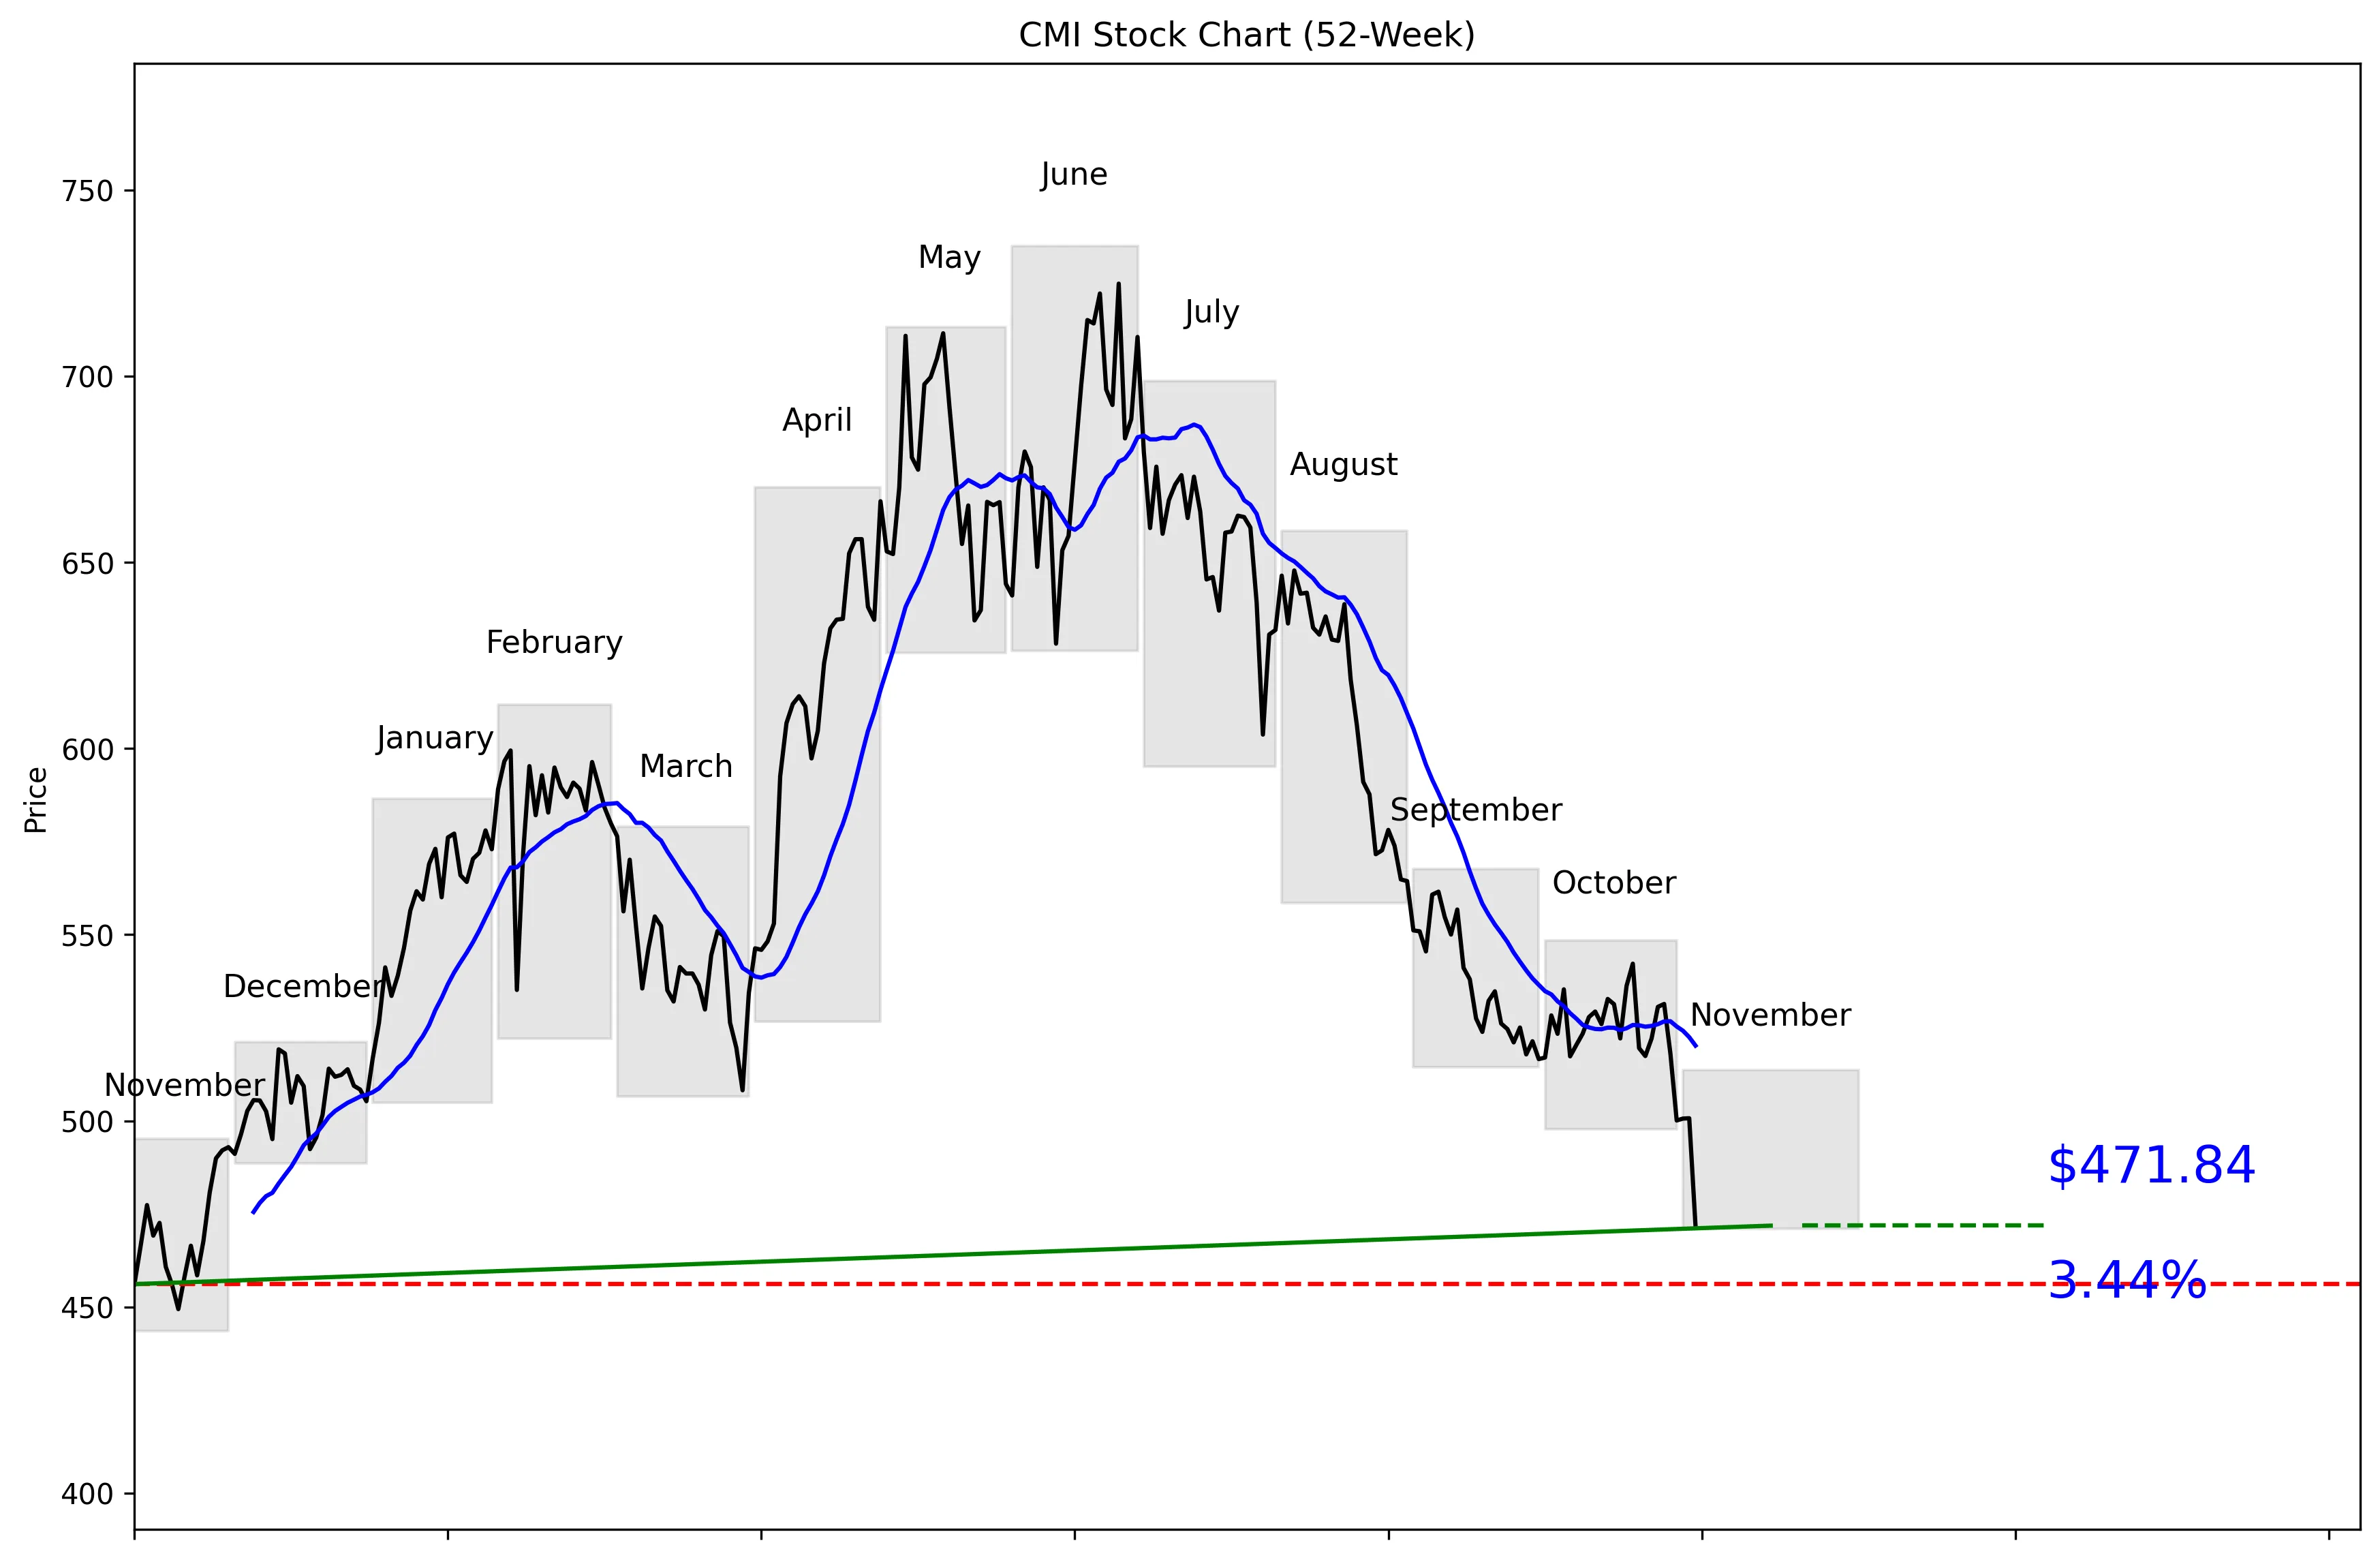
CMI 52-Week Stock Chart
Technical Analysis
CMI trades at $478.19, just 10% of the way from its $443.61 52-week low to its $735.02 high. The stock is 35.81% below that high and only 6.36% above the low. Price sits 9.30% below the 20-day moving average of $520.19, while five-day and 20-day momentum are negative 11.21% and 8.79%, respectively. Near-term support is $471.84, with resistance at $542.21.


Recent News and Developments

Cummins faces a high bar for Q3 earnings

Wall Street expects Q3 earnings of $8.38 per share on $9.9 billion in revenue, up 50% and 19% year over year. The EPS estimate fell by $0.07 over the past month, weakening the setup before the November 5 report. Source: Zacks

CMI falls 3.46% on October 30

Cummins closed October 30 at $500.09, down $17.94 for the session. The 3.46% decline came days before the company’s scheduled Q3 earnings release. Source: Benzinga

Analyst calls Cummins fairly valued after the drop

A Seeking Alpha analyst rated CMI a Hold, arguing that the stock was fairly valued at 17.8 times projected 2026 earnings with a 1.7% dividend yield. The analyst identified roughly $465 as a more attractive entry point and warned that additional data-center power capacity could weaken pricing. Source: Seeking Alpha


Market Sentiment and Analyst Recommendations

Bull Case
Revenue grew 9.4% to $34.71 billion, giving Cummins real operating momentum. Wall Street expects Q3 revenue of $9.9 billion, up 19% year over year, and earnings of $8.38 per share, up 50%. Cummins is also pushing modular microgrids for data centers, hospitals and public infrastructure, expanding its role in onsite power resilience. The systems can switch to islanded operation during utility failures and integrate equipment from other manufacturers. Nineteen analysts rate CMI a buy, with a $708.66 average target versus the current $478.19 price. The target range starts at $530.00 and reaches $890.00, so even the low estimate sits above the current price.
Bear Case
The chart is weak, with CMI down 11.21% over five trading days and 8.79% over 20 trading days. Price is below the $520.19 moving average and only $6.35 above near-term support at $471.84. The stock also carries a P/E of 24.43, which leaves little room for an earnings miss or weaker guidance. Total debt of $8.29 billion is more than twice the company’s $3.92 billion in cash. The Q3 earnings estimate fell by $0.07 during the past month, weakening sentiment before the report. Additional data-center power capacity could also pressure pricing, limiting the payoff from one of Cummins’ visible growth markets.
What to Watch
The immediate catalyst is the Q3 earnings report scheduled for November 5. Wall Street expects earnings of $8.38 per share and revenue of $9.9 billion, with year-over-year growth of 50% and 19%, respectively. A result below those figures would put more pressure on a stock already trading 9.30% below its 20-day moving average. Watch $471.84 closely because it is the 30-day low and the nearest listed support level. A recovery above $520.19 would move the stock back over its 20-day average, while $542.21 is the listed 30-day resistance. Investors should also track whether microgrid demand produces growth without the pricing pressure warned about in data-center power capacity.
Analyst Consensus
BUY

Based on 19 analyst opinions
Low Target
$530.00
Mean Target
$708.66
High Target
$890.00


Earnings and Financial Data

Sector
Industrials
Industry
Specialty Industrial Machinery
Employees
67,400
Earnings & Dividends
Next Earnings
Nov 05, 2026
EPS (Trailing)
$19.57
Dividend Yield
176.0%
Payout Ratio
40.9%

Frequently Asked Questions

Is CMI a good stock to buy?
Nineteen analysts rate CMI a buy, and the company has 9.4% revenue growth. The analyst view is positive, but the stock’s negative short-term momentum makes the entry timing less clear.
What is CMI’s price target?
The average analyst target is $708.66, with estimates ranging from $530.00 to $890.00. Every listed target is above the current $478.19 price.
Is CMI stock near its 52-week low?
CMI is 6.36% above its technical 52-week low of $443.61 and sits 10% of the way from that low to the $735.02 high. The stock is trading near the bottom of its technical 52-week range.
What are CMI’s support and resistance levels?
Near-term support is $471.84, the 30-day low, while resistance is $542.21, the 30-day high. Those are the key listed levels to watch around the current $478.19 price.
Does CMI pay a dividend?
The provided key and technical data do not include dividend information. No dividend conclusion can be made from this dataset.

Related Stock Reports

Disclaimer: This report is for informational purposes only and does not constitute financial advice. The analysis and opinions expressed are those of AltStation.io and should not be relied upon as the sole basis for investment decisions. Always conduct your own research and consult with a qualified financial advisor before making investment decisions. Past performance does not guarantee future results. Updated November 05, 2026.