ALTSTATION.IO

Dover Corporation (DOV) Stock Analysis

By Nova Skye | AltStation.io | Updated October 14, 2026

Price
$191.69
Change
+0.42%
Market Cap
$25.82B
Avg Volume
1.2M

Company Overview

Headquartered in Downers Grove, Illinois, Dover Corporation operates in the Industrials sector under the Specialty Industrial Machinery umbrella. The company generated $7.75 billion in 2024 revenue across five core segments: Engineered Products, Clean Energy & Fueling, Imaging & Identification, Pumps & Process Solutions, and Climate & Sustainability Technologies. They sell specialized hardware, digital tools, and recurring consumables, ranging from commercial refrigeration doors and vehicle lifts to cryogenic fuel systems and digital textile printers. Their buyer base spans grocery chains, auto repair shops, aerospace contractors, and pharmaceutical manufacturers across global industrial markets.

Dover is a well-entrenched industrial leader that wins by dominating specialized, mission-critical niches rather than slugging it out in mass-market commodity hardware. Their pricing power comes from aftermarket support and proprietary components that clients cannot easily swap out, shielding them from low-cost competitors. However, they face fierce pressure in fluid handling and precision dispensing from focused rivals like IDEX Corporation, Ingersoll Rand, and Nordson. Any prolonged downturn in commercial refrigeration demand or global vehicle maintenance cycles directly hits their top line.

Dover is holding steady with slight top-line expansion, moving from $7.68 billion in 2023 revenue to $7.75 billion in 2024, a modest 0.9% increase. That slow revenue growth means Dover is operating in harvest mode, driving cash flow through operational discipline rather than aggressive organic expansion. To sustain momentum, management is actively pivoting toward higher-margin secular themes, specifically cryogenic storage for clean fuels, biopharma fluid processing, and energy-efficient climate control systems. Until industrial capital spending accelerates, expect Dover to rely on targeted bolt-on acquisitions and buybacks to generate shareholder returns.

Key Financials
Market Cap
$25.82B
Revenue
$8.42B
EBITDA
$1.91B
Gross Margin
40.1%
Profit Margin
13.5%
Revenue Growth
6.9%
Total Cash
$1.76B
Total Debt
$3.26B
Free Cash Flow
$906.47M


52-Week Price Performance Analysis

Price Statistics
P/E Ratio
23.18
Forward P/E
16.48
Beta
1.13
52-Week High
$237.54
52-Week Low
$158.97
EPS
$8.27
50-Day Avg
$196.06
200-Day Avg
$209.82
Price/Book
3.35
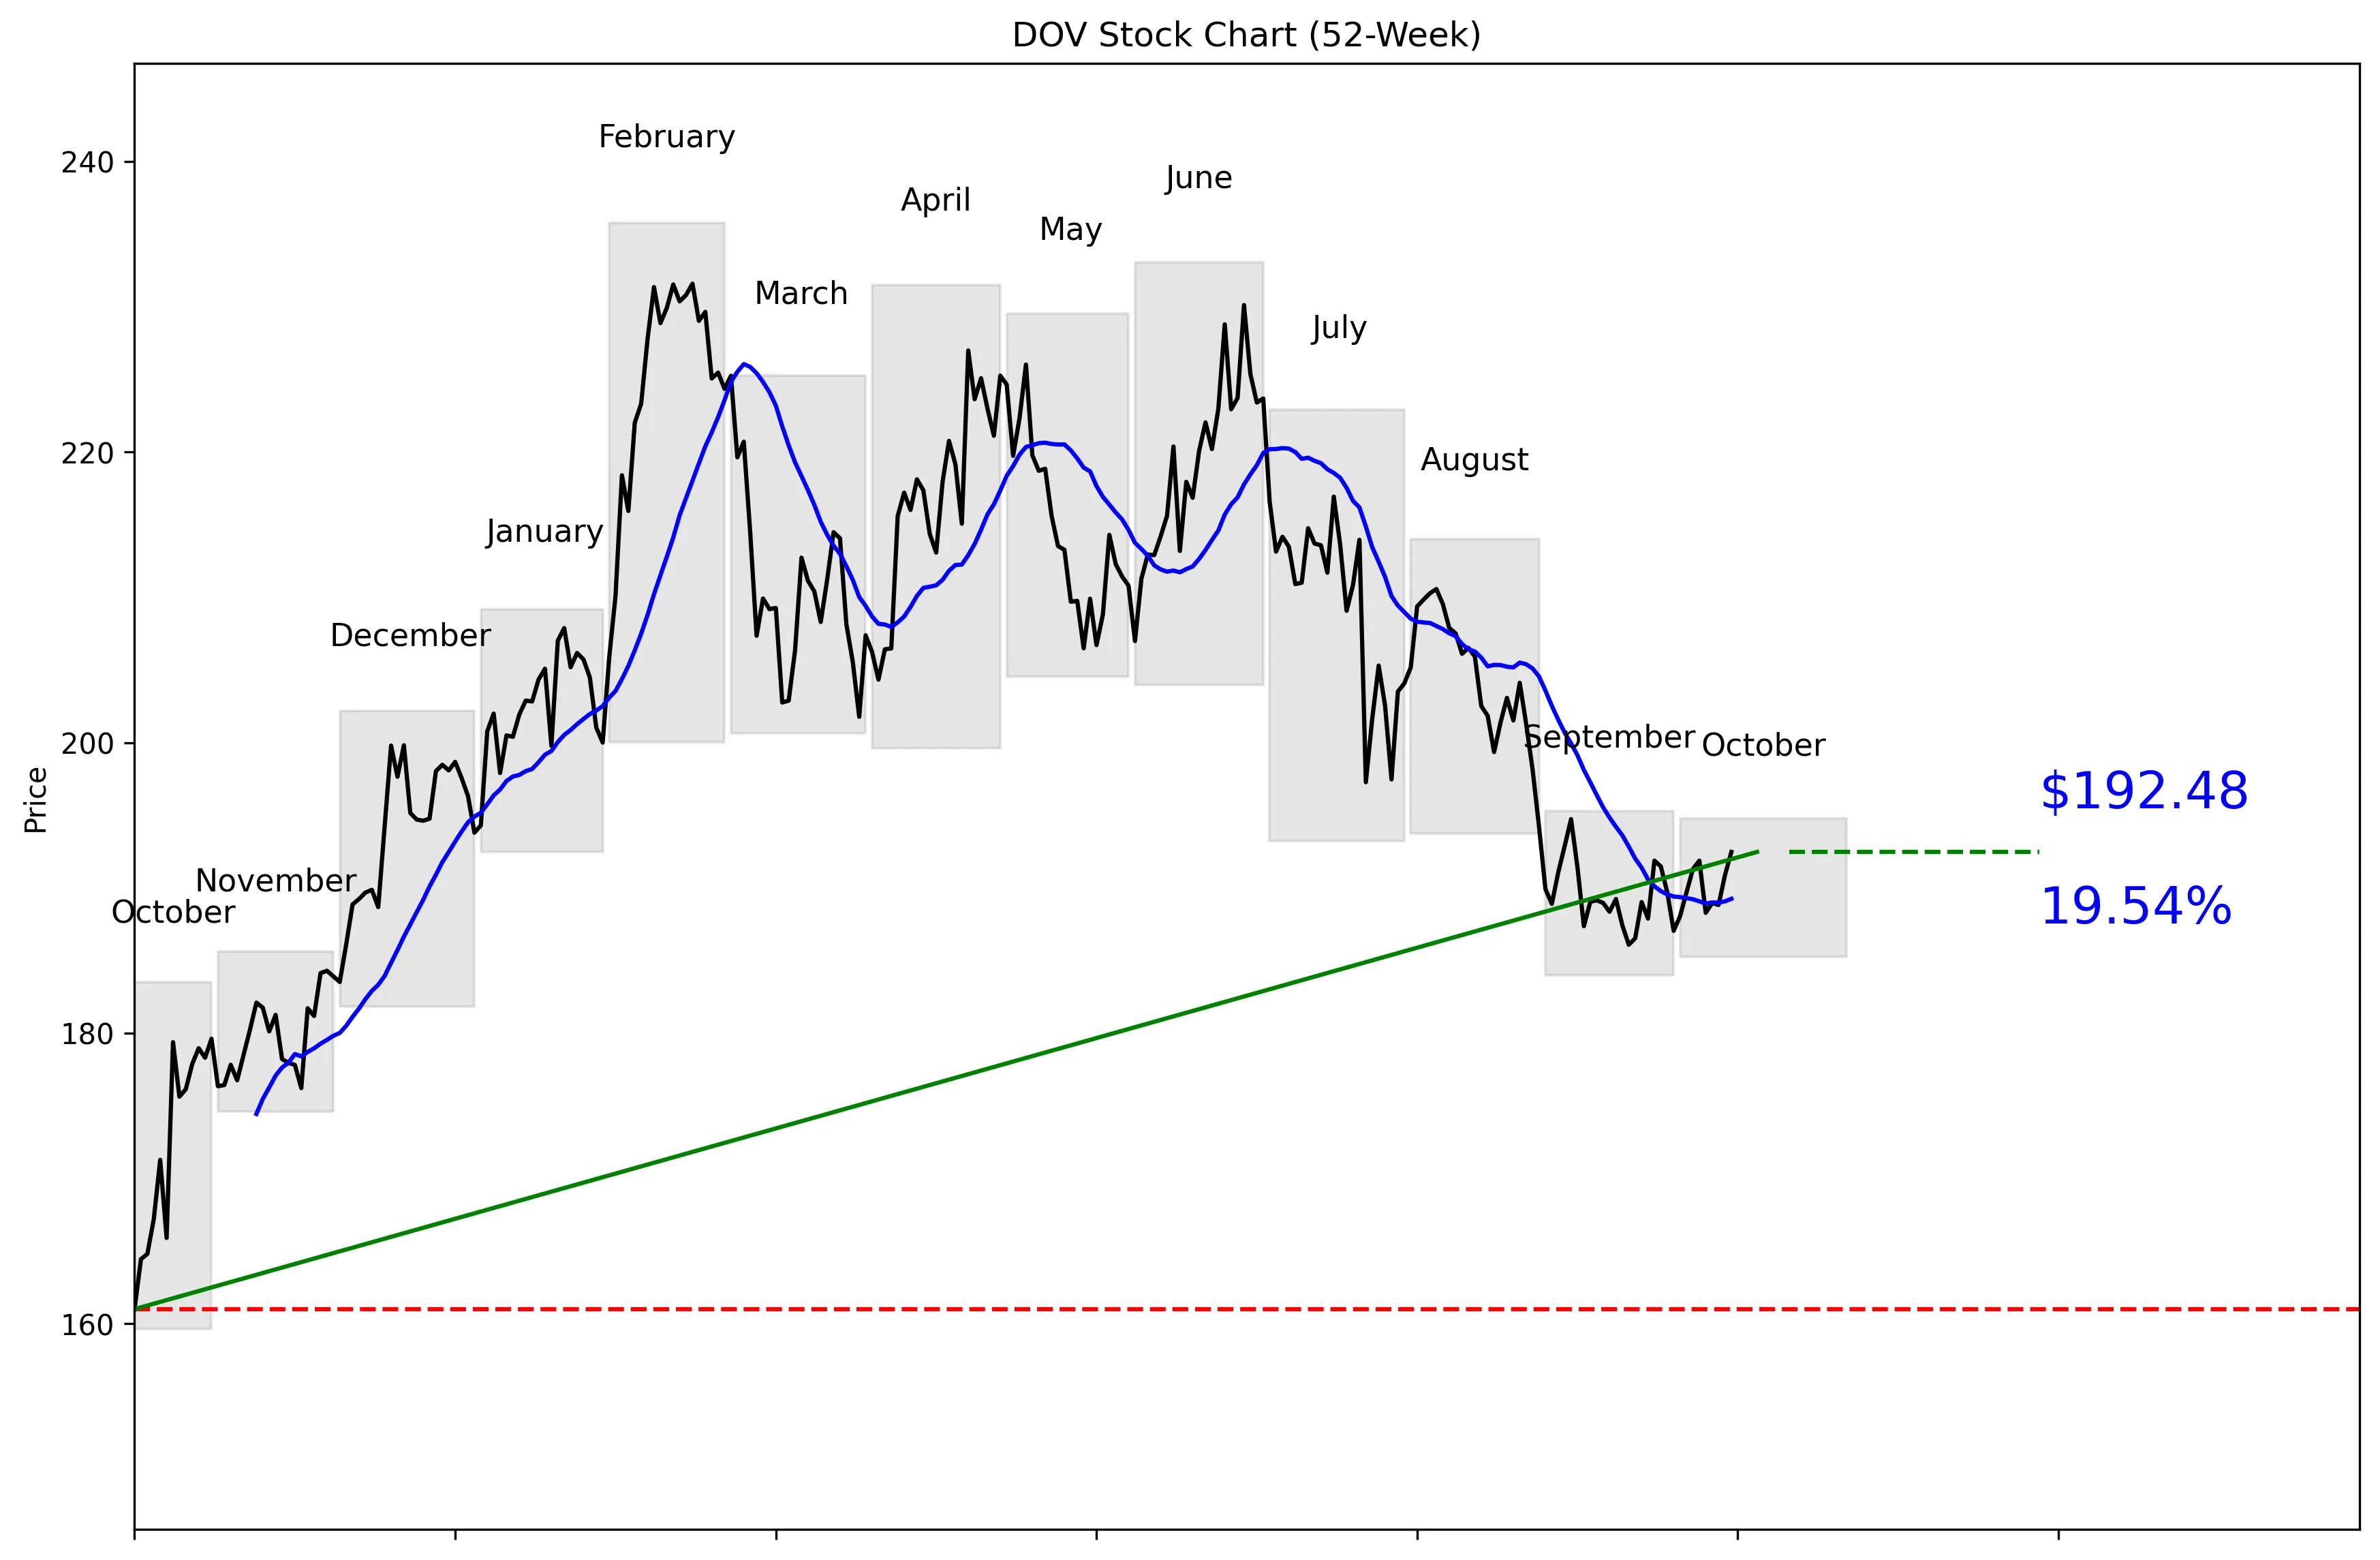
DOV 52-Week Stock Chart
Technical Analysis
DOV trades at $191.69, 43% of the way from its $159.65 52-week low to its $235.79 high. The stock is 18.37% below that high and 20.57% above the low. Price is 1.71% above the 20-day moving average of $189.25, while momentum is positive at 0.31% over five trading days and 1.86% over 20 trading days. Near-term support sits at the 30-day low of $186.09. Near-term resistance is the 30-day high of $194.74.


Recent News and Developments

No notable company-specific news this week

No verified Dover earnings, analyst actions, product launches, regulatory developments, or other company-specific announcements were published during the past week. The stock moved during the period, but no confirmed company-specific catalyst was found.

Latest Developments

Check back for the latest news and updates.

Latest Developments

Check back for the latest news and updates.


Market Sentiment and Analyst Recommendations

Bull Case
Dover is producing $8.42 billion in revenue and growing that figure by 6.9%. That is credible growth for a company with a $25.82 billion market cap. The analyst consensus is buy, based on 19 analysts. Their average target is $240.11, well above the current $191.69 price. Technical momentum is also positive, with the stock gaining 1.86% over the last 20 trading days and trading above its $189.25 moving average. The buy case is straightforward: revenue is growing, analysts remain constructive, and the stock still sits 18.37% below its 52-week high.
Bear Case
DOV is not cheap at 23.18 times earnings. The company has $3.26 billion in total debt against $1.76 billion in cash, leaving debt well above available cash. Price is only $3.05 below near-term resistance at $194.74, so buyers here are entering close to the top of the recent 30-day range. Five-day momentum is just 0.31%, which shows limited short-term acceleration. Analyst targets also vary widely, from $168.00 to $288.00, showing substantial disagreement about fair value. The bear case is that investors are paying a meaningful earnings multiple while carrying balance-sheet risk and limited room before near-term resistance.
What to Watch
The first threshold is $194.74, the 30-day high and immediate resistance level. A move above that level would strengthen the positive 20-day momentum reading of 1.86%. On the downside, watch $189.25, the 20-day moving average, followed by support at $186.09. Revenue growth must hold near or above the reported 6.9% rate to support a P/E of 23.18. Investors should also monitor whether total debt declines from $3.26 billion or cash falls from $1.76 billion. No verified company-specific announcement was reported during the past week, so the next quarter’s thesis should be judged through price behavior, revenue growth, valuation, and balance-sheet changes rather than an unconfirmed catalyst.
Analyst Consensus
BUY

Based on 19 analyst opinions
Low Target
$168.00
Mean Target
$240.11
High Target
$288.00


Earnings and Financial Data

Sector
Industrials
Industry
Specialty Industrial Machinery
Employees
24,000
Earnings & Dividends
Next Earnings
Oct 22, 2026
EPS (Trailing)
$8.27
Dividend Yield
110.0%
Payout Ratio
25.1%

Frequently Asked Questions

Is DOV a good stock to buy?
The recommendation is buy based on 19 analysts, and revenue is growing 6.9%. The takeaway is that the available data supports a bullish view, although the 23.18 P/E and $3.26 billion debt deserve attention.
What is DOV’s price target?
The average analyst target is $240.11, with estimates ranging from $168.00 to $288.00. The takeaway is that analysts see upside on average but disagree sharply on valuation.
What is DOV’s 52-week high and low?
The technical price series shows a 52-week high of $235.79 and a low of $159.65. At $191.69, DOV sits 43% of the way from that low to the high.
What are DOV’s support and resistance levels?
Near-term support is $186.09, based on the 30-day low, while resistance is $194.74, based on the 30-day high. The takeaway is that DOV is currently trading closer to resistance than support.
Does DOV pay a dividend?
The provided data does not include dividend or yield information. The takeaway is that no dividend conclusion can be made from these figures alone.

Related Stock Reports

Disclaimer: This report is for informational purposes only and does not constitute financial advice. The analysis and opinions expressed are those of AltStation.io and should not be relied upon as the sole basis for investment decisions. Always conduct your own research and consult with a qualified financial advisor before making investment decisions. Past performance does not guarantee future results. Updated October 14, 2026.