ALTSTATION.IO

Nordson Corporation (NDSN) Stock Analysis

By Nova Skye | AltStation.io | Updated September 19, 2026

Price
$307.95
Change
-1.61%
Market Cap
$17.15B
Avg Volume
400.1K

Company Overview

Nordson Corporation is a Westlake, Ohio-based manufacturer operating in the Specialty Industrial Machinery segment of the Industrials sector. At its core, the company builds precision dispensing, fluid management, and inspection systems that control the exact application of adhesives, coatings, sealants, and biomaterials. Its business spans three key divisions: Industrial Precision Solutions for factory assembly and packaging, Medical and Fluid Solutions for surgical components and syringes, and Advanced Technology Solutions for semiconductor and circuit board testing. Customers range from high-volume consumer packaging plants to electronics fabricators and medical device manufacturers who cannot afford dispensing errors.

Nordson is an entrenched market leader in high-precision fluid dispensing rather than a generic machinery builder. Its primary moat lies in high switching costs and sticky consumable components like nozzles, cartridges, and smart sensors that customers must replace regularly. The company competes directly against industrial peers like Graco and Illinois Tool Works, but Nordson carves out superior pricing power by dominating highly regulated niches like medical fluid delivery and microelectronics testing. The biggest threat to its baseline is cyclical customer spending, especially during downturns in semiconductor fabrication and general manufacturing.

Financially, Nordson is a steady compounding engine that prioritizes margin durability over runaway top-line expansion. Fiscal 2024 revenue reached $2.67 billion, marking modest growth over $2.65 billion in fiscal 2023. The standout metric is gross margin, which held firm at 55.2% across both 2023 and 2024, confirming that its pricing power remains intact. Founded in 1909, the company is actively tilting its business mix toward higher-margin medical and advanced electronics inspection lines. It operates as a defensive cash generator, though accelerating top-line growth will require a firmer rebound in tech-related capital expenditures.

Key Financials
Market Cap
$17.15B
Revenue
$2.98B
EBITDA
$957.89M
Gross Margin
55.4%
Profit Margin
18.6%
Revenue Growth
10.3%
Total Cash
$113.92M
Total Debt
$1.82B
Free Cash Flow
$613.81M


52-Week Price Performance Analysis

Price Statistics
P/E Ratio
31.14
Forward P/E
23.79
Beta
0.97
52-Week High
$339.12
52-Week Low
$220.47
EPS
$9.89
50-Day Avg
$305.41
200-Day Avg
$280.06
Price/Book
5.25
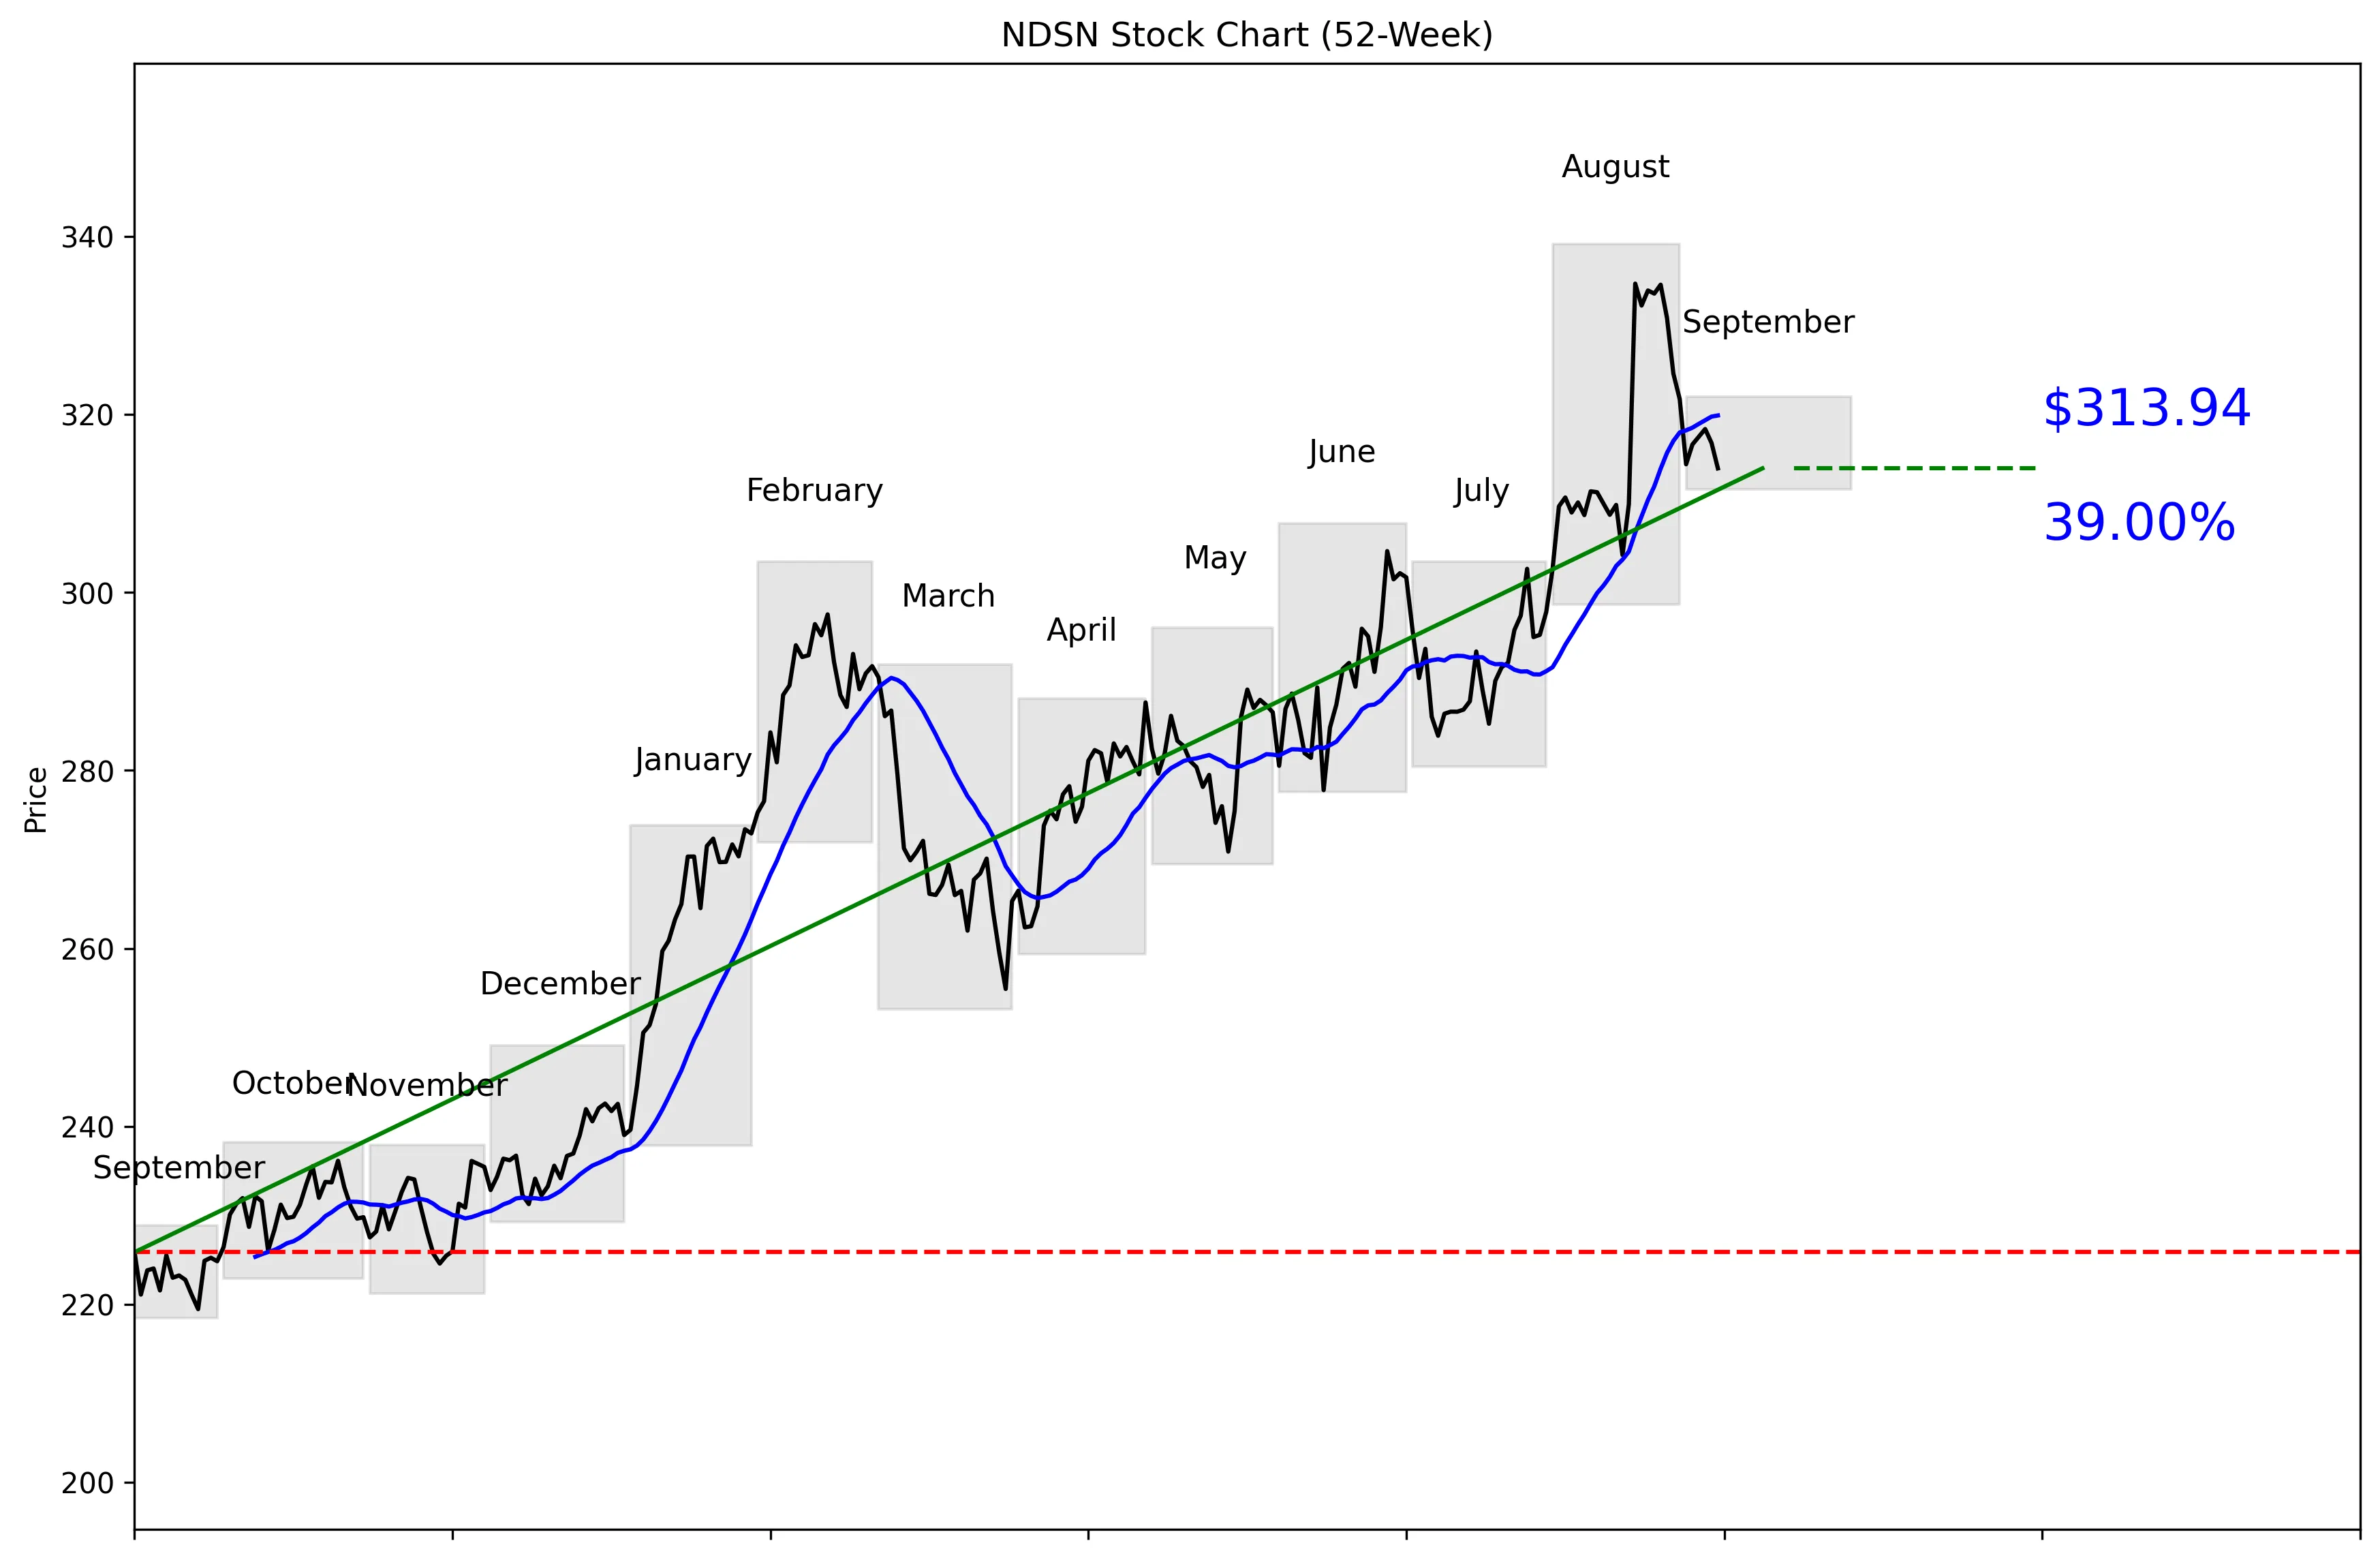
NDSN 52-Week Stock Chart
Technical Analysis
NDSN trades at $307.95, placing it 79% of the way from its $218.41 52-week low to its $339.12 high. The stock is 7.43% below that high and 43.74% above the low. Price is 1.86% below the 20-day moving average of $319.89, showing mild near-term weakness. Momentum is nearly flat over five trading days at -0.15% and slightly positive over 20 days at 0.83%. Near-term support is $294.98, while resistance sits at $334.70.


Recent News and Developments

No notable company-specific news this week

No verified Nordson earnings, analyst actions, product launches, or regulatory developments were published during the past week. The search found routine stock-price activity but no company-specific catalyst.

Latest Developments

Check back for the latest news and updates.

Latest Developments

Check back for the latest news and updates.


Market Sentiment and Analyst Recommendations

Bull Case
Revenue is growing 10.3%, which is the clearest reason to own NDSN. The company generates $2.98 billion in revenue and carries a $17.15 billion market capitalization. At $307.95, the shares remain below the $349.71 analyst target. The highest analyst target is $375.00, while the low estimate is $282.00. The stock is also only 7.43% below its 52-week high, showing that investors have kept the valuation near the top of its annual range. A move through $334.70 would strengthen the technical case and put the $339.12 high back in play.
Bear Case
NDSN trades at 31.14 times earnings, so investors are already paying a high multiple for its 10.3% revenue growth. Total debt stands at $1.82 billion, compared with only $113.92 million in cash. The stock is 79% of the way through its 52-week range, leaving less room for operational disappointment. Price is below the $319.89 20-day moving average, and five-day momentum is negative at -0.15%. The lowest analyst target is $282.00, below the current $307.95 price. A break under $294.98 would weaken the near-term setup and bring the bearish analyst target closer into focus. No verified company-specific catalyst appeared during the past week to offset these valuation and balance-sheet concerns.
What to Watch
Watch whether NDSN holds the $294.98 near-term support level over the next quarter. On the upside, $334.70 is the immediate resistance level, followed by the $339.12 52-week high. The $319.89 20-day moving average is the first trend marker the stock needs to reclaim. Investors should monitor whether revenue growth holds near the reported 10.3% rate. Cash of $113.92 million and debt of $1.82 billion should be tracked for evidence that balance-sheet leverage is improving or worsening. The analyst target range of $282.00 to $375.00 shows a wide spread in expectations, while the available data lists no consensus recommendation from seven analysts. No verified earnings date, analyst action, product launch, or regulatory event was provided, so there is no confirmed company-specific catalyst to calendar.
Analyst Consensus
NONE

Based on 7 analyst opinions
Low Target
$282.00
Mean Target
$349.71
High Target
$375.00


Earnings and Financial Data

Sector
Industrials
Industry
Specialty Industrial Machinery
Employees
8,200
Earnings & Dividends
Next Earnings
Aug 19, 2026
EPS (Trailing)
$9.89
Dividend Yield
120.0%
Payout Ratio
33.2%

Frequently Asked Questions

Is NDSN a good stock to buy?
NDSN offers 10.3% revenue growth, but it trades at a P/E of 31.14 and sits 79% of the way through its 52-week range. The takeaway is that the growth case is credible, but the current valuation leaves limited room for mistakes.
What is NDSN’s price target?
The analyst target is $349.71, with estimates ranging from $282.00 to $375.00. The takeaway is that analysts see potential above the $307.95 share price, but their expectations vary widely.
What are NDSN’s support and resistance levels?
Near-term support is $294.98, and near-term resistance is $334.70. The takeaway is that these are the key levels to watch for the next directional move.
Is NDSN near its 52-week high?
NDSN is 7.43% below its $339.12 52-week high and 43.74% above its $218.41 low. The takeaway is that the stock remains much closer to its high than its low.
Does NDSN pay a dividend?
The provided data does not include a dividend rate, yield, or payment history. The takeaway is that no dividend conclusion can be made from the available information.

Related Stock Reports

Disclaimer: This report is for informational purposes only and does not constitute financial advice. The analysis and opinions expressed are those of AltStation.io and should not be relied upon as the sole basis for investment decisions. Always conduct your own research and consult with a qualified financial advisor before making investment decisions. Past performance does not guarantee future results. Updated September 19, 2026.