ALTSTATION.IO

Fidelity National Information Services, Inc. (FIS) Stock Analysis

By Nova Skye | AltStation.io | Updated October 25, 2026

Price
$37.16
Change
-2.96%
Market Cap
$19.20B
Avg Volume
6.2M

Company Overview

Fidelity National Information Services, known as FIS, builds the essential digital plumbing for the global financial sector. Headquartered in Jacksonville, Florida, the firm operates within the Information Technology Services industry and has built institutional infrastructure since 1968. They sell core banking software, mobile platforms, fraud prevention tools, and payment networks directly to banks, corporations, and developers. They also provide specialized capital markets software handling institutional trading, syndicated lending, and treasury operations. When a bank clears an electronic transfer or runs risk compliance, FIS software is frequently running the underlying process.

FIS holds the position of an entrenched legacy leader rather than an agile challenger. Their primary operational edge is exceptionally high switching costs, as major financial institutions rarely risk replacing core ledger and processing software once installed. The main threat comes from agile digital payment platforms and cloud-first challengers taking market share in card processing and user-facing retail banking. Despite pressure from newer tech stacks, FIS retains a structural advantage through long-term enterprise relationships and critical regulatory compliance systems.

Right now, FIS operates as a mature financial technology utility focused on its two core pillars: Banking Solutions and Capital Market Solutions. The company is prioritizing recurring enterprise revenue by cross-selling wealth management, lending, and treasury applications to its existing base of financial institutions. Instead of pursuing speculative consumer products, their focus rests on processing high-volume transactions and mission-critical data for global lenders. For financial institutions needing institutional-grade compliance and transaction processing, FIS remains an established default choice.

Key Financials
Market Cap
$19.20B
Revenue
$12.20B
EBITDA
$3.52B
Gross Margin
35.8%
Profit Margin
27.6%
Revenue Growth
29.1%
Total Cash
$744.00M
Total Debt
$21.26B
Free Cash Flow
$2.65B


52-Week Price Performance Analysis

Price Statistics
P/E Ratio
5.71
Forward P/E
5.58
Beta
0.83
52-Week High
$68.98
52-Week Low
$32.10
EPS
$6.51
50-Day Avg
$37.54
200-Day Avg
$44.59
Price/Book
1.20
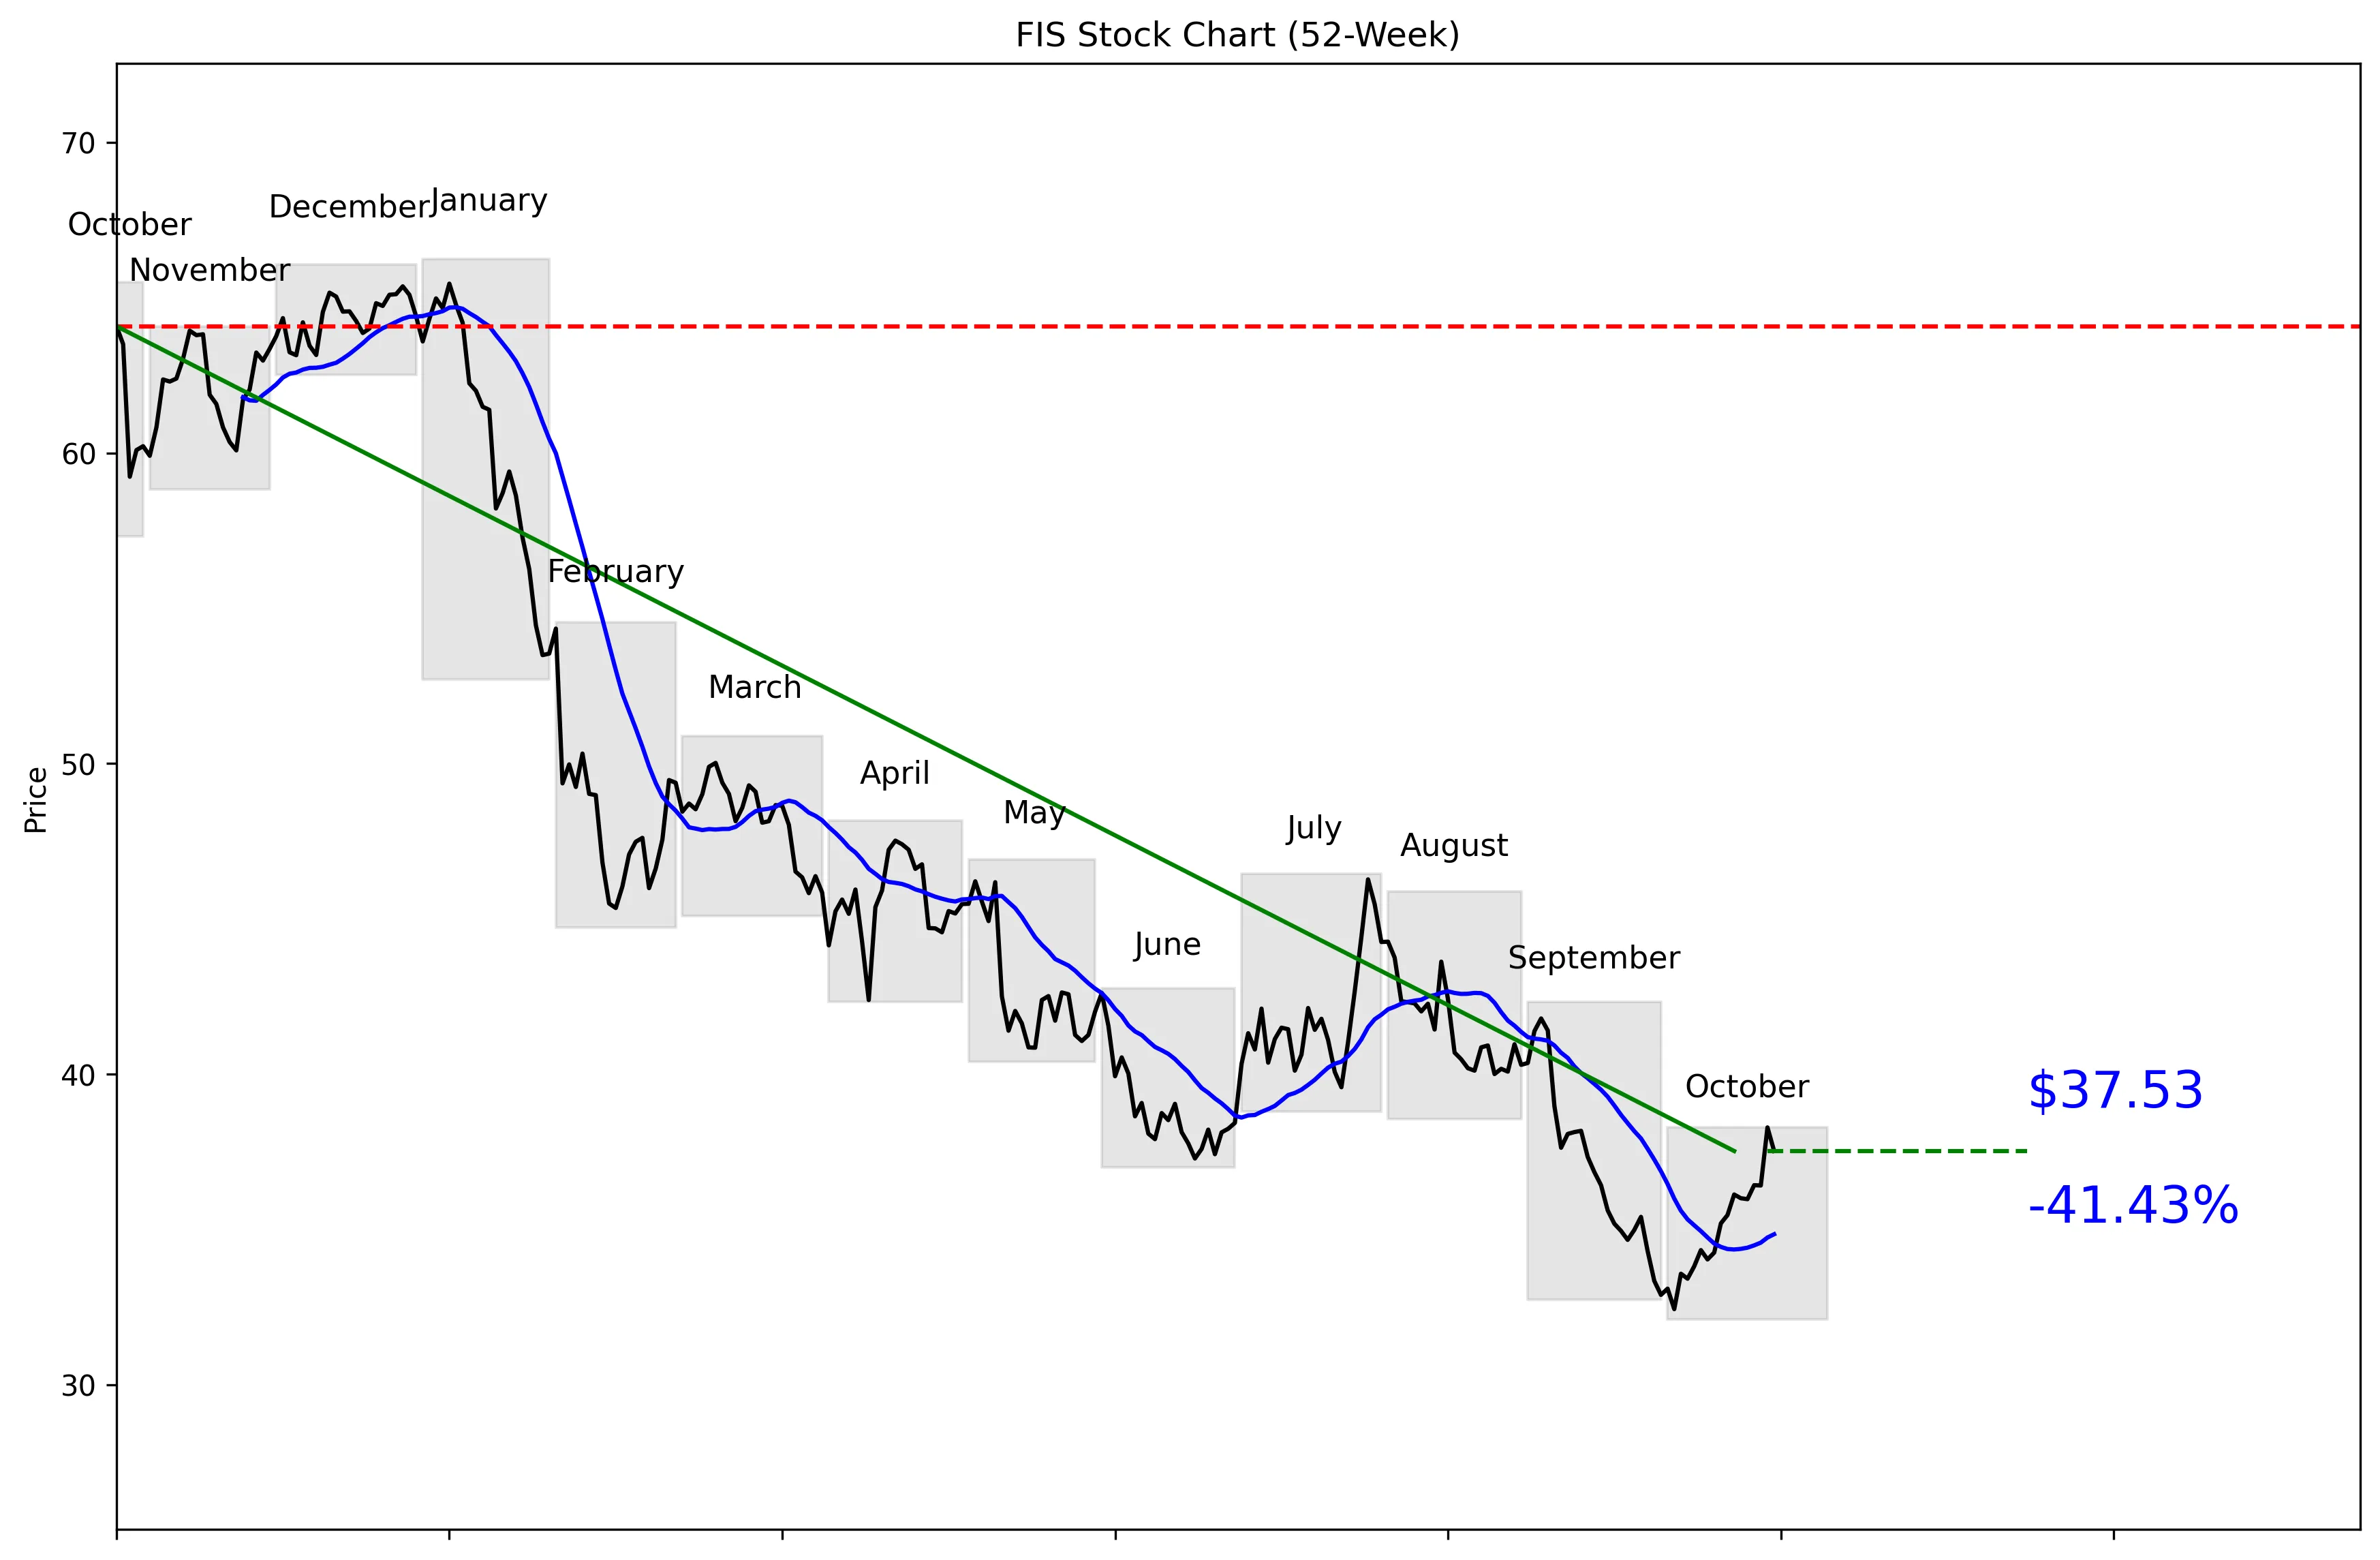
FIS 52-Week Stock Chart
Technical Analysis
FIS trades at $37.16, just 16% of the way through its $32.10 to $66.26 52-week range. The stock is 43.36% below its 52-week high and 16.92% above its low. Price is 7.69% above the $34.85 20-day moving average, with momentum of 4.22% over five trading days and 5.99% over 20 trading days. Near-term support sits at $32.44, while $38.29 is the resistance level buyers need to clear.


Recent News and Developments

Truist cuts FIS price target to $37

Truist lowered its FIS price target from $43 to $37 on October 23 while keeping a Hold rating. FIS closed at $37.53 that day, down $0.76, or 1.98%. Source: Benzinga

FIS research exposes an AI measurement gap

FIS reported that 90% of surveyed UK finance leaders have a business case for using AI in cash management, but only 71% can clearly measure the value delivered. The survey covered 100 senior finance directors at UK companies with at least £250 million in revenue. Source: FIS

FIS moves third-quarter earnings to November 4

FIS rescheduled its third-quarter 2026 results call from November 3 to November 4 before the market opens. The webcast remains scheduled for 8:30 a.m. EST. Source: FIS


Market Sentiment and Analyst Recommendations

Bull Case
Revenue growth of 29.1% is the strongest argument for owning FIS. The company generates $12.20 billion in revenue against a $19.20 billion market cap, while its P/E ratio is just 5.71. That valuation leaves room for upside if the recent growth rate proves durable. The analyst consensus is buy across 25 analysts, with an average target of $47.28 and a high estimate of $77.00. Technical momentum is also improving, with the stock 7.69% above its 20-day moving average. FIS research found that 90% of surveyed UK finance leaders have a business case for AI in cash management, pointing to real customer interest in an area where FIS operates.
Bear Case
The stock is still 43.36% below its 52-week high, so the longer-term chart remains damaged despite the recent bounce. FIS also carries $21.26 billion in debt against only $744.00 million in cash. That balance-sheet gap is the clearest fundamental risk in the supplied data. Truist cut its price target from $43 to $37 on October 23 and kept a Hold rating. The $37 Truist target is slightly below the current $37.16 price, suggesting limited upside under that analyst’s view. The wider analyst range of $37.00 to $77.00 shows major disagreement about what FIS is worth. The supplied data does not include margins, cash flow, market-share trends, or macroeconomic sensitivity, so the quality and durability of the reported 29.1% revenue growth cannot be confirmed here.
What to Watch
FIS will report third-quarter 2026 results before the market opens on November 4, with its webcast scheduled for 8:30 a.m. EST. Revenue growth is the central metric because the current 29.1% rate supports the bull case. Investors should also watch whether cash rises from $744.00 million or debt declines from $21.26 billion. On the chart, a move above $38.29 would break the current 30-day resistance level, while a decline below $32.44 would break near-term support. Analyst revisions matter after Truist reduced its target to $37, especially because the broader average remains $47.28. FIS should also show whether customer interest in AI cash management can produce measurable value, given the gap between the 90% with a business case and the 71% able to measure results.
Analyst Consensus
BUY

Based on 25 analyst opinions
Low Target
$37.00
Mean Target
$47.28
High Target
$77.00


Earnings and Financial Data

Sector
Technology
Industry
Information Technology Services
Employees
44,000
Earnings & Dividends
Next Earnings
Nov 04, 2026
EPS (Trailing)
$6.51
Dividend Yield
460.0%
Payout Ratio
25.8%

Frequently Asked Questions

Is FIS a good stock to buy?
The recommendation is buy across 25 analysts, and revenue is growing 29.1%. The clear takeaway is that analysts are bullish, but the $21.26 billion debt load remains a major risk.
What is the analyst price target for FIS?
The average analyst target is $47.28, with estimates ranging from $37.00 to $77.00. The takeaway is that the average target sits above the current $37.16 price, but analyst expectations vary widely.
What is FIS’s 52-week range?
The supplied key data lists a 52-week range of $32.10 to $68.98, while the technical price series shows a high of $66.26 and the same $32.10 low. The takeaway is that FIS trades near the bottom of either stated range.
What are the support and resistance levels for FIS?
The 30-day low places near-term support at $32.44, while the 30-day high sets resistance at $38.29. The takeaway is that $38.29 is the immediate level the stock needs to clear.
Does FIS pay a dividend?
The supplied key and technical data do not include dividend information. The takeaway is that no dividend conclusion can be made from this data.

Related Stock Reports

Disclaimer: This report is for informational purposes only and does not constitute financial advice. The analysis and opinions expressed are those of AltStation.io and should not be relied upon as the sole basis for investment decisions. Always conduct your own research and consult with a qualified financial advisor before making investment decisions. Past performance does not guarantee future results. Updated October 25, 2026.