ALTSTATION.IO

Xylem Inc. (XYL) Stock Analysis

By Nova Skye | AltStation.io | Updated October 20, 2026

Price
$104.18
Change
+0.63%
Market Cap
$24.32B
Avg Volume
2.2M

Company Overview

Xylem Inc., together with its subsidiaries, engages in the design, manufacture, and servicing of engineered products and solutions for utility, industrial, and residential and commercial building services settings worldwide. It operates through Water Infrastructure; Applied Water; Measurement and Co

Key Financials
Market Cap
$24.32B
Revenue
$9.13B
EBITDA
$1.98B
Gross Margin
39.2%
Profit Margin
11.2%
Revenue Growth
1.5%
Total Cash
$1.28B
Total Debt
$3.06B
Free Cash Flow
$1.18B


52-Week Price Performance Analysis

Price Statistics
P/E Ratio
24.80
Forward P/E
16.76
Beta
0.99
52-Week High
$154.27
52-Week Low
$98.58
EPS
$4.20
50-Day Avg
$108.34
200-Day Avg
$119.08
Price/Book
2.33
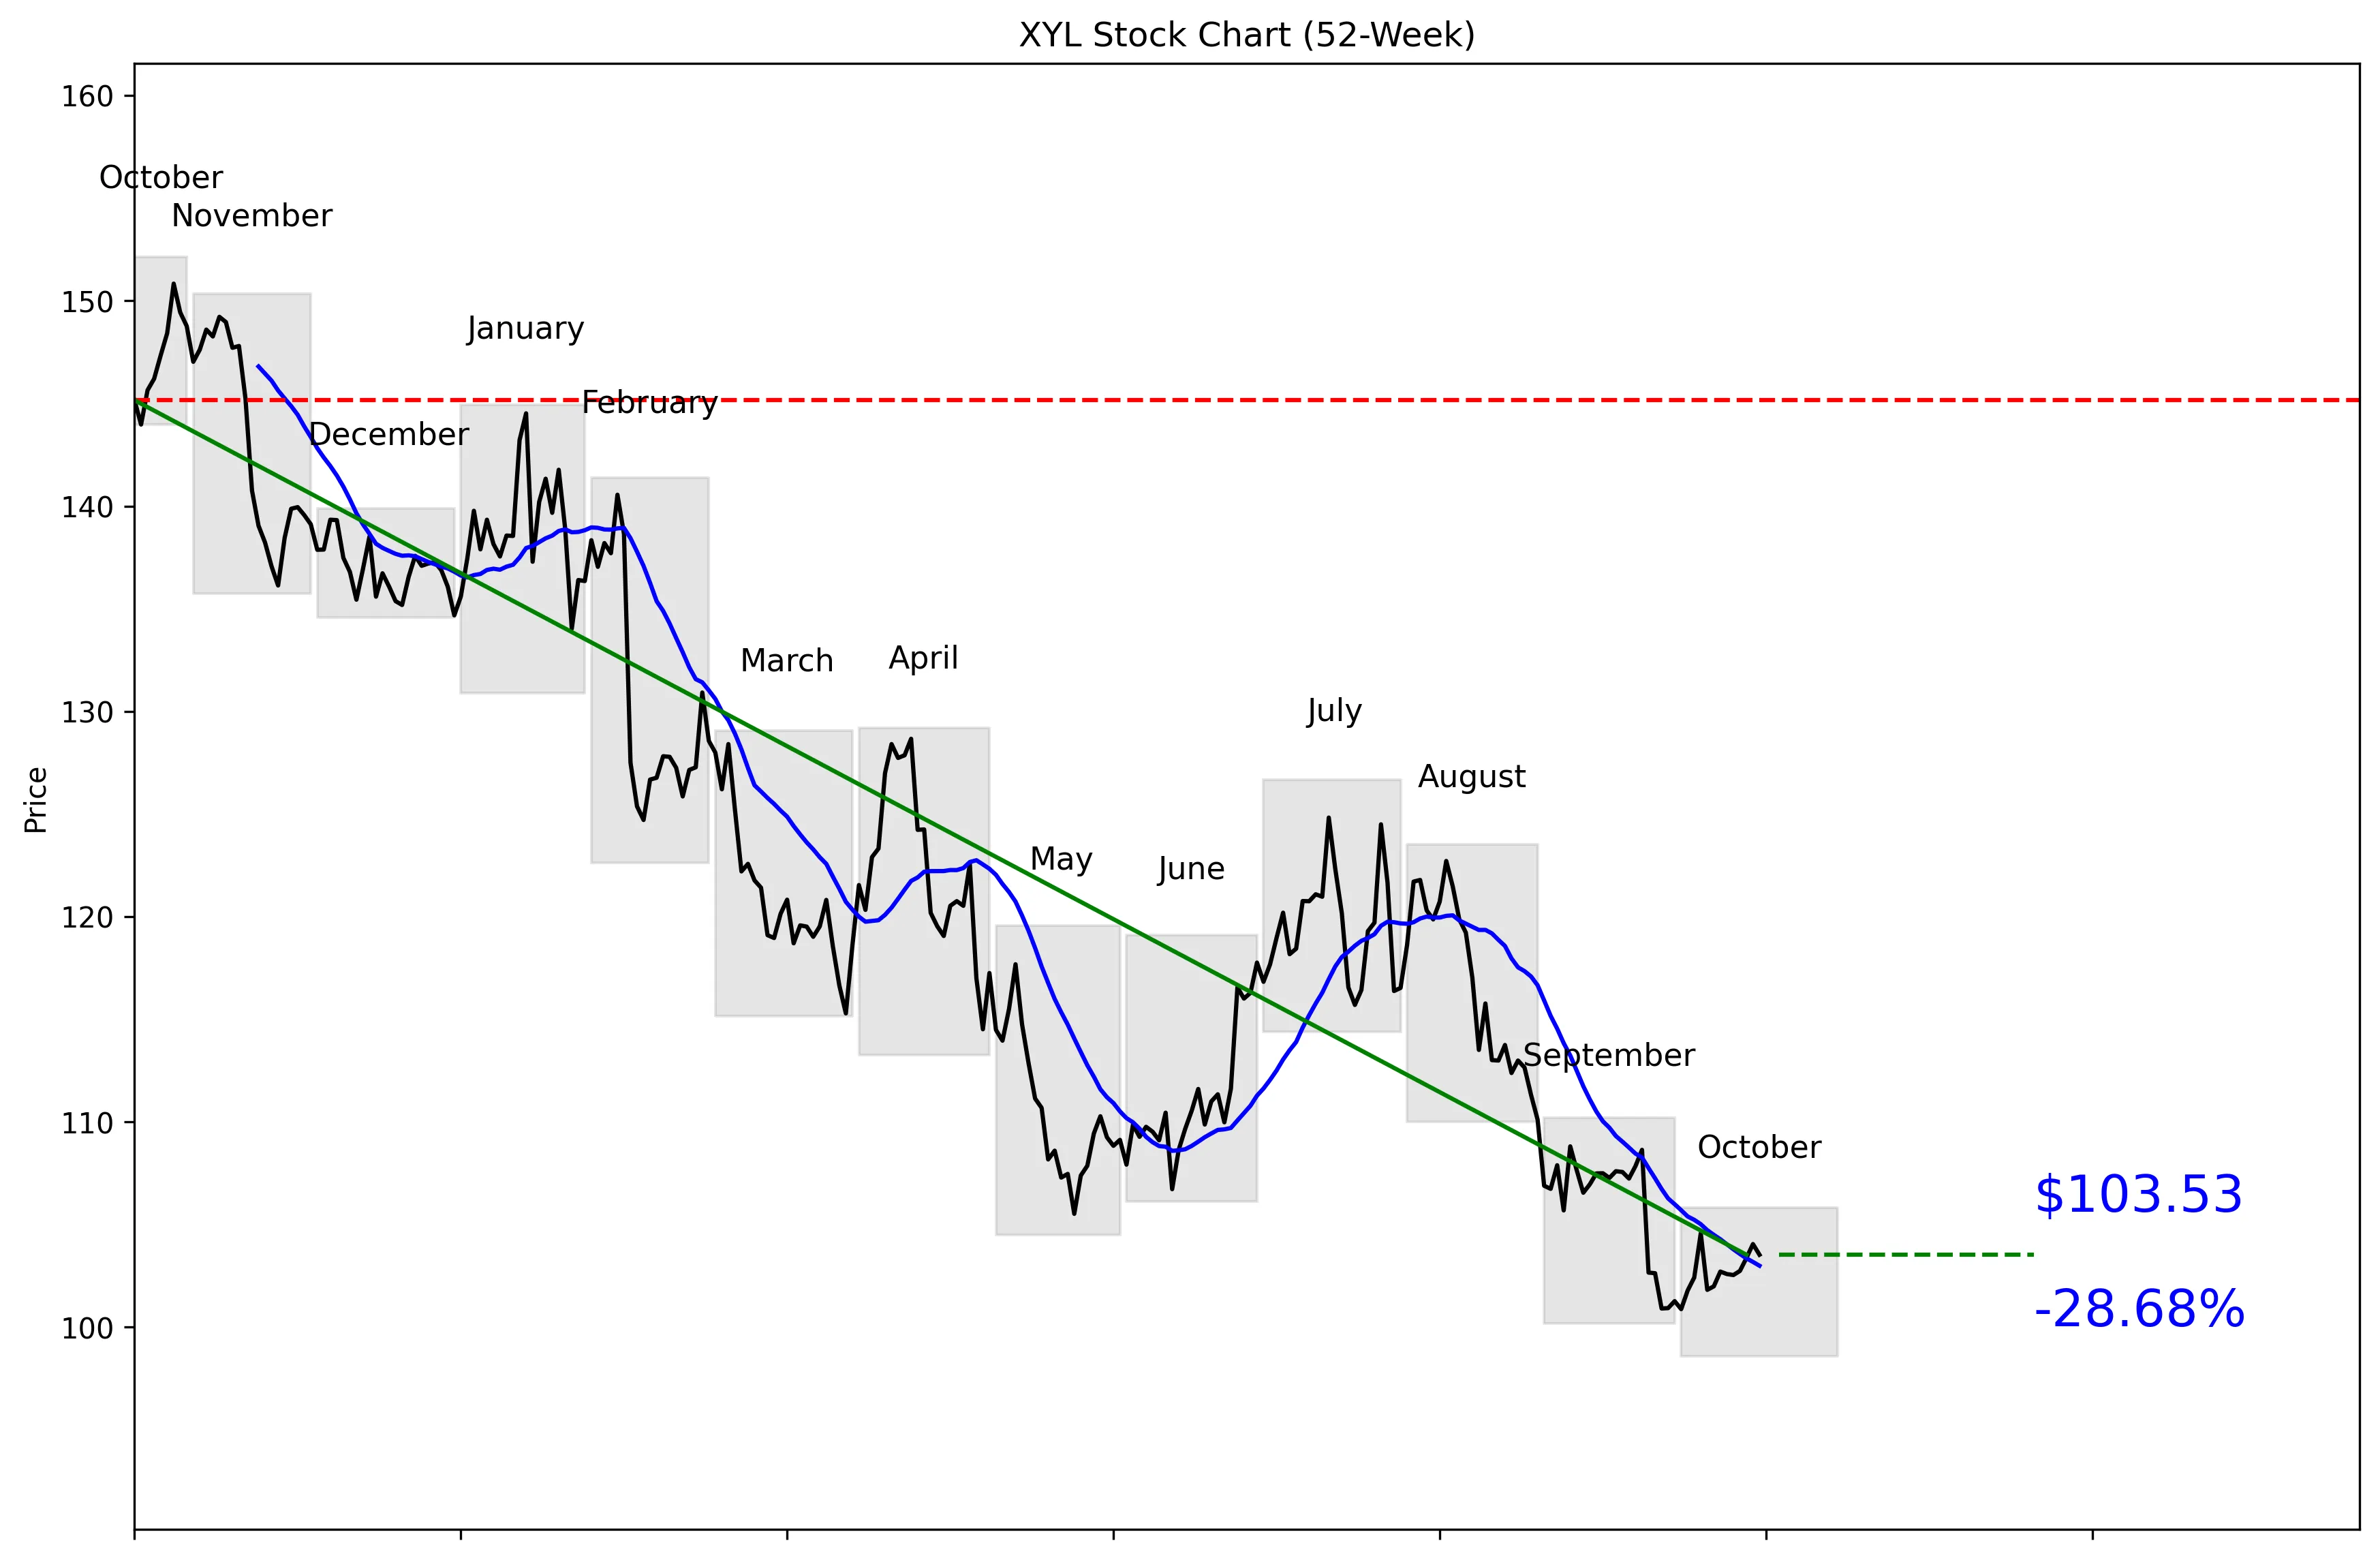
XYL 52-Week Stock Chart
Technical Analysis
XYL trades at $104.18, just 9% of the way from its $98.58 52-week low to its $152.14 high. The stock is 31.95% below that high and only 5.02% above the low, confirming a weak 52-week trend. Price is 0.52% versus the $102.99 20-day moving average, so the stock has stabilized near its short-term trend line. Five-day momentum is positive at 0.92%, but 20-day momentum remains negative at 3.46%. Near-term support is $100.88, while $108.81 is the resistance level buyers need to clear.


Recent News and Developments

Stifel cuts Xylem target to $141

Stifel lowered its Xylem price target from $160 to $141 on October 19 but kept its Buy rating. Analyst Nathan Jones said the stock had fallen about 14% during the quarter and 25% year to date, while low organic growth and electric-meter headwinds remain concerns. Source: Investing.com

JPMorgan cuts Xylem target to $118

JPMorgan lowered its price target from $137 to $118 on October 19 and maintained a Neutral rating. That is a 13.9% target cut and another clear sign that Wall Street is resetting expectations ahead of Xylem’s next earnings report. Source: Stock Analysis

Mizuho slashes Xylem target by 15.4%

Mizuho cut its Xylem price target from $130 to $110 on October 15 while maintaining its Hold rating. The new target is $20 lower and represents one of the most cautious current analyst forecasts for XYL. Source: Stock Analysis


Market Sentiment and Analyst Recommendations

Bull Case
Xylem generates $9.13 billion in revenue and has a $24.32 billion market cap. Revenue growth is positive at 1.5%, even if it is not impressive. The analyst consensus remains Buy across 16 analysts, with an average target of $142.62. That target sits well above the current $104.18 price, while the highest forecast reaches $180.00. The stock is also trading close to its 52-week low, leaving room for a recovery if growth improves. The reason to buy here is straightforward: expectations have fallen sharply, but analyst sentiment remains broadly positive.
Bear Case
The biggest problem is that 1.5% revenue growth does not make a P/E of 24.80 look cheap. Xylem has $3.06 billion in debt against $1.28 billion in cash, limiting the strength of its balance-sheet cushion. Stifel specifically identified low organic growth and electric-meter headwinds when cutting its target from $160 to $141 on October 19. JPMorgan reduced its target from $137 to $118 the same day and kept a Neutral rating. Mizuho went further, cutting its target from $130 to $110 on October 15 while maintaining a Hold rating. The stock may be 31.95% below its 52-week high, but weak growth and repeated target cuts could keep it cheap for a reason.
What to Watch
The next earnings report needs to show whether the low organic growth cited by Stifel is improving, although the report date was not provided. Revenue growth is the critical metric, with the current rate at just 1.5%. Investors should also watch for evidence that the electric-meter headwinds are easing. On the chart, $100.88 is the immediate support level; a break below it would put the $98.58 52-week low back in focus. A move above $108.81 would clear the 30-day high and improve the near-term setup. Analyst revisions also matter because targets were cut to $141, $118, $110, $135, $150, and $139 between October 13 and October 19.
Analyst Consensus
BUY

Based on 16 analyst opinions
Low Target
$110.00
Mean Target
$142.62
High Target
$180.00


Earnings and Financial Data

Sector
Industrials
Industry
Specialty Industrial Machinery
Employees
22,000
Earnings & Dividends
Next Earnings
Oct 27, 2026
EPS (Trailing)
$4.20
Dividend Yield
166.0%
Payout Ratio
39.5%

Frequently Asked Questions

Is XYL a good stock to buy?
The consensus recommendation is Buy based on 16 analysts, but revenue growth is only 1.5% and the P/E is 24.80. Takeaway: XYL has recovery potential, but the valuation demands stronger growth.
What is XYL’s price target?
The average analyst target is $142.62, with forecasts ranging from $110.00 to $180.00. Takeaway: Wall Street sees upside from the current $104.18 price, but the target range shows meaningful disagreement.
Is XYL stock near its 52-week low?
XYL is 5.02% above its $98.58 52-week low and sits 9% of the way from the low to the $152.14 high. Takeaway: the stock is trading near the bottom of its 52-week range.
What are XYL’s support and resistance levels?
Near-term support is the 30-day low of $100.88, while resistance is the 30-day high of $108.81. Takeaway: those are the key levels for judging XYL’s next short-term move.
Does XYL pay a dividend?
The provided data does not include a dividend amount or yield. Takeaway: dividend status cannot be confirmed from this data.

Related Stock Reports

Disclaimer: This report is for informational purposes only and does not constitute financial advice. The analysis and opinions expressed are those of AltStation.io and should not be relied upon as the sole basis for investment decisions. Always conduct your own research and consult with a qualified financial advisor before making investment decisions. Past performance does not guarantee future results. Updated October 20, 2026.