ALTSTATION.IO

BXP, Inc. (BXP) Stock Analysis

By Nova Skye | AltStation.io | Updated September 10, 2026

Price
$67.86
Change
+1.13%
Market Cap
$12.27B
Avg Volume
1.4M

Company Overview

BXP, Inc. is a Boston-based office real estate investment trust that develops, owns, and manages high-end workplaces across the United States. The company leases premium commercial space, primarily top-tier Central Business District office buildings, to creditworthy corporate tenants looking for institutional-grade facilities. Incorporated in 1970, BXP operates as a fully integrated real estate firm with specialized in-house property management. Its portfolio concentrates strictly across six premier coastal markets: Boston, Los Angeles, New York, San Francisco, Seattle, and Washington, DC.

BXP is the clear market leader in the premier workspace segment, standing as the largest publicly traded office REIT in the country with more than 55 years of operating history. Its competitive edge comes from controlling high-barrier-to-entry central locations and running its own building operations to retain top-tier tenants. The obvious headwind is its heavy concentration in high-cost coastal markets where corporate leasing demand dictates cash flow. Still, BXP defends its position by focusing on premium mixed-use and build-to-suit assets rather than competing in the vulnerable commodity office space.

As of June 30, 2026, BXP commands a 51.1 million square foot footprint across 164 total properties. While 143 of those assets are office buildings, the firm is balancing the mix with 13 retail sites, seven residential properties, and one hotel. BXP is actively building rather than standing still, with six properties currently under construction or redevelopment, including four residential projects. That active development pipeline shows management is still deploying capital to upgrade its asset base and capture demand in its core gateway cities.

Key Financials
Market Cap
$12.27B
Revenue
$3.19B
EBITDA
$1.62B
Gross Margin
56.5%
Profit Margin
9.3%
Revenue Growth
3.7%
Total Cash
$495.53M
Total Debt
$16.36B
Free Cash Flow
$880.64M


52-Week Price Performance Analysis

Price Statistics
P/E Ratio
36.48
Forward P/E
30.53
Beta
1.04
52-Week High
$79.33
52-Week Low
$49.72
EPS
$1.86
50-Day Avg
$68.51
200-Day Avg
$63.59
Price/Book
2.10
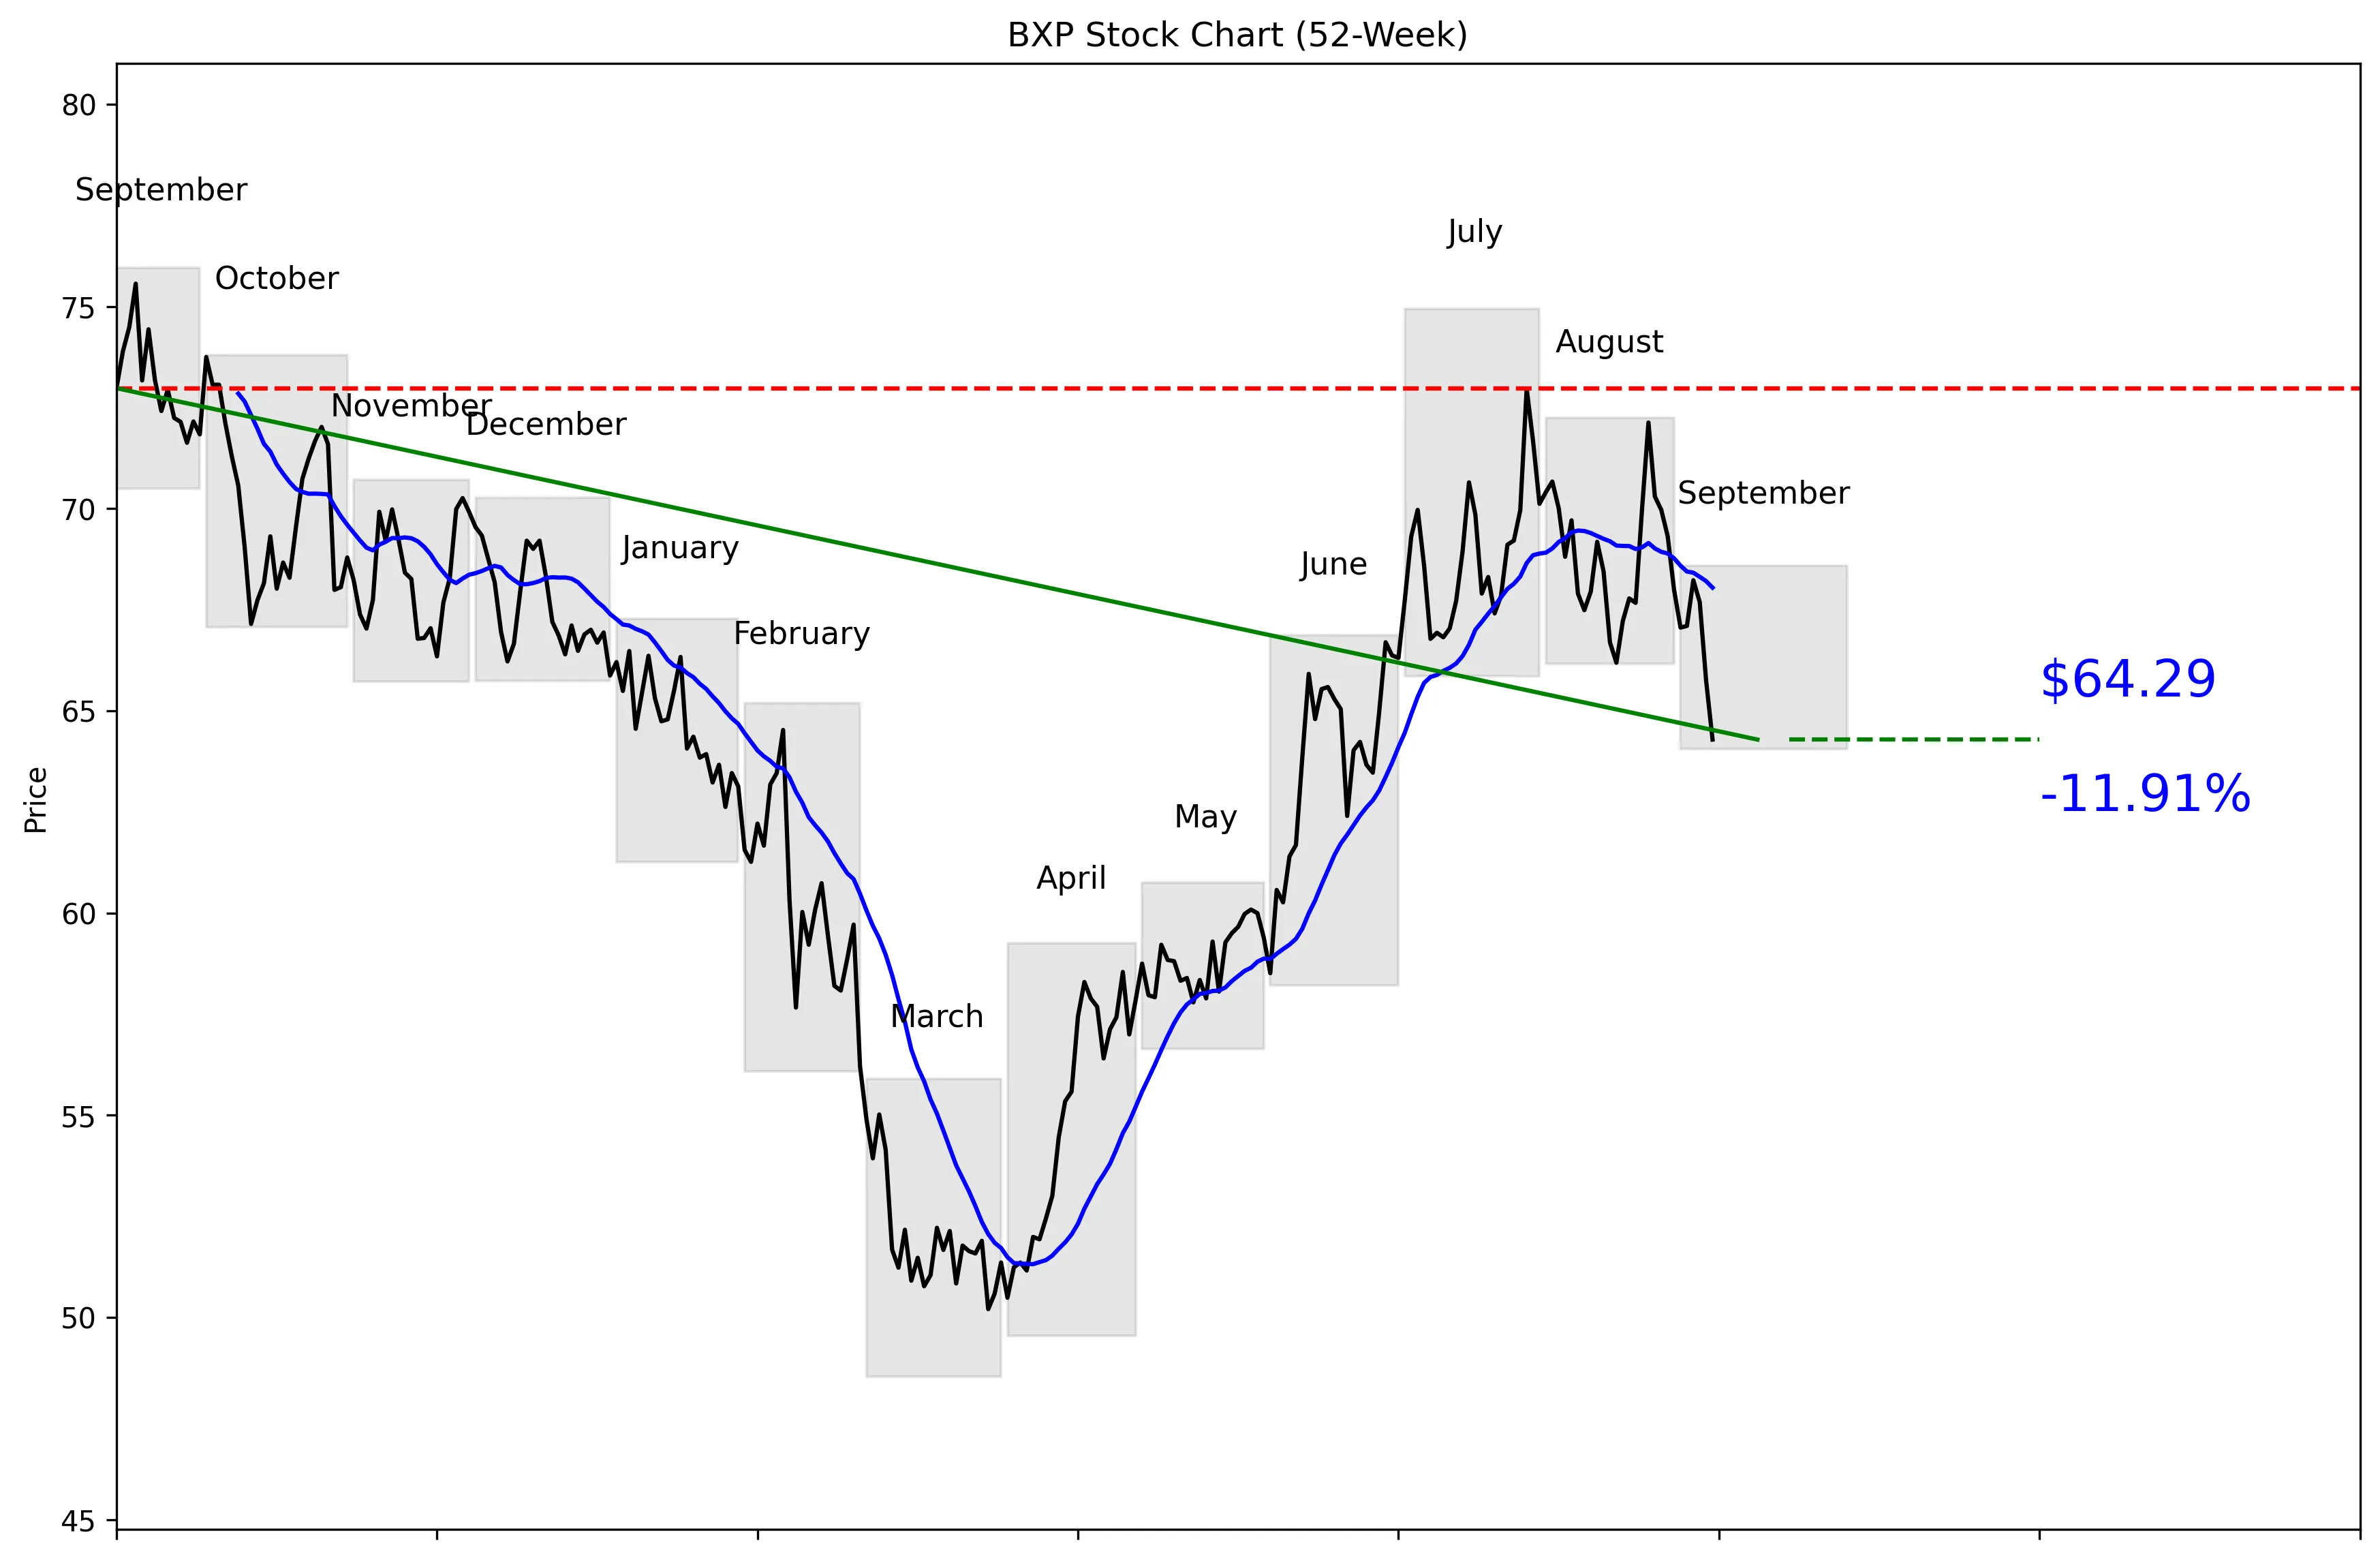
BXP 52-Week Stock Chart
Technical Analysis
BXP trades at $67.86, placing it 57% of the way from its technical 52-week low of $48.54 to its high of $75.95. The stock is 15.35% below that high but remains 32.46% above the low. Momentum is negative, with declines of 4.13% over five trading days and 4.74% over 20 trading days. The technical data puts the price 5.52% below its 20-day moving average of $68.05. Near-term support is $64.29, while $72.97 is the resistance level buyers need to break.


Recent News and Developments

Truist lifts BXP price target but stays neutral

Truist Securities raised its BXP price target from $64 to $68 while keeping a Hold rating. The firm increased its 2026 and 2027 funds-from-operations estimates, citing better-than-expected portfolio performance. Source: Investing.com

BXP pays $30 million for two Waltham buildings

BXP acquired 860 and 870 Winter Street in Waltham for $30 million. The properties sit in an office park where the city council recently approved new zoning. Source: Boston Business Journal

BXP shares drop 2.88% on September 8

BXP closed at $65.74 on September 8, down 2.88% for the session, after trading between $65.68 and $68.02. The stock had closed at $68.23 on September 3, putting it down 3.65% across those two closing prices. Source: FinanceCharts


Market Sentiment and Analyst Recommendations

Bull Case
Revenue is $3.19 billion and is growing 3.7%, giving BXP positive top-line momentum. Truist raised its price target from $64 to $68 after increasing its 2026 and 2027 funds-from-operations estimates because portfolio performance exceeded expectations. BXP also acquired two Waltham buildings for $30 million in an office park with newly approved zoning. The analyst consensus is buy across 20 analysts, with a $76.50 average target. That target sits $8.64 above the current $67.86 price, or roughly 12.7% upside. The bull case is straightforward: improving portfolio performance, positive revenue growth, and potential appreciation toward the consensus target justify buying the recent weakness.
Bear Case
BXP carries $16.36 billion in total debt against just $495.53 million in cash. That leverage is the biggest problem in the thesis and leaves limited financial flexibility. The stock also trades at 36.48 times earnings despite revenue growth of only 3.7%, which is an expensive growth-adjusted valuation. Price momentum is weak, with BXP down 4.13% over five trading days and 4.74% over 20 trading days. Shares dropped 2.88% on September 8 to $65.74 and were down 3.65% from the September 3 close of $68.23. Truist’s $68 target and Hold rating also suggest the current $67.86 price already reflects most of that firm’s expected upside.
What to Watch
The first threshold is $64.29, the 30-day low and stated near-term support. A break below that level would confirm that the current 4.74% 20-day decline is still controlling the trade. On the upside, watch the $68.05 moving average and then resistance at $72.97. Clearing $72.97 would put the technical 52-week high of $75.95 back in play. Investors should track whether the better-than-expected portfolio performance behind Truist’s higher 2026 and 2027 funds-from-operations estimates continues. The next quarter should also show whether the $30 million Waltham acquisition strengthens the portfolio or simply adds to a balance sheet already carrying $16.36 billion in debt.
Analyst Consensus
BUY

Based on 20 analyst opinions
Low Target
$60.00
Mean Target
$76.50
High Target
$91.00


Earnings and Financial Data

Sector
Real Estate
Industry
REIT – Office
Employees
826
Earnings & Dividends
Next Earnings
Oct 27, 2026
EPS (Trailing)
$1.86
Dividend Yield
417.0%
Payout Ratio
150.5%

Frequently Asked Questions

Is BXP a good stock to buy?
The recommendation is buy based on 20 analysts, and the average analyst target is $76.50 versus a current price of $67.86. The clear takeaway is that analysts see upside, but weak momentum and heavy debt raise the risk.
What is BXP’s price target?
The average analyst target is $76.50, with estimates ranging from $60.00 to $91.00. The clear takeaway is that Wall Street’s outlook is positive on average but widely divided.
Is BXP stock overvalued?
BXP trades at a P/E ratio of 36.48 while revenue growth is 3.7%. The clear takeaway is that the valuation is demanding relative to the reported growth rate.
What are BXP’s support and resistance levels?
Near-term support is $64.29, and near-term resistance is $72.97. The clear takeaway is that these are the key levels defining the current trading range.
Does BXP pay a dividend?
The provided data does not include dividend or yield information, so a dividend conclusion cannot be made from it. The clear takeaway is that investors should verify current dividend data separately.

Related Stock Reports

Disclaimer: This report is for informational purposes only and does not constitute financial advice. The analysis and opinions expressed are those of AltStation.io and should not be relied upon as the sole basis for investment decisions. Always conduct your own research and consult with a qualified financial advisor before making investment decisions. Past performance does not guarantee future results. Updated September 10, 2026.