ALTSTATION.IO

Lam Research Corporation (LRCX) Stock Analysis

By Nova Skye | AltStation.io | Updated October 27, 2026

Price
$238.75
Change
+3.76%
Market Cap
$298.78B
Avg Volume
9.6M

Company Overview

Headquartered in Fremont, California, Lam Research operates in the Technology sector as a vital player in the Semiconductor Equipment & Materials industry. The company builds the multi-million-dollar machinery that semiconductor foundries use to manufacture advanced integrated circuits. Its core product lineup focuses on thin-film deposition tools like ALTUS and VECTOR, high-precision etch equipment like Kiyo and Vantex, and specialized wafer-cleaning platforms like Coronus. Major chipmakers and memory manufacturers across the United States, South Korea, Taiwan, and China buy these systems, providing Lam with a steady follow-on stream of revenue from recurring servicing, replacement parts, and upgrades.

Lam is not a generalist; it is the dominant market leader in semiconductor etch and holds the clear number two spot worldwide in deposition. While larger rival Applied Materials sells a broader catalog of equipment and ASML corners lithography, Lam dominates the high-aspect-ratio etching needed to carve billions of microscopic channels into silicon. That technological edge gives Lam formidable pricing power, though it also concentrates risk by tying results directly to the capital spending swings of a few giant memory and foundry clients. If chipmakers want to build next-generation 3D NAND or advanced logic chips, they cannot bypass Lam’s toolset.

The business is expanding fast, posting $23.23 billion in revenue for fiscal year 2026, a 26% increase over the $18.44 billion reported in the prior fiscal year. That growth is fueled by massive demand for artificial intelligence hardware, which requires high-bandwidth memory and taller 3D chip architectures that consume more of Lam’s etching tools per wafer. Profitability is outstanding, with Lam turning in a 31.27% net margin for fiscal 2026. Trade friction and export controls regarding sales into China remain the primary overhang, but Lam sits in a prime position as the global wafer fab equipment market expands toward the low-$150 billion range.

Key Financials
Market Cap
$298.78B
Revenue
$26.13B
EBITDA
$10.12B
Gross Margin
51.1%
Profit Margin
32.3%
Revenue Growth
54.4%
Total Cash
$7.44B
Total Debt
$3.74B
Free Cash Flow
$4.55B


52-Week Price Performance Analysis

Price Statistics
P/E Ratio
35.58
Forward P/E
19.65
Beta
1.85
52-Week High
$438.50
52-Week Low
$135.50
EPS
$6.71
50-Day Avg
$302.39
200-Day Avg
$283.43
Price/Book
21.44
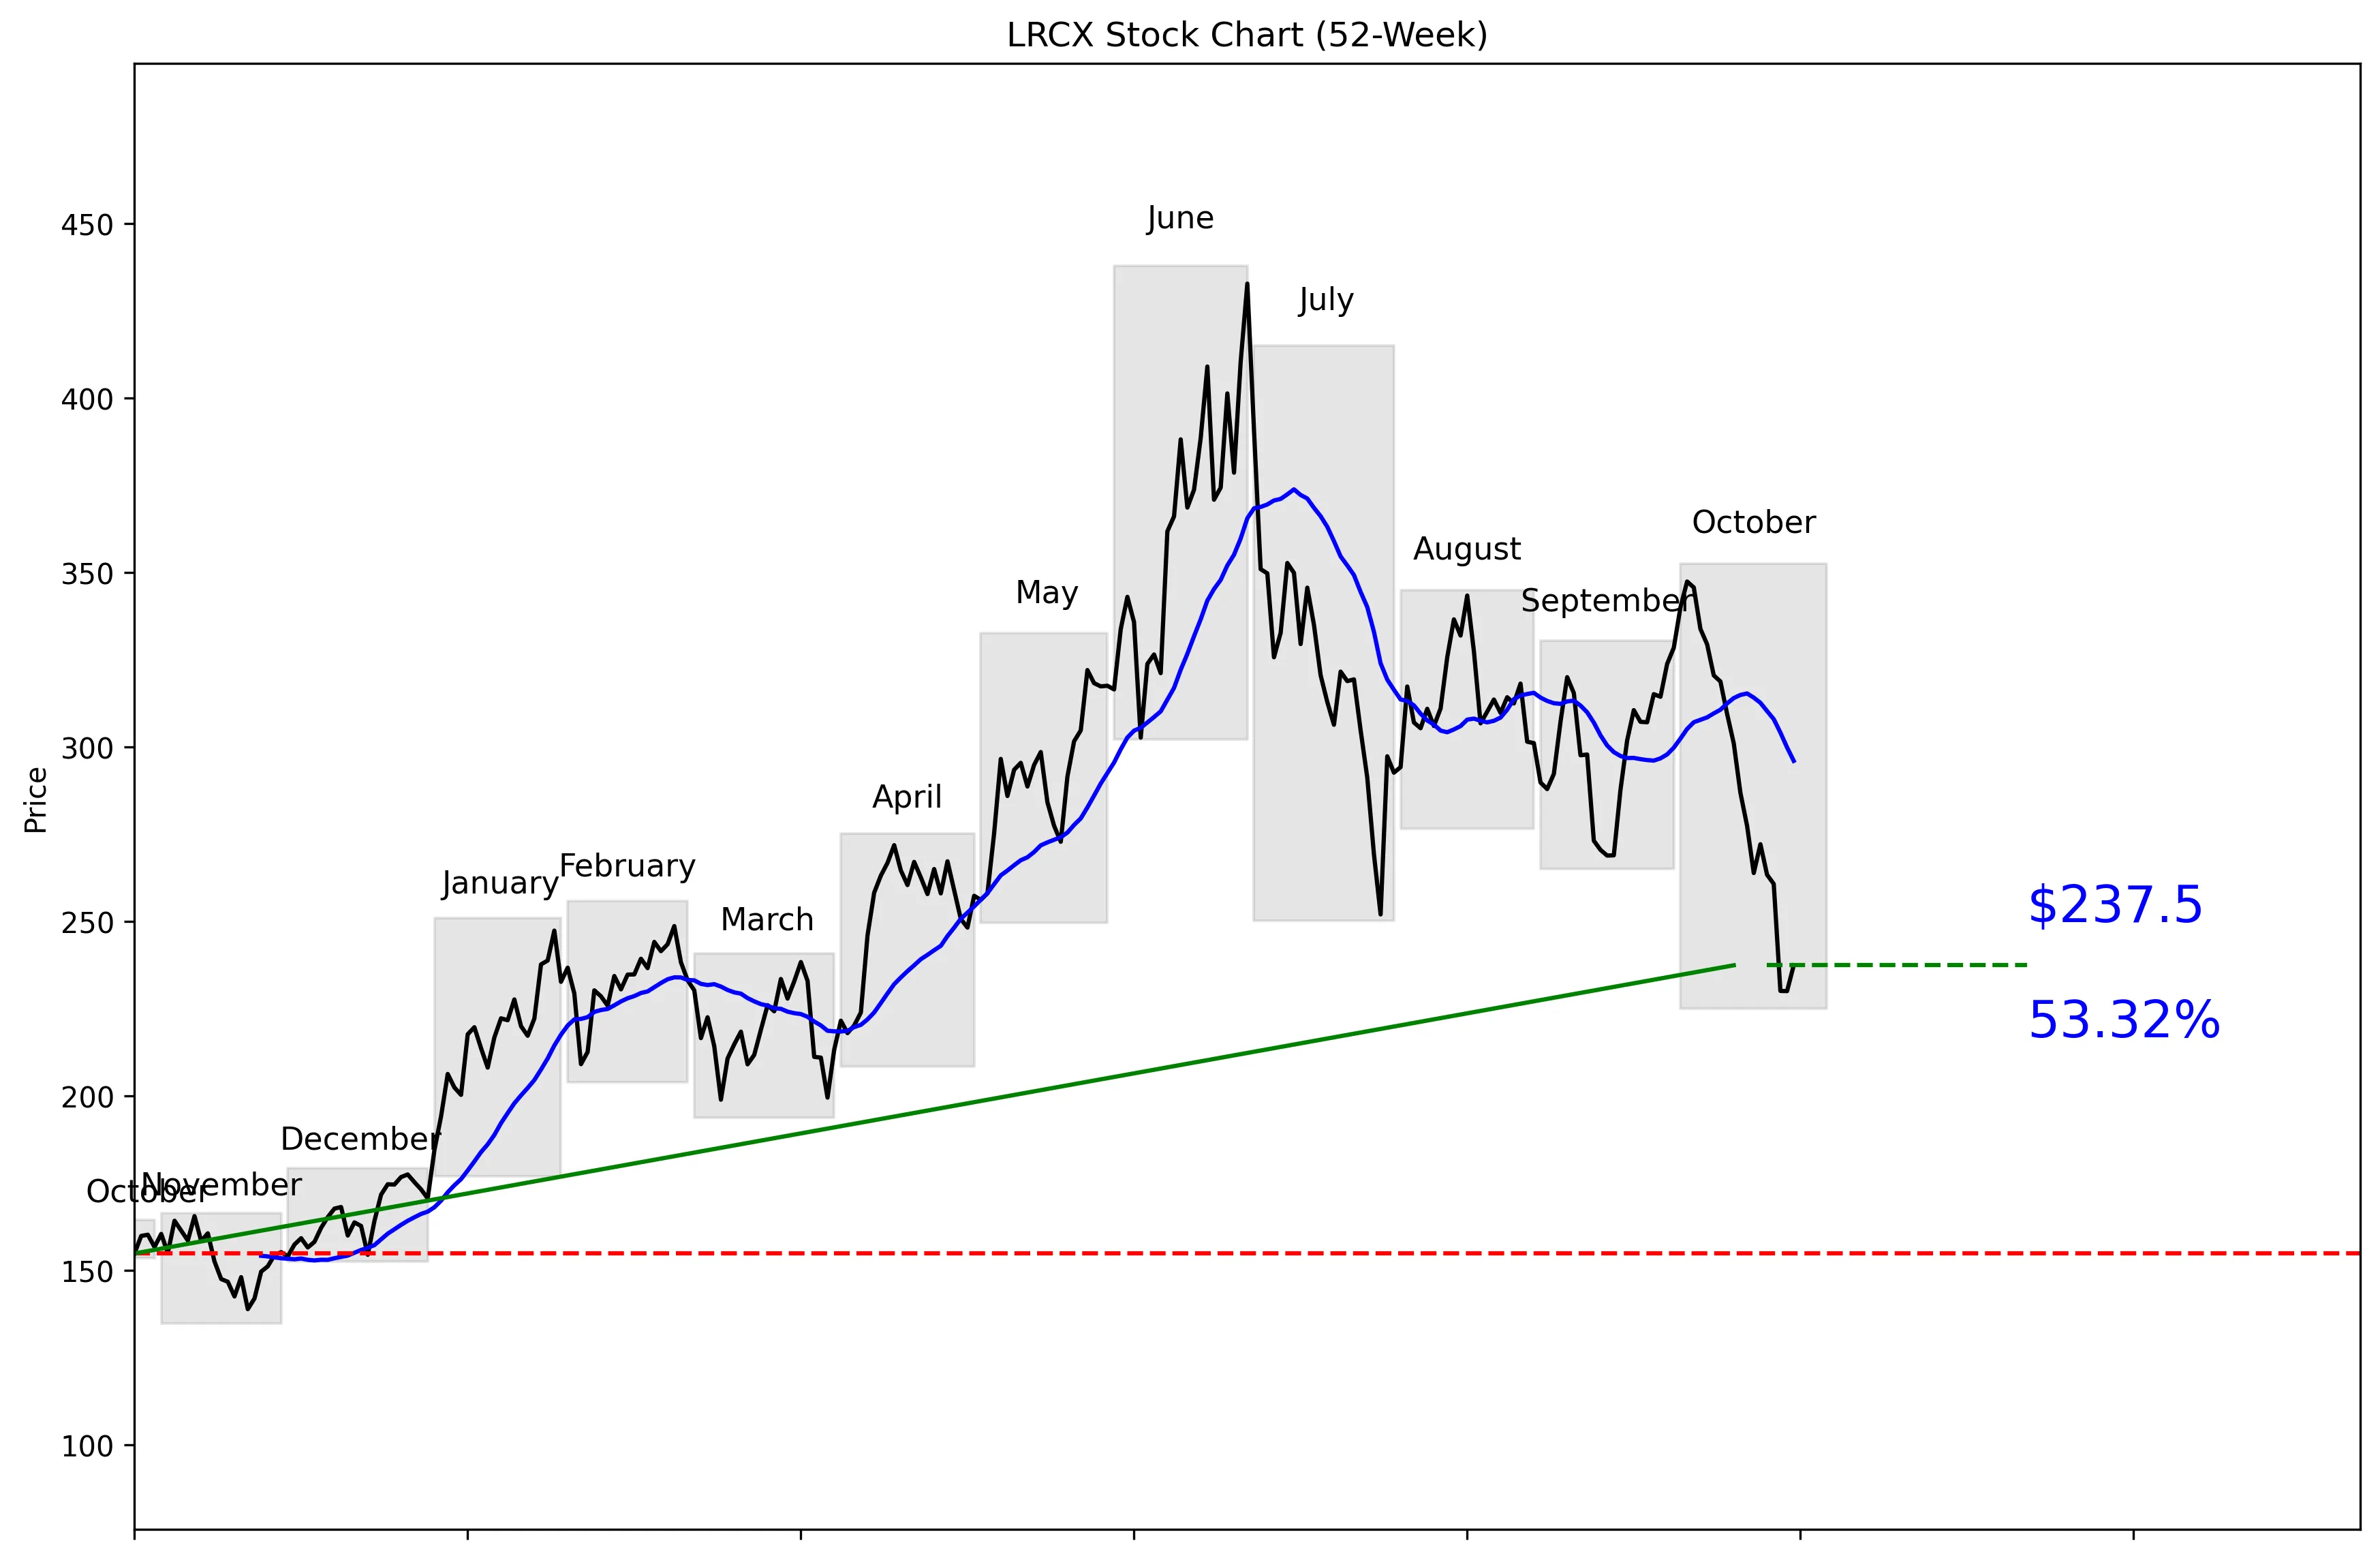
LRCX 52-Week Stock Chart
Technical Analysis
LRCX trades at $238.75, 34% of the way from its 52-week low of $134.88 to its 52-week high of $438.03. The stock is 45.78% below that high but remains 76.09% above the low. Momentum is firmly negative, with shares down 12.75% over five trading days and 24.48% over 20 trading days. The price is 19.79% below its 20-day moving average of $296.09, confirming that sellers control the near-term trend. Support sits at $230.10, while $347.49 is the near-term resistance level.


Recent News and Developments

Lam posts record $8.22 billion quarter

September-quarter revenue rose 22% sequentially to $8.22 billion, while non-GAAP EPS increased 21% to $2.20. Lam guided December-quarter revenue to $8.60 billion, plus or minus $400 million, with non-GAAP EPS of $2.33, plus or minus $0.15. Source: Lam Research Corporation

Analysts keep Buy ratings but cut price targets

Bernstein maintained its Buy rating on October 26 but cut its target from $385 to $350. UBS lowered its target from $425 to $400, while TD Cowen cut from $700 to $400; both retained Buy ratings. Source: Stock Analysis

LRCX plunges 11.8% despite earnings beat

Lam shares dropped 11.8% on October 22 after the midpoint of its quarterly profit forecast came in slightly below analyst expectations. The stock entered the session up 52.4% for the year, leaving no room for merely adequate guidance. Source: Associated Press


Market Sentiment and Analyst Recommendations

Bull Case
Revenue growth of 54.4% is the strongest reason to own LRCX. The latest quarter reinforced that growth story: revenue reached a record $8.22 billion, up 22% sequentially, while non-GAAP EPS increased 21% to $2.20. Management guided December-quarter revenue to $8.60 billion, plus or minus $400 million, and non-GAAP EPS to $2.33, plus or minus $0.15. The balance sheet is solid, with $7.44 billion in cash against $3.74 billion in debt. All 30 analysts behind the consensus recommendation rate the stock a strong buy, with a $364.03 average target and a range of $255.00 to $500.00. At $238.75, the stock trades below even the lowest listed analyst target of $255.00, creating a clear upside case if execution stays strong.
Bear Case
LRCX still carries a P/E of 35.58 despite falling 45.78% from its 52-week high. That valuation demands strong growth and leaves little room for guidance that merely meets expectations. The market proved that point on October 22, when shares dropped 11.8% after the midpoint of the quarterly profit forecast came in slightly below analyst expectations. The stock had entered that session up 52.4% for the year, making it vulnerable to a sharp reset. Analysts remain bullish, but Bernstein cut its target from $385 to $350, UBS reduced its target from $425 to $400, and TD Cowen cut from $700 to $400. Technical damage is also significant: LRCX is 19.79% below its 20-day moving average, with 20-day momentum at negative 24.48%. The CEO’s October 23 sale of 31,400 shares at $227.02 may pressure sentiment, although it occurred under a Rule 10b5-1 plan adopted on February 24, 2026.
What to Watch
The main operating test is whether December-quarter revenue lands within management’s $8.20 billion to $9.00 billion guidance range. Investors should also track whether non-GAAP EPS falls within the guided range of $2.18 to $2.48. Results near or above the $8.60 billion revenue midpoint and $2.33 EPS midpoint would support the growth thesis. A break below $230.10 would extend the technical damage, while a recovery above the $296.09 moving average would show that momentum is improving. The larger upside test is $347.49, the 30-day high and current near-term resistance. Watch for further analyst target cuts after Bernstein, UBS, and TD Cowen lowered their targets while keeping Buy ratings. The thesis strengthens if revenue growth remains close to 54.4% and weakens if growth slows while the P/E remains at 35.58.
Analyst Consensus
STRONG BUY

Based on 30 analyst opinions
Low Target
$255.00
Mean Target
$364.03
High Target
$500.00


Earnings and Financial Data

Sector
Technology
Industry
Semiconductor Equipment & Materials
Employees
24,300
Earnings & Dividends
Next Earnings
Oct 21, 2026
EPS (Trailing)
$6.71
Dividend Yield
57.0%
Payout Ratio
16.5%

Frequently Asked Questions

Is LRCX a good stock to buy?
LRCX has 54.4% revenue growth and a strong-buy recommendation from 30 analysts, but its P/E is 35.58 and momentum is negative. The takeaway is that the growth case is strong, but buyers are accepting meaningful valuation and technical risk.
What is LRCX’s price target?
The average analyst target is $364.03, with estimates ranging from $255.00 to $500.00. The takeaway is that every listed target is above the current $238.75 price.
How far is LRCX below its 52-week high?
LRCX is 45.78% below its 52-week high of $438.03. The takeaway is that the stock has suffered a major drawdown despite remaining 76.09% above its 52-week low.
What are LRCX’s support and resistance levels?
Near-term support is $230.10, based on the 30-day low, while near-term resistance is $347.49, based on the 30-day high. The takeaway is that LRCX is trading close to support and well below resistance.
Does LRCX pay a dividend?
The supplied data does not include a dividend amount or dividend yield. The takeaway is that no dividend conclusion can be made from the available figures.

Related Stock Reports

Disclaimer: This report is for informational purposes only and does not constitute financial advice. The analysis and opinions expressed are those of AltStation.io and should not be relied upon as the sole basis for investment decisions. Always conduct your own research and consult with a qualified financial advisor before making investment decisions. Past performance does not guarantee future results. Updated October 27, 2026.