ALTSTATION.IO

KLA Corporation (KLAC) Stock Analysis

By Nova Skye | AltStation.io | Updated September 19, 2026

Price
$181.98
Change
+2.73%
Market Cap
$237.80B
Avg Volume
12.2M

Company Overview

Headquartered in Milpitas, California, KLA Corporation operates in the semiconductor equipment and materials industry within the technology sector. In plain English, they build the high-precision inspection and metrology machines that catch microscopic defects during chip and circuit board manufacturing. Their portfolio covers wafer and reticle inspection systems, chemical process control equipment, plasma dicing tools, and semiconductor software. They sell these machines and service contracts directly to semiconductor and electronic device makers worldwide.

KLA is an established market leader in process control. Their operations are split into three segments: Semiconductor Process Control, Specialty Semiconductor Process, and PCB and Component Inspection. Their primary competitive edge is mission-critical utility: fabricators cannot produce advanced chips with acceptable yields without KLA’s defect analysis and metrology tools. The primary vulnerability is geographic exposure across major Asian markets like China, Taiwan, and Korea, where capital expenditure cycles can swing abruptly.

Incorporated in 1975 and rebranded from KLA-Tencor Corporation in July 2019, KLA is a mature, structural staple of the chip supply chain. They have broadened their revenue base by expanding from traditional wafer inspection into specialty semiconductor processes, packaging, and recurring service programs. With operations spanning North America, Europe, Israel, and Asia, the company moves in lockstep with global semiconductor manufacturing capacity. If modern chip designs keep getting smaller and more complex, KLA’s process control tools remain unavoidable for the entire industry.

Key Financials
Market Cap
$237.80B
Revenue
$13.58B
EBITDA
$6.05B
Gross Margin
61.3%
Profit Margin
35.6%
Revenue Growth
15.2%
Total Cash
$4.90B
Total Debt
$6.15B
Free Cash Flow
$2.62B


52-Week Price Performance Analysis

Price Statistics
P/E Ratio
49.59
Forward P/E
27.14
Beta
1.44
52-Week High
$307.37
52-Week Low
$95.50
EPS
$3.67
50-Day Avg
$200.17
200-Day Avg
$172.57
Price/Book
37.47
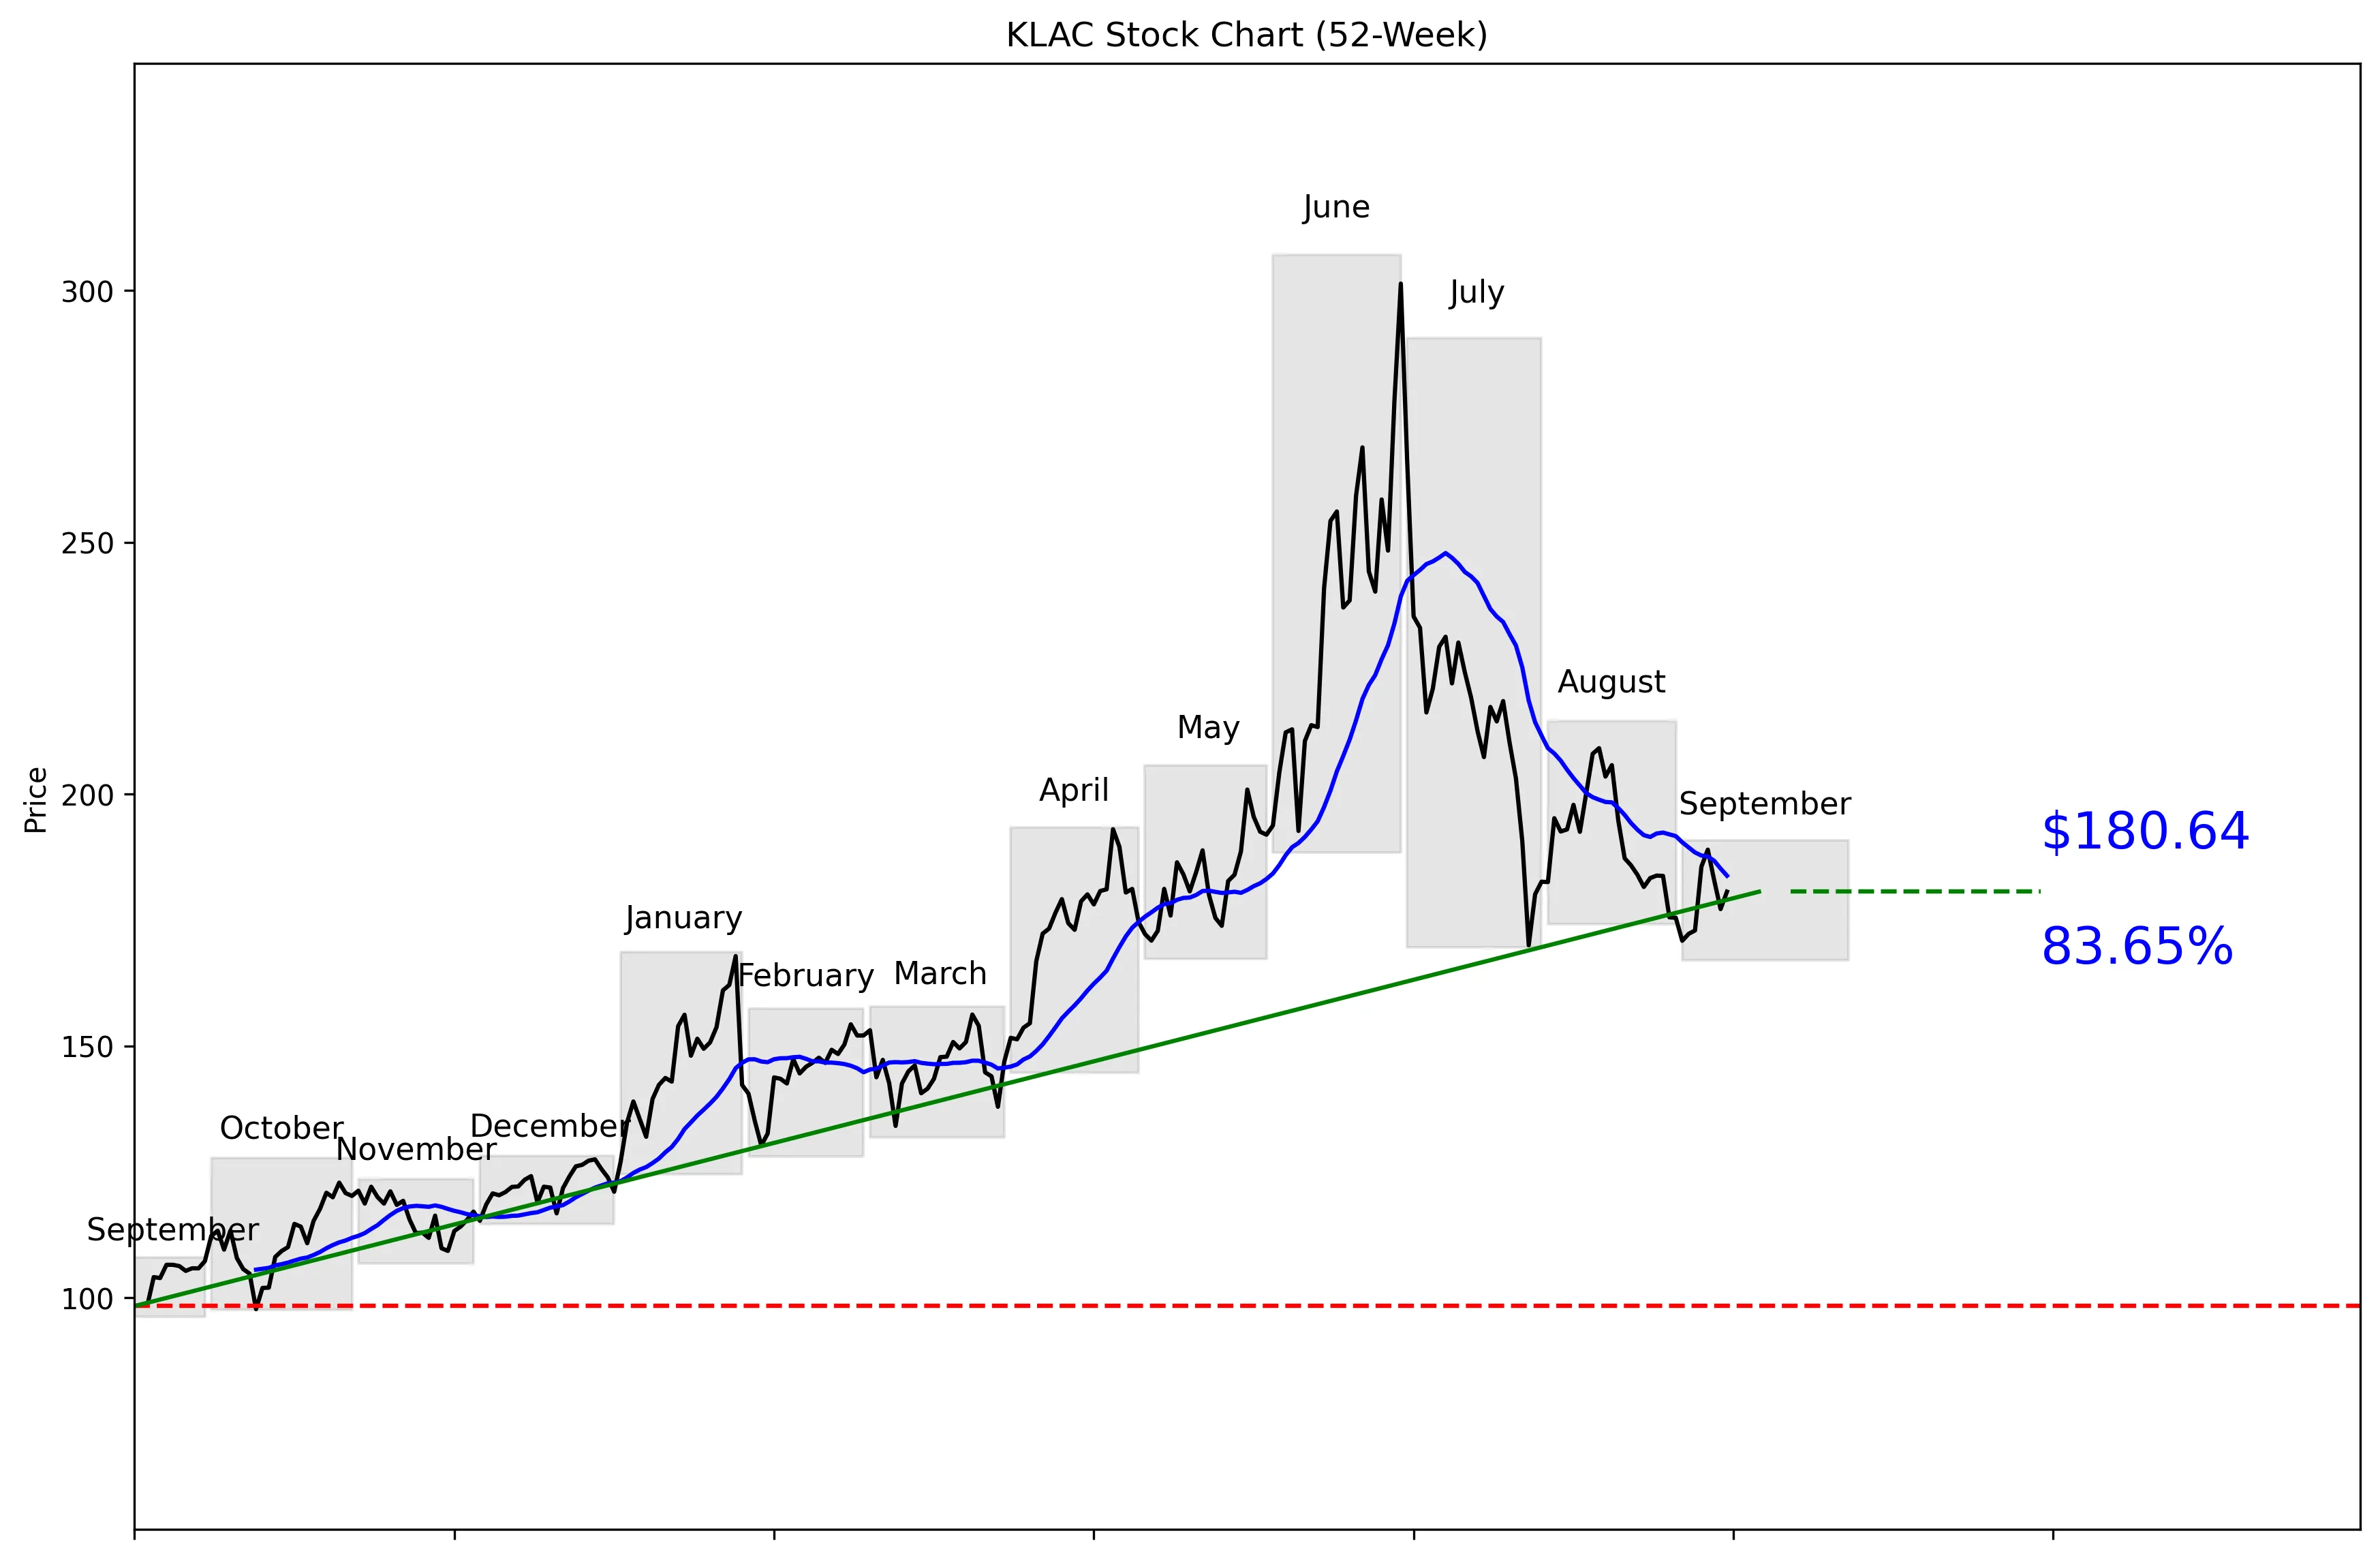
KLAC 52-Week Stock Chart
Technical Analysis
KLAC trades at $181.98, 40% of the way from its $96.18 52-week low to its $307.02 high. The stock is 41.16% below that high but remains 87.81% above the low. Price is 1.72% below the 20-day moving average of $183.80. Momentum improved 4.45% over the last five trading days, but the 20-day return remains negative at 13.62%. Near-term support is $170.89, while resistance sits at $209.13.


Recent News and Developments

KLA presents at Citi’s Global TMT Conference

KLA participated in Citi’s 2026 Global TMT Conference on September 9. The company provided an audio webcast but did not issue a new earnings release, product announcement, or regulatory update. Source: KLA Corporation

KLAC slides 3.13% to $177.18

KLAC closed at $177.18 on September 10, down 3.13% from $182.91. The decline followed a 3.21% drop on September 9, extending a sharp two-session reversal. Source: BestStocks

Management targets low-20% growth in 2026

CFO Bren Higgins said KLA expects total business growth in the low-20% range for 2026. He also said operating margin improved by more than 400 basis points across the past three years. Source: Seeking Alpha


Market Sentiment and Analyst Recommendations

Bull Case
Revenue grew 15.2% to $13.58 billion, showing that KLA still has meaningful operating momentum. Management expects total business growth in the low-20% range for 2026. The company also improved operating margin by more than 400 basis points over the past three years. Analysts remain positive, with a buy recommendation based on 26 analysts. Their average target is $233.77, comfortably above the current $181.98 price. The stock’s 41.16% decline from its 52-week high creates a more attractive entry point if management delivers on its growth target.
Bear Case
The P/E ratio of 49.59 leaves little room for weak growth or disappointing execution. Revenue growth of 15.2% is strong, but investors are already paying a premium multiple for it. Total debt of $6.15 billion exceeds total cash of $4.90 billion. Technical momentum is also weak, with the stock down 13.62% over the last 20 trading days and trading below its $183.80 moving average. KLAC fell 3.21% on September 9 and another 3.13% on September 10, showing how quickly sentiment can reverse. The core risk is straightforward: a high valuation combined with weakening price momentum can produce more downside even when the business remains healthy.
What to Watch
The first test is whether KLAC can hold the $170.89 near-term support level. A sustained move above the $183.80 20-day moving average would improve the short-term setup. The bigger technical hurdle is $209.13, the 30-day high and current resistance level. Investors should track whether management continues to support its low-20% growth target for 2026. Operating margin is another key metric after improving by more than 400 basis points over the past three years. KLA’s September 9 Citi conference appearance produced no new earnings, product, or regulatory update, so the next substantive company update needs to provide evidence that growth and margin momentum remain intact.
Analyst Consensus
BUY

Based on 26 analyst opinions
Low Target
$175.00
Mean Target
$233.77
High Target
$325.00


Earnings and Financial Data

Sector
Technology
Industry
Semiconductor Equipment & Materials
Employees
17,000
Earnings & Dividends
Next Earnings
Oct 28, 2026
EPS (Trailing)
$3.67
Dividend Yield
52.0%
Payout Ratio
21.9%

Frequently Asked Questions

Is KLAC a good stock to buy?
The analyst consensus is buy based on 26 analysts, and revenue is growing 15.2%. The takeaway is that the growth case is credible, but the 49.59 P/E makes execution critical.
What is KLAC’s price target?
The average analyst target is $233.77, with estimates ranging from $175.00 to $325.00. The takeaway is that analysts see upside on average, but their valuation range is wide.
Is KLAC stock overvalued?
KLAC trades at a P/E ratio of 49.59 with revenue growth of 15.2%. The takeaway is that the valuation is demanding relative to the supplied growth rate.
What are KLAC’s support and resistance levels?
Near-term support is $170.89, based on the 30-day low, and resistance is $209.13, based on the 30-day high. The takeaway is that these are the key technical levels to watch.
Does KLAC pay a dividend?
The supplied data does not include dividend information. The takeaway is that no dividend conclusion can be made from the available figures.

Related Stock Reports

Disclaimer: This report is for informational purposes only and does not constitute financial advice. The analysis and opinions expressed are those of AltStation.io and should not be relied upon as the sole basis for investment decisions. Always conduct your own research and consult with a qualified financial advisor before making investment decisions. Past performance does not guarantee future results. Updated September 19, 2026.