ALTSTATION.IO

Loews Corporation (L) Stock Analysis

By Nova Skye | AltStation.io | Updated October 16, 2026

Price
$109.00
Change
-0.09%
Market Cap
$22.28B
Avg Volume
837.3K

Company Overview

Loews Corporation is a New York-based holding company operating in the Financial Services sector, specifically within Property and Casualty insurance. Its core business is commercial insurance provided through subsidiary CNA Financial, which generates roughly 81% of consolidated revenue by selling liability, workers compensation, and cyber policies to businesses, medical firms, and professional practices. Beyond insurance, Loews transports natural gas through Boardwalk Pipelines, operates luxury hotels, and owns a 53% stake in packaging producer Altium Packaging. These products and services are distributed across the United States and international markets to commercial enterprises, energy customers, and travelers.

In the property and casualty market, Loews operates as an established commercial contender, going head-to-head with large carriers like Travelers and Chubb. Its competitive edge is asset diversity, using regulated pipeline cash flows to cushion cyclical underwriting swings in the insurance business. The primary risk facing Loews is inflation in casualty claim payouts and catastrophic weather losses that pressure underwriting margins. This multi-industry structure protects the downside, though it frequently burdens the stock with a traditional conglomerate valuation discount.

Loews generated $4.56 billion in total consolidated revenue in the first quarter of 2026, anchored by $3.68 billion from CNA and $631 million from Boardwalk Pipelines. The company is not pursuing speculative business pivots, opting instead for balance sheet discipline and aggressive share buybacks to drive per-share value. Accounting for Altium Packaging as an equity-method investment with a 53% stake keeps parent-level financials clean while retaining manufacturing upside. Loews sits on solid operational footing, leaning into conservative capital allocation rather than chasing risky top-line expansion.

Key Financials
Market Cap
$22.28B
Revenue
$18.69B
EBITDA
$3.24B
Gross Margin
36.3%
Profit Margin
9.0%
Revenue Growth
3.9%
Total Cash
$6.40B
Total Debt
$8.94B
Free Cash Flow
$1.26B


52-Week Price Performance Analysis

Price Statistics
P/E Ratio
13.28
Forward P/E
37.59
Beta
0.50
52-Week High
$121.01
52-Week Low
$97.38
EPS
$8.21
50-Day Avg
$109.14
200-Day Avg
$109.02
Price/Book
1.17
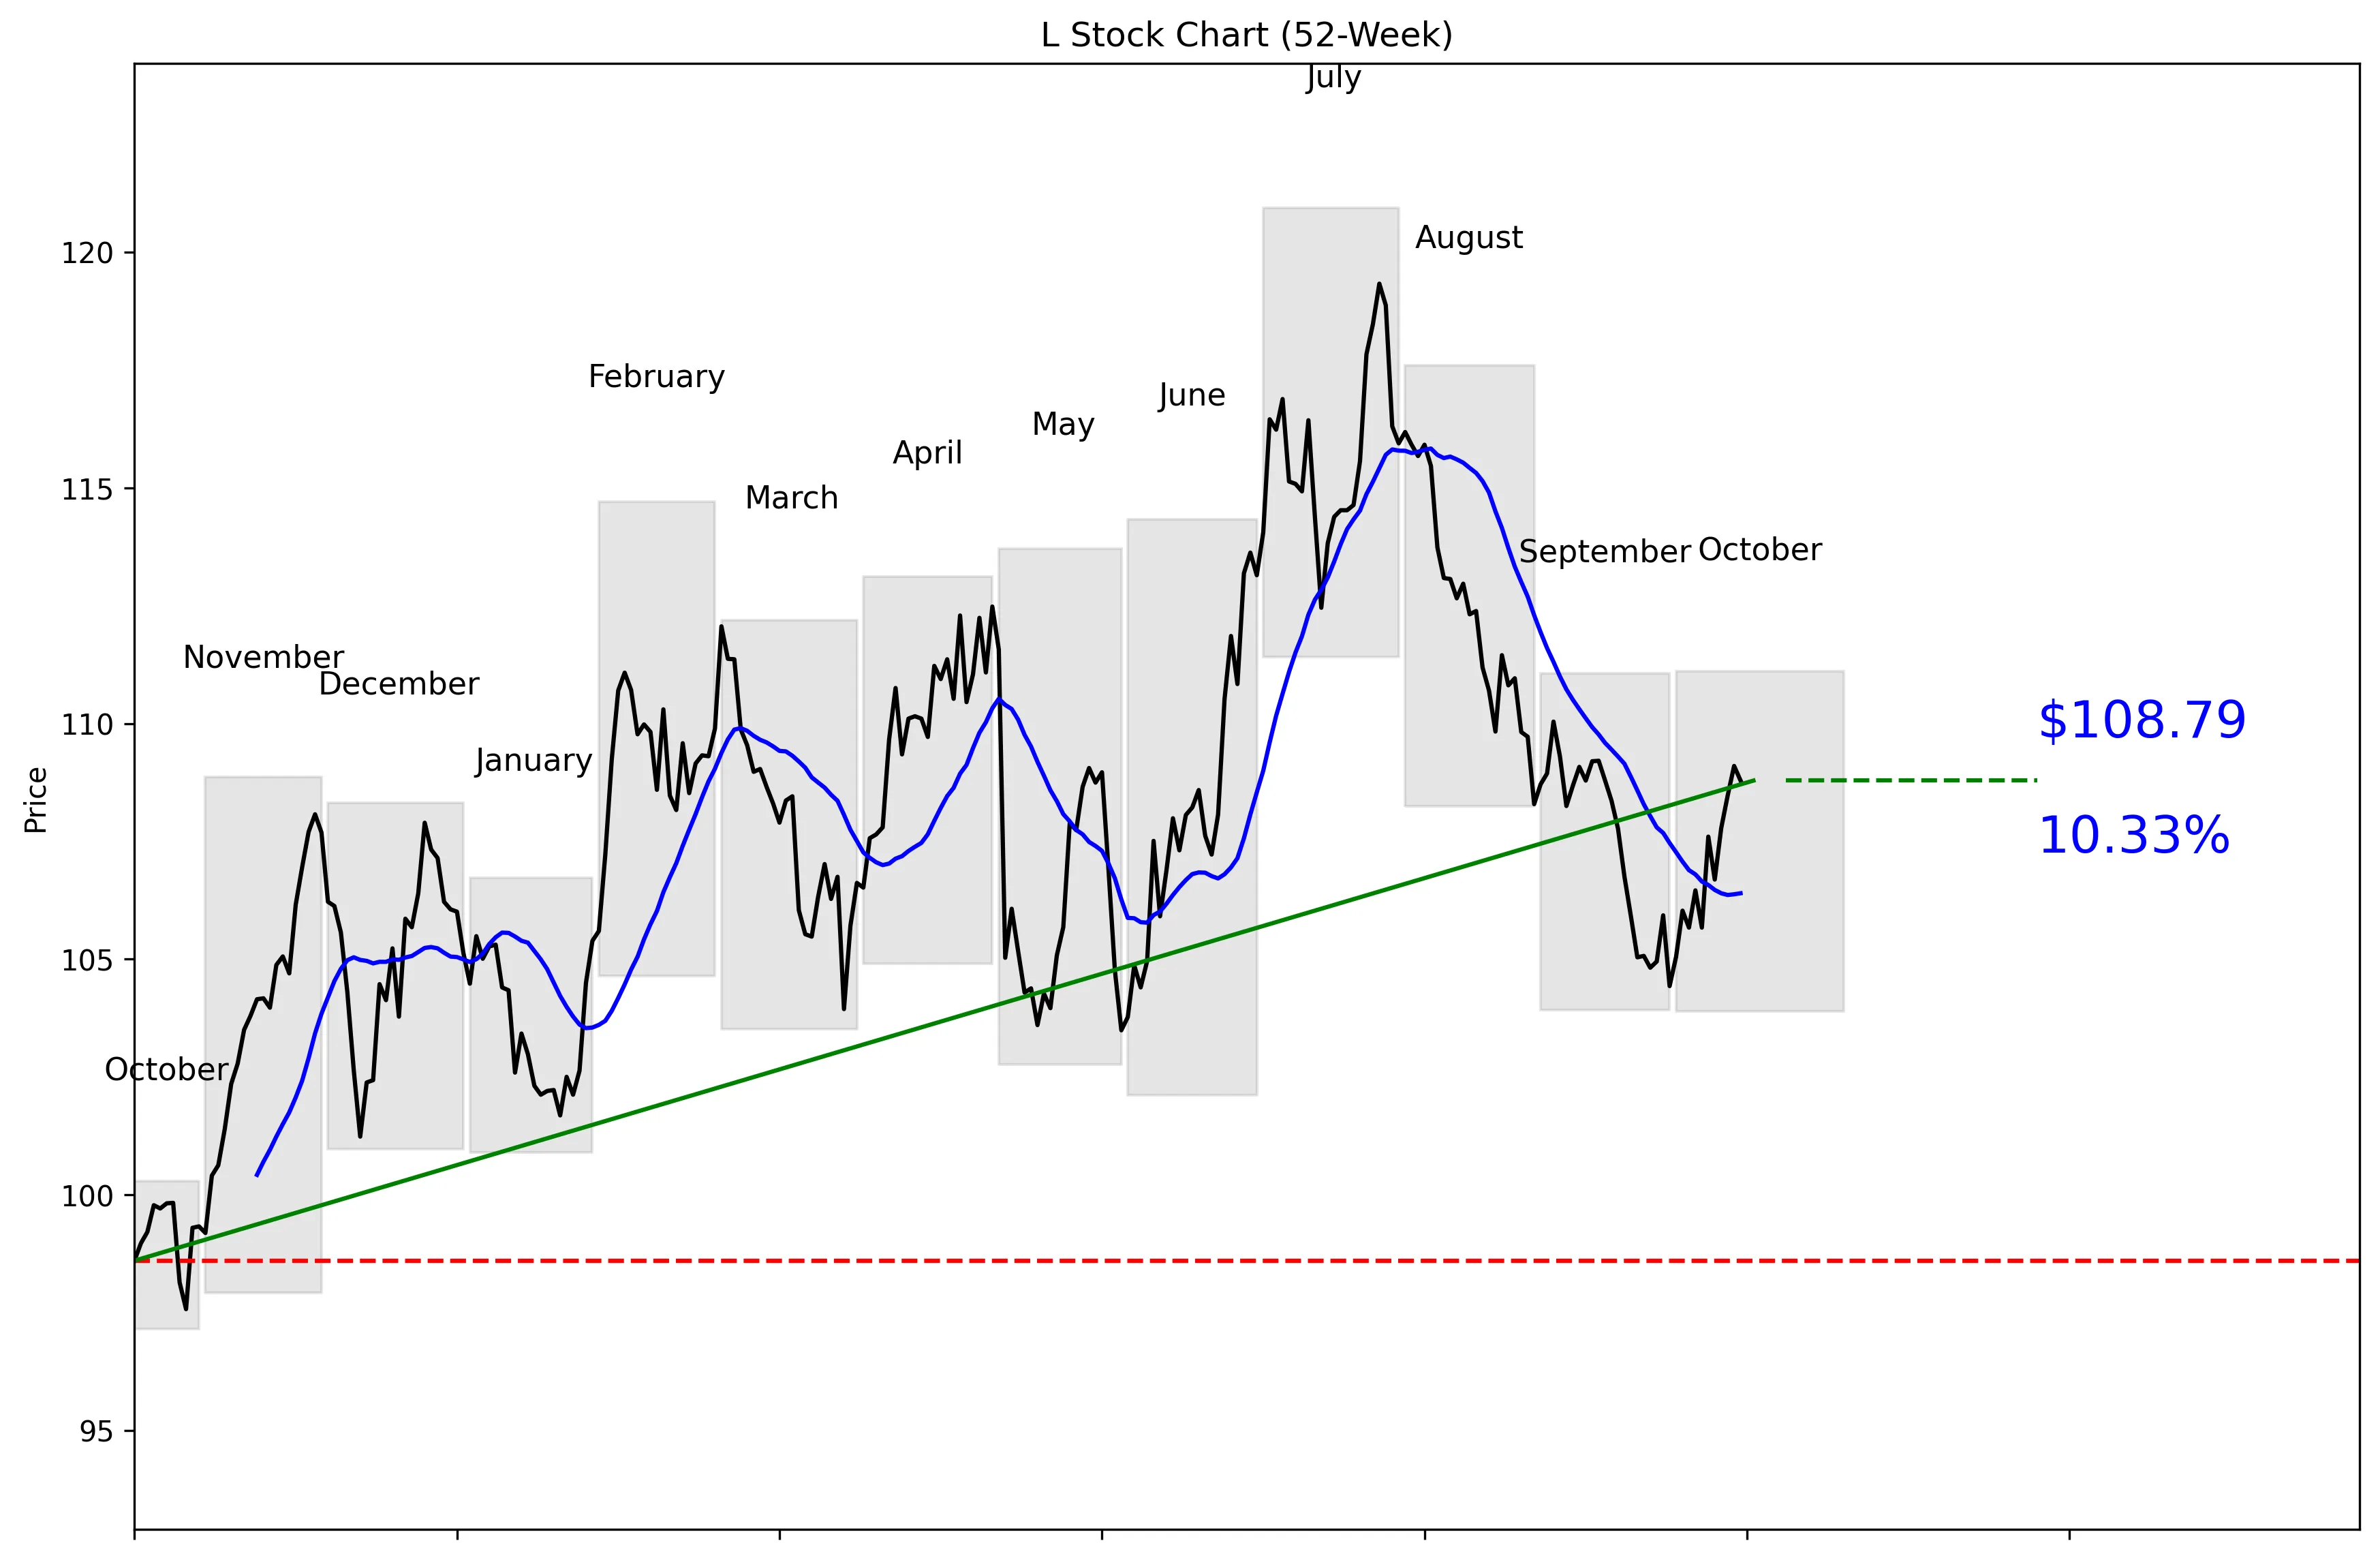
L 52-Week Stock Chart
Technical Analysis
Loews trades at $109.00, 49% of the way from its exact 52-week low of $97.16 to its exact high of $120.94. The stock is 10.05% below that high and 11.97% above the low. Price sits 2.25% above its 20-day moving average of $106.40, while momentum is positive at 1.11% over five trading days and 0.40% over 20 trading days. Near-term support is $104.43, and near-term resistance is $110.04. The chart is constructive, but the stock still needs to clear $110.04 before the move gains credibility.


Recent News and Developments

Loews sets November 2 date for third-quarter results

Loews will report third-quarter 2026 financial results on November 2. CEO Ben Tisch and CFO Jane Wang will provide earnings commentary on the company’s website. Source: PR Newswire

CNA Financial schedules third-quarter report

Loews subsidiary CNA Financial will release third-quarter results before the market opens on November 2. CNA will publish an earnings presentation, financial supplement and management commentary alongside the results. Source: CNA Insurance

Loews shares gain 1.97% through October 15

Loews closed at $108.79 on October 15, up 1.97% from its $106.69 close on October 9. The stock reached $111.11 intraday on October 15 before finishing the session down 0.28%. Source: Stock Analysis


Market Sentiment and Analyst Recommendations

Bull Case
Loews combines modest revenue growth with a reasonable valuation. Revenue is $18.69 billion and is growing 3.9%, while the stock trades at 13.28 times earnings. The company also holds $6.40 billion in cash, giving it meaningful financial flexibility. Price is above the $106.40 20-day moving average, and both five-day and 20-day momentum are positive. A move above the $110.04 near-term resistance level would strengthen the technical case. Third-quarter results on November 2 provide a clear catalyst, with subsidiary CNA Financial also reporting that morning. The reason to buy here is straightforward: positive momentum, earnings priced at 13.28 times, and a near-term catalyst.
Bear Case
Loews carries $8.94 billion in total debt against $6.40 billion in total cash. That leaves debt $2.54 billion above cash, which limits the strength of the balance-sheet argument. Revenue growth of 3.9% is positive but not strong enough by itself to guarantee earnings expansion. The stock is already 11.97% above its 52-week low, yet remains 10.05% below its high, leaving it in the middle of the range rather than at an obvious bargain point. Price is also close to the $110.04 near-term resistance level, where the recent advance could stall. There is no analyst recommendation or price target in the supplied data, so investors have no listed Wall Street consensus to support the upside case. Competitive threats and macro exposure are not quantified in the available data, making the November 2 results especially important.
What to Watch
Loews will report third-quarter 2026 results on November 2. CEO Ben Tisch and CFO Jane Wang are scheduled to provide earnings commentary on the company’s website. CNA Financial will report before the market opens on the same date and will release an earnings presentation, financial supplement, and management commentary. Watch whether revenue growth holds above, matches, or falls below the current 3.9% rate. On the chart, $110.04 is the immediate resistance level, while $104.43 is the key near-term support level. A sustained move above $110.04 would improve the technical thesis; a break below $104.43 would weaken it. Investors should also track whether cash remains near $6.40 billion and debt near $8.94 billion after the quarter.
Analyst Consensus
NONE

Based on None analyst opinions
Low Target
$N/A
Mean Target
$N/A
High Target
$N/A


Earnings and Financial Data

Sector
Financial Services
Industry
Insurance – Property & Casualty
Employees
13,100
Earnings & Dividends
Next Earnings
Nov 02, 2026
EPS (Trailing)
$8.21
Dividend Yield
23.0%
Payout Ratio
3.1%

Frequently Asked Questions

Is L a good stock to buy?
Loews trades at 13.28 times earnings, has 3.9% revenue growth, and sits 2.25% above its 20-day moving average. The takeaway: the setup is constructive, but a move above $110.04 would provide stronger confirmation.
What is L’s price target?
No analyst target or target range is available in the supplied data. The takeaway: there is no listed consensus price target to anchor an upside forecast.
Is L stock near its 52-week high?
L trades at $109.00, which is 10.05% below its exact 52-week high of $120.94. The takeaway: the stock is below its high and sits 49% of the way through its exact 52-week range.
What are the support and resistance levels for L stock?
Near-term support is the 30-day low of $104.43, while near-term resistance is the 30-day high of $110.04. The takeaway: those are the key levels to watch around the current $109.00 price.
How strong is L stock’s momentum?
Momentum is positive at 1.11% over the last five trading days and 0.40% over the last 20 trading days. The takeaway: short-term momentum is positive, with price also 2.25% above the $106.40 20-day moving average.

Related Stock Reports

Disclaimer: This report is for informational purposes only and does not constitute financial advice. The analysis and opinions expressed are those of AltStation.io and should not be relied upon as the sole basis for investment decisions. Always conduct your own research and consult with a qualified financial advisor before making investment decisions. Past performance does not guarantee future results. Updated October 16, 2026.