ALTSTATION.IO

Masco Corporation (MAS) Stock Analysis

By Nova Skye | AltStation.io | Updated September 19, 2026

Price
$72.70
Change
+1.79%
Market Cap
$14.34B
Avg Volume
2.4M

Company Overview

Masco Corporation operates in the Industrials sector under the Building Products and Equipment industry, with headquarters in Livonia, Michigan. Incorporated in 1929, the company manufactures and sells home improvement products across North America, Europe, and international markets. The business runs through two main divisions: Plumbing Products, which sells faucets, showerheads, spas, and piping, and Decorative Architectural Products, which sells paints, primers, stains, and hardware. Their customer base spans DIY consumers, professional plumbers, building contractors, and homebuilders through home centers, online retailers, and wholesale distributors.

Masco operates as an established market leader backed by major brand names like Delta, Hansgrohe, Behr, and Kilz. Their clear competitive edge comes from massive shelf space in high-volume home centers and long-standing trust among trade professionals. The primary threat to their model is the cyclical nature of building products, since demand depends heavily on residential construction and home remodeling activity. When housing turnover and consumer repair spending slow down, order volumes across both retail and wholesale channels take an immediate hit.

Masco keeps its business model focused by directing capital exclusively into two core building categories. The Plumbing Products segment spans mass-market fixtures like Peerless, luxury lines like Brizo and Axor, and specialty wellness products like Hot Spring spas. Meanwhile, the Decorative Architectural segment uses flagship lines like Behr paint and Kilz primer to generate steady demand from routine home maintenance and repainting jobs. By focusing strictly on residential plumbing and surface coatings, Masco positions itself squarely around recurring repair and replacement demand.

Key Financials
Market Cap
$14.34B
Revenue
$7.62B
EBITDA
$1.51B
Gross Margin
37.2%
Profit Margin
11.6%
Revenue Growth
-2.9%
Total Cash
$548.00M
Total Debt
$3.49B
Free Cash Flow
$897.12M


52-Week Price Performance Analysis

Price Statistics
P/E Ratio
16.75
Forward P/E
15.60
Beta
1.29
52-Week High
$83.64
52-Week Low
$58.16
EPS
$4.34
50-Day Avg
$76.09
200-Day Avg
$69.60
Price/Book
-39.28
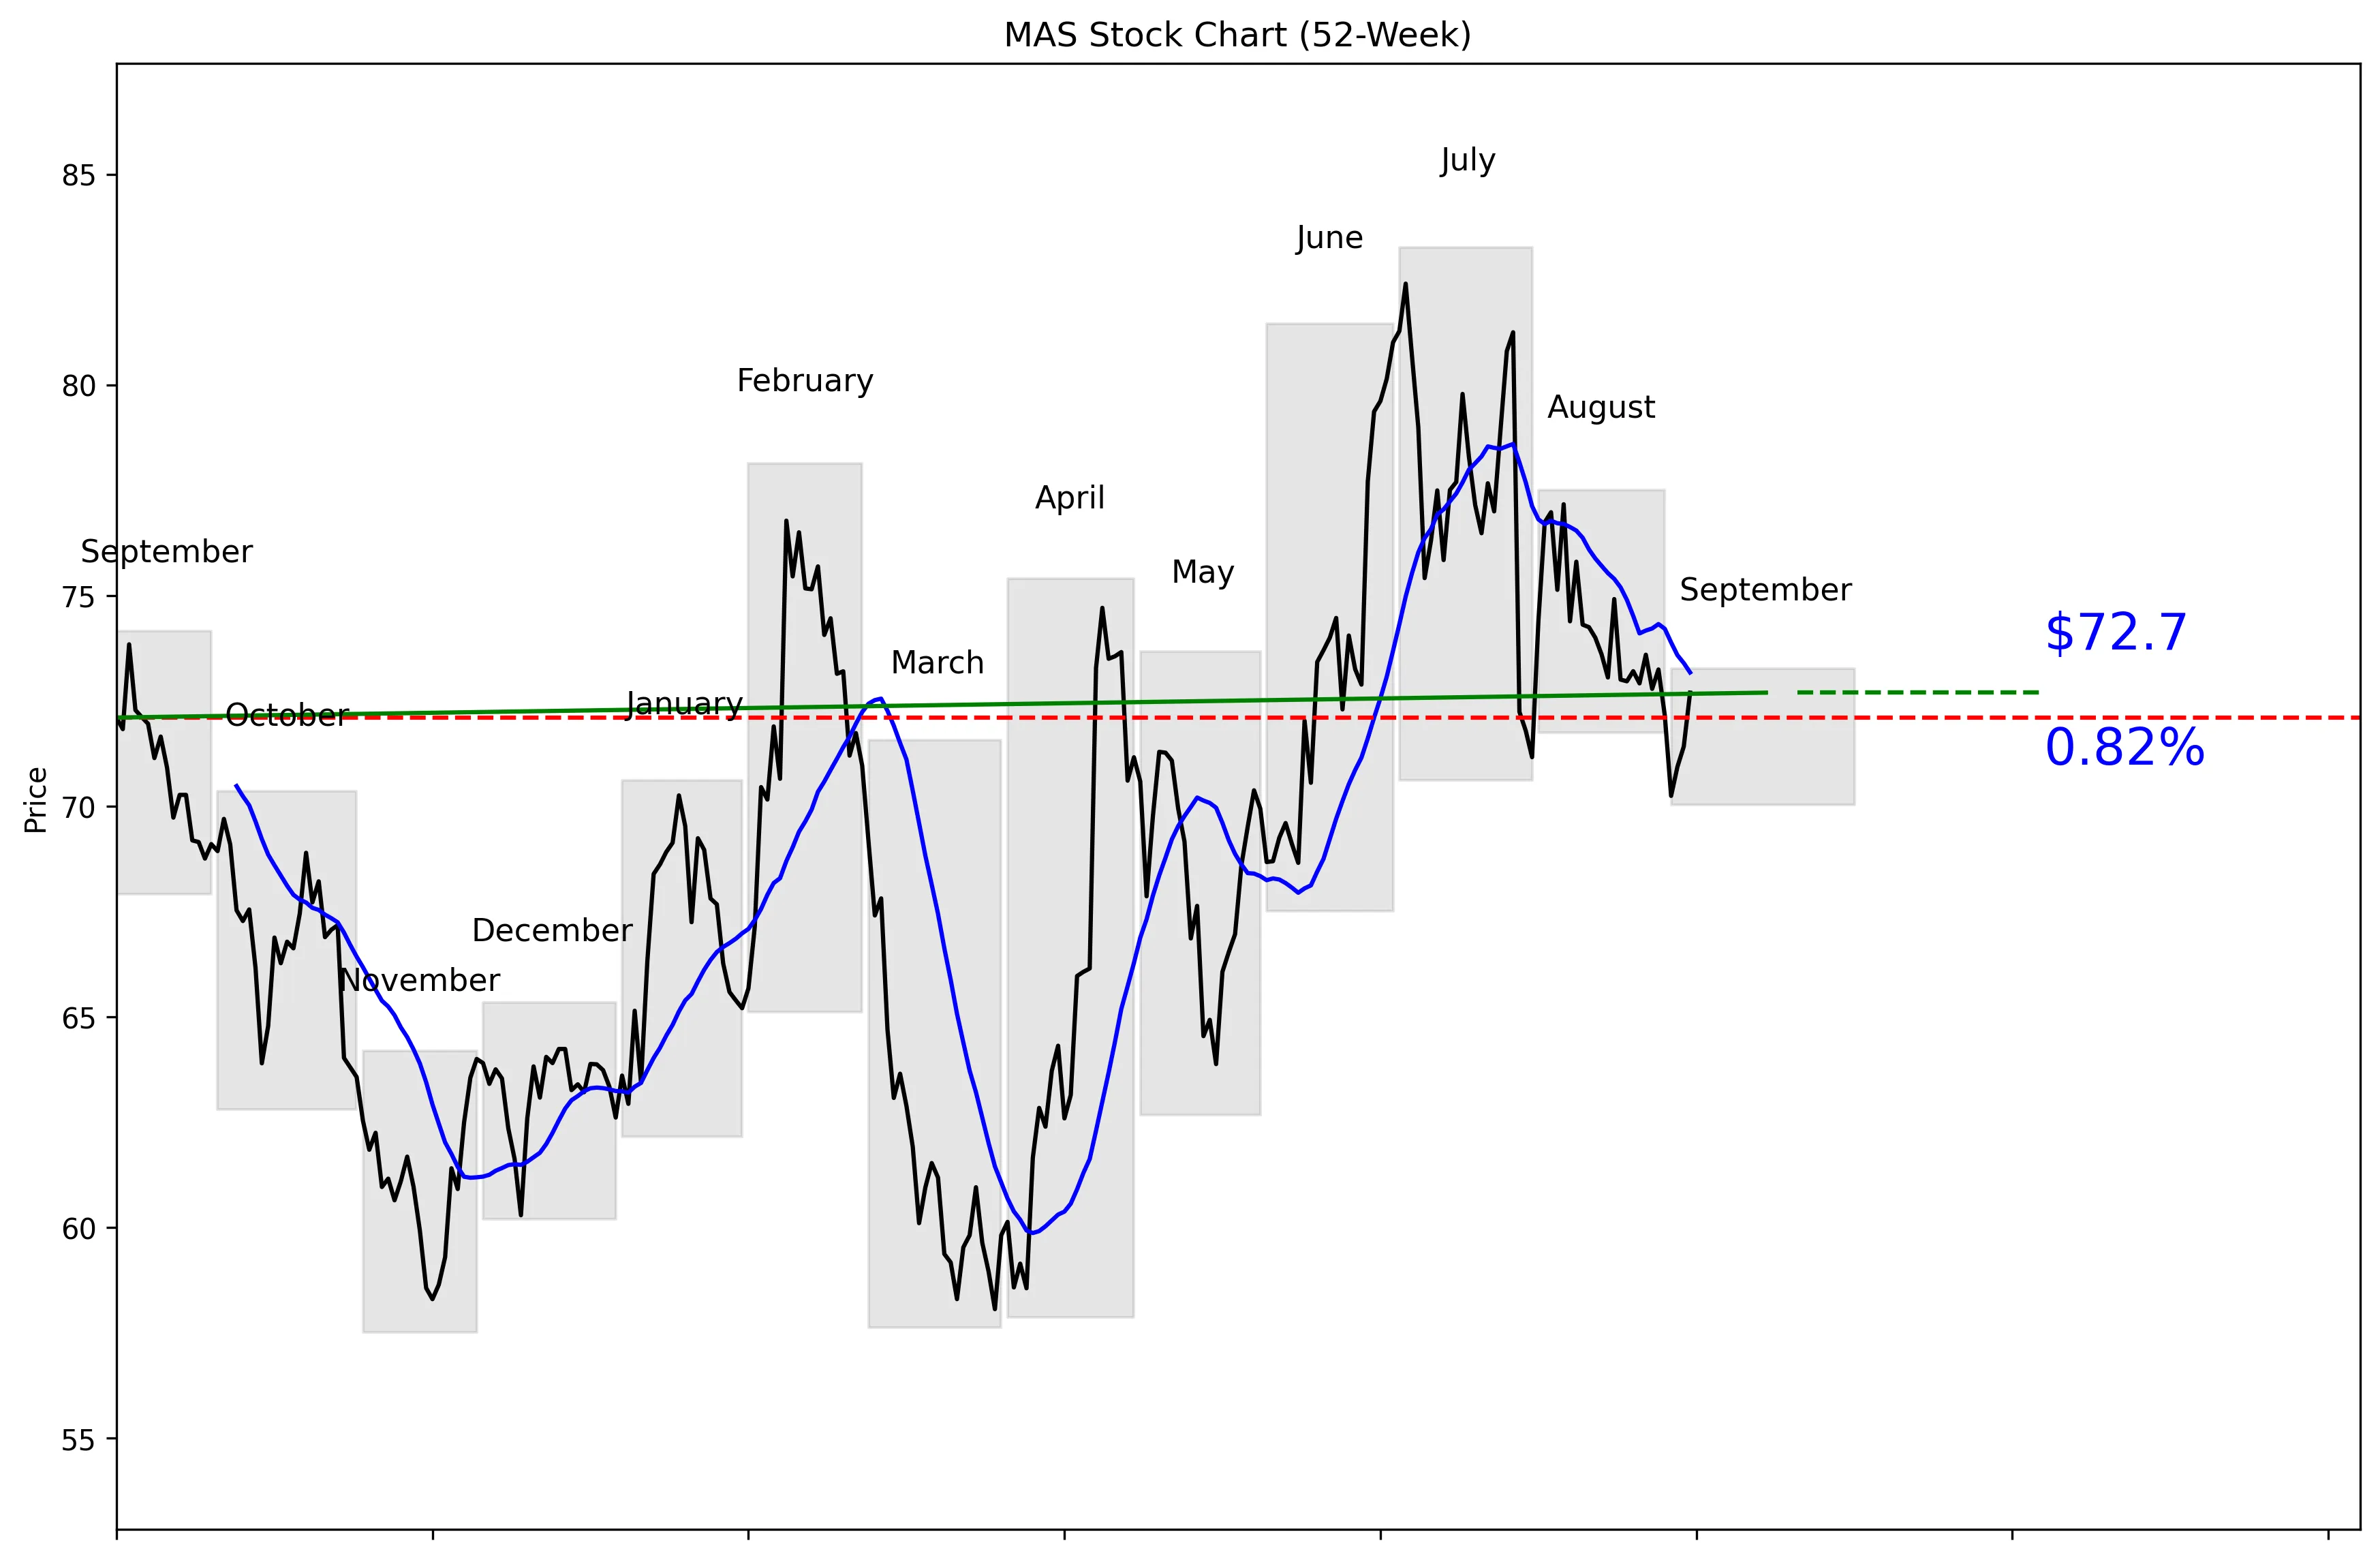
MAS 52-Week Stock Chart
Technical Analysis
MAS trades at $72.70, 59% of the way from its technical 52-week low of $57.51 to its high of $83.27. The stock is 12.70% below that high and 26.41% above the low. Price sits 0.65% below the 20-day moving average of $73.18. Momentum is negative, with declines of 0.75% over five trading days and 5.79% over 20 trading days. Near-term support is $70.25, while resistance sits at $81.25.


Recent News and Developments

No notable company-specific news this week

Searches covering the past seven days found no new Masco earnings, analyst actions, product launches, regulatory developments, or other material company-specific announcements. Recent search results referenced older developments rather than new events.

Latest Developments

Check back for the latest news and updates.

Latest Developments

Check back for the latest news and updates.


Market Sentiment and Analyst Recommendations

Bull Case
MAS trades at 16.75 times earnings, which is a reasonable valuation if revenue growth stabilizes. The analyst recommendation is buy based on 18 analysts. Their average target of $80.61 represents 10.88% upside from $72.70. The high target of $96.00 implies 32.05% upside, showing that some analysts see a much stronger recovery case. Revenue remains substantial at $7.62 billion against a market capitalization of $14.34 billion. The stock is also 12.70% below its technical 52-week high, giving buyers room for upside without requiring a new high.
Bear Case
Revenue growth is negative at 2.9%, and that is the clearest fundamental problem. The company carries $3.49 billion in total debt against only $548 million in cash. Debt is more than six times cash, limiting balance-sheet flexibility. Short-term price action is weak, with MAS down 5.79% over 20 trading days and trading below its $73.18 moving average. The lowest analyst target is $68.00, which is 6.46% below the current price. A break under $70.25 support would confirm that sellers still control the near-term trend.
What to Watch
The first test is whether MAS can recover its 20-day moving average at $73.18. A move through $81.25 resistance would improve the technical setup and put the $83.27 technical 52-week high back in focus. A drop below $70.25 support would weaken the chart, with the $57.51 technical 52-week low marking the bottom of the broader range. Investors should track whether revenue growth improves from the current negative 2.9% rate. Cash of $548 million and debt of $3.49 billion should also be monitored for evidence that the balance-sheet gap is narrowing or widening. No company-specific earnings date, product launch, analyst action, or other material catalyst was provided for the next quarter.
Analyst Consensus
BUY

Based on 18 analyst opinions
Low Target
$68.00
Mean Target
$80.61
High Target
$96.00


Earnings and Financial Data

Sector
Industrials
Industry
Building Products & Equipment
Employees
18,000
Earnings & Dividends
Next Earnings
Oct 29, 2026
EPS (Trailing)
$4.34
Dividend Yield
176.0%
Payout Ratio
29.0%

Frequently Asked Questions

Is MAS a good stock to buy?
MAS carries a buy recommendation from 18 analysts, and the average analyst target is above the current price. Takeaway: The analyst view is bullish, but negative 2.9% revenue growth keeps the thesis from being clean.
What is the MAS stock price target?
The average analyst target is $80.61, with estimates ranging from $68.00 to $96.00. Takeaway: The average target offers 10.88% upside from $72.70.
Is MAS stock overvalued?
MAS trades at a P/E ratio of 16.75 and has a market capitalization of $14.34 billion. Takeaway: The valuation is not enough by itself to offset concern about negative revenue growth.
What are the key support and resistance levels for MAS?
Near-term support is $70.25, and near-term resistance is $81.25. Takeaway: Those are the clearest thresholds for judging the stock’s next move.
Does MAS pay a dividend?
The provided data does not include dividend information, so a dividend payment or yield cannot be confirmed. Takeaway: Investors should verify the current dividend before using income as part of the MAS thesis.

Related Stock Reports

Disclaimer: This report is for informational purposes only and does not constitute financial advice. The analysis and opinions expressed are those of AltStation.io and should not be relied upon as the sole basis for investment decisions. Always conduct your own research and consult with a qualified financial advisor before making investment decisions. Past performance does not guarantee future results. Updated September 19, 2026.