ALTSTATION.IO

The Walt Disney Company (DIS) Stock Analysis

By Nova Skye | AltStation.io | Updated October 10, 2026

Price
$107.75
Change
+0.69%
Market Cap
$186.06B
Avg Volume
9.4M

Company Overview

The Walt Disney Company is a media heavyweight in the Communication Services sector, classified under Entertainment and headquartered in Burbank, California. Founded in 1923, the company generates revenue across three primary operating segments: Entertainment, Sports, and Experiences. It sells theatrical releases, linear television programming, and direct-to-consumer streaming subscriptions through platforms like Disney+, Hulu, and ESPN+ to millions of consumers globally. The company further monetizes its portfolio through theme parks, resorts, cruise lines, and retail merchandise licensing across the Americas, Europe, and the Asia Pacific.

Disney stands as a dominant market leader in entertainment, armed with an intellectual property moat featuring Marvel, Lucasfilm, Pixar, and 20th Century Studios. Its primary competitive advantage is a multi-channel flywheel that converts box office characters directly into streaming viewers, theme park visitors, and licensed consumer goods. The primary threat to this model is the structural decline of linear broadcast and cable channels, including ABC and FX, as audiences migrate away from traditional pay-TV bundles. Live sports anchored by ESPN remains a powerful customer retention driver, but maintaining rights against entertainment and streaming competitors requires disciplined capital management.

Disney is currently executing a strategic pivot focused on driving streaming profitability while expanding its high-margin physical experiences. The company operates through Entertainment, Sports, and Experiences to cleanly separate its digital content engines from its physical resort and cruise lines. Ongoing investments in Disney Cruise Line and domestic and international theme park capacity provide steady operating cash flow to support digital transformation. Disney’s long-term performance rests entirely on scaling direct-to-consumer platforms like Disney+, Hulu, and ESPN+ quickly enough to replace vanishing cable distribution income.

Key Financials
Market Cap
$186.06B
Revenue
$98.86B
EBITDA
$20.96B
Gross Margin
37.6%
Profit Margin
8.7%
Revenue Growth
6.8%
Total Cash
$5.18B
Total Debt
$46.04B
Free Cash Flow
$4.86B


52-Week Price Performance Analysis

Price Statistics
P/E Ratio
22.22
Forward P/E
14.42
Beta
1.42
52-Week High
$117.09
52-Week Low
$92.19
EPS
$4.85
50-Day Avg
$104.91
200-Day Avg
$103.72
Price/Book
1.69
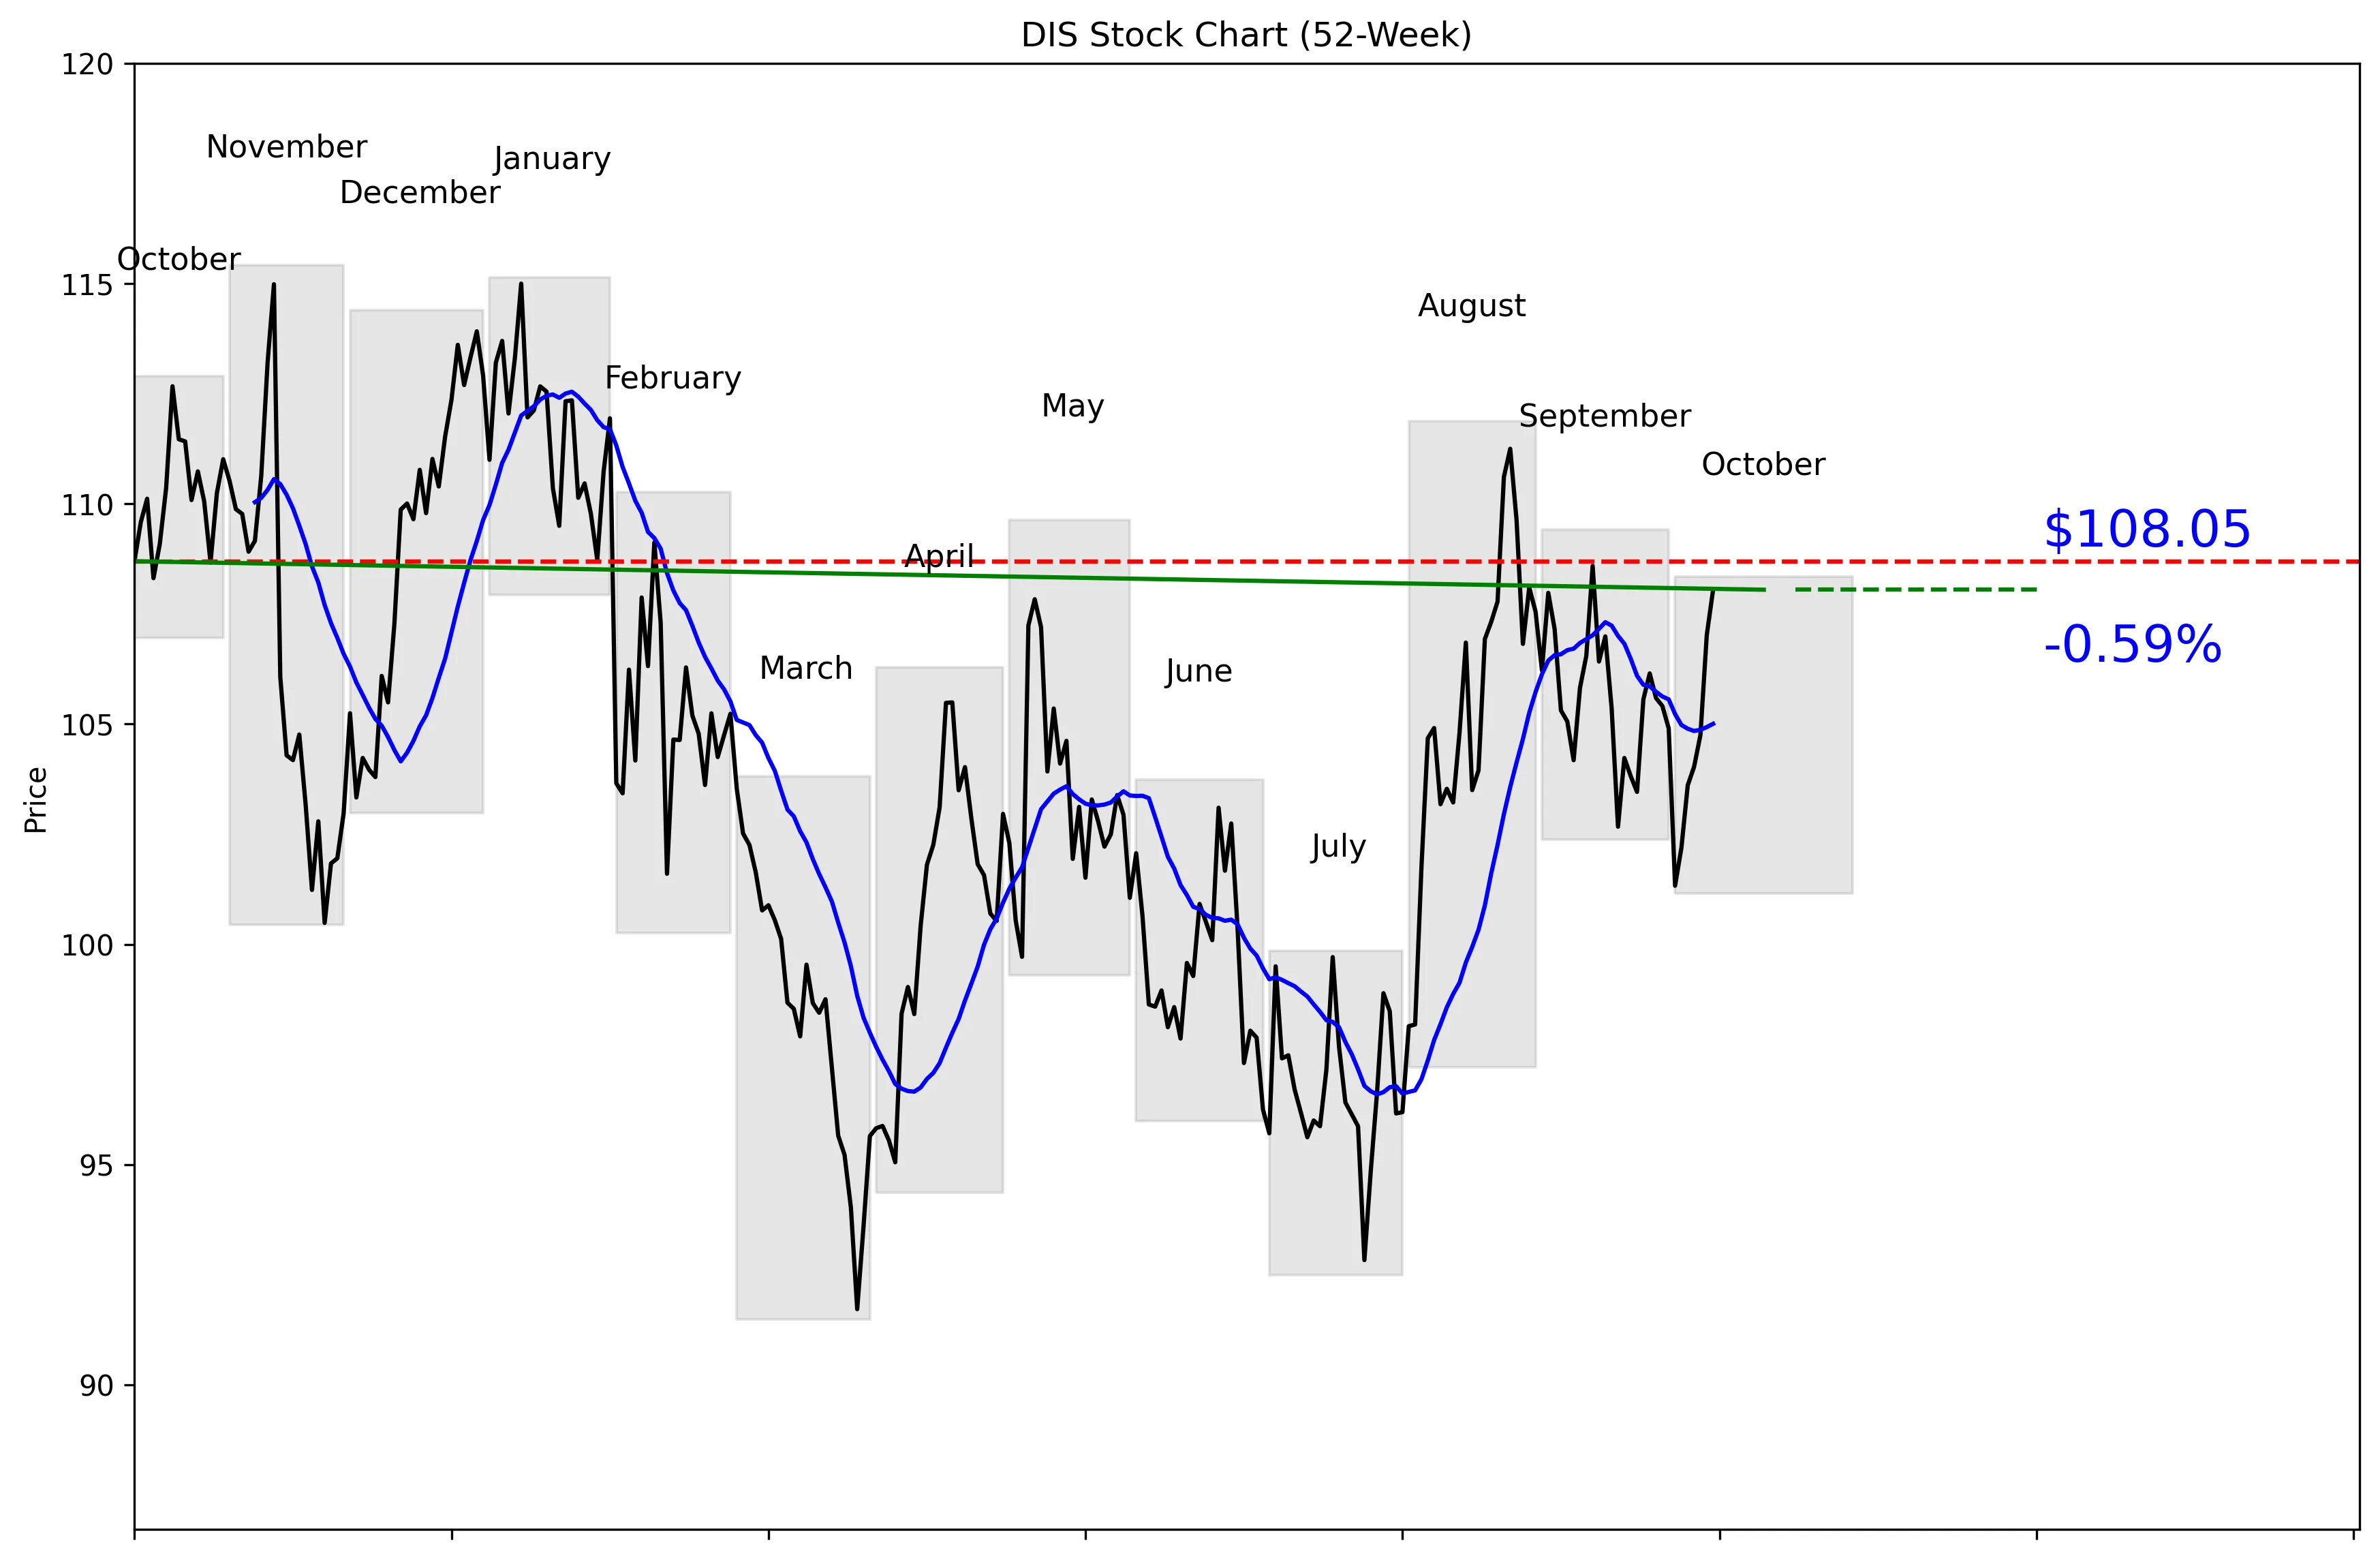
DIS 52-Week Stock Chart
Technical Analysis
DIS trades at $107.75, 69% of the way from its exact 52-week low of $91.49 to its exact 52-week high of $115.42. The stock is 6.38% below that high and 18.10% above the low. Price sits 2.90% above the 20-day moving average of $105.01, while momentum is 5.73% over five trading days and 1.41% over 20 trading days. Near-term resistance is $108.59, just above the current price, while the 30-day low of $101.33 is the clearest near-term support.


Recent News and Developments

DIS gains 5.7% in five trading sessions

Disney shares climbed from $102.19 on October 2 to $108.05 on October 9, posting gains in every session during the week. The strongest move came October 8, when DIS rose 2.17% on volume of 13,028,966 shares. Source: Stock Analysis

Wall Street stays bullish on Disney

Needham reiterated its Buy rating and $125 target on October 9, while Yorkville Ives initiated coverage with the same rating and target on October 7. Barclays maintained Buy with a $115 target, while Raymond James kept its Buy rating but trimmed its target from $120 to $119. Source: Stock Analysis

Disney+ will stream Super Bowl 61

ESPN said its Super Bowl 61 broadcast will stream on Disney+ in the United States and 55 international markets. The ESPN feed will also reach more than 130 countries and territories through linear platforms, giving Disney+ its biggest live-sports showcase yet. Source: Associated Press


Market Sentiment and Analyst Recommendations

Bull Case
Disney is growing revenue by 6.8% from a base of $98.86 billion. The stock gained 5.7% across five consecutive positive sessions, including a 2.17% rise on October 8 with volume of 13,028,966 shares. Wall Street remains firmly bullish, with a strong-buy recommendation from 32 analysts and an average target of $126.46. Needham and Yorkville Ives each carry a $125 target, while Barclays and Raymond James remain at $115 and $119. Disney+ streaming Super Bowl 61 in the United States and 55 international markets gives the service its biggest live-sports showcase yet. Disney World’s annual-pass increases, including a 7.4% increase for the $1,749 Incredi-Pass, create another revenue lever. The bull case is straightforward: revenue is growing, momentum is positive, and analysts see room above $107.75.
Bear Case
Disney carries $46.04 billion in total debt against only $5.18 billion in cash. That imbalance limits flexibility and makes the 22.22 P/E harder to dismiss as cheap. The stock is already 18.10% above its 52-week low and sits only $0.84 below near-term resistance at $108.59. Analyst targets also range from $88 to $144, showing substantial disagreement beneath the strong-buy consensus. Disney-owned ABC is challenging the FCC’s early license review for eight stations, adding legal and regulatory uncertainty. Disney World raised prices across every annual-pass tier, and those increases now need to produce more revenue without undermining demand. At $107.75, investors are paying for continued growth and clean execution despite heavy debt and a nearby technical ceiling.
What to Watch
The first test is whether DIS can close decisively above the $108.59 near-term resistance level. Failure there would put the $105.01 20-day moving average back in focus, followed by support at $101.33. Investors should also track whether five-day momentum of 5.73% develops into a stronger 20-day trend than the current 1.41%. ABC’s next court milestone is its October 14 brief, following the requested government brief due October 9. Watch whether analysts maintain targets near $125 after Raymond James already reduced its target from $120 to $119. Disney+ execution around Super Bowl 61 matters because the broadcast will reach the United States, 55 international streaming markets, and more than 130 countries and territories through linear platforms. The fundamental threshold is revenue growth: holding or improving on 6.8% would support the bull case, while a slowdown would make the 22.22 P/E and $46.04 billion debt load more difficult to defend.
Analyst Consensus
STRONG BUY

Based on 32 analyst opinions
Low Target
$88.00
Mean Target
$126.46
High Target
$144.00


Earnings and Financial Data

Sector
Communication Services
Industry
Entertainment
Employees
175,560
Earnings & Dividends
Next Earnings
Nov 12, 2026
EPS (Trailing)
$4.85
Dividend Yield
140.0%
Payout Ratio
30.9%

Frequently Asked Questions

Is DIS a good stock to buy?
DIS has a strong-buy recommendation from 32 analysts, and revenue growth is 6.8%. The stock also trades 2.90% above its 20-day moving average, but its $46.04 billion debt remains a material concern. Takeaway: the data supports a bullish view, but the balance sheet raises the risk.
What is the analyst price target for DIS?
The average analyst target is $126.46, with estimates ranging from $88 to $144. The current stock price is $107.75. Takeaway: analysts collectively expect a higher price, but the wide range shows meaningful disagreement.
Is DIS stock expensive?
DIS trades at a P/E ratio of 22.22 and has a market capitalization of $186.06 billion. Revenue is $98.86 billion and revenue growth is 6.8%. Takeaway: the valuation requires continued growth rather than offering an obviously cheap entry.
How much cash and debt does Disney have?
Disney has $5.18 billion in total cash and $46.04 billion in total debt. Debt is substantially higher than cash. Takeaway: Disney’s balance sheet is the clearest financial risk in the supplied data.
What are the key support and resistance levels for DIS?
Near-term support is the 30-day low of $101.33, while near-term resistance is the 30-day high of $108.59. The 20-day moving average is $105.01, compared with the current price of $107.75. Takeaway: $108.59 is the immediate breakout level, while $105.01 and $101.33 are the main downside levels to watch.

Related Stock Reports

Disclaimer: This report is for informational purposes only and does not constitute financial advice. The analysis and opinions expressed are those of AltStation.io and should not be relied upon as the sole basis for investment decisions. Always conduct your own research and consult with a qualified financial advisor before making investment decisions. Past performance does not guarantee future results. Updated October 10, 2026.