ALTSTATION.IO

Eastman Chemical Company (EMN) Stock Analysis

By Nova Skye | AltStation.io | Updated September 07, 2026

Price
$71.40
Change
+0.89%
Market Cap
$8.16B
Avg Volume
1.1M

Company Overview

Eastman Chemical Company is a specialty materials producer founded in 1920 and headquartered in Kingsport, Tennessee. Operating in the Basic Materials sector under Specialty Chemicals, the company manufactures high-performance additives, specialty polymers, films, and chemical intermediates. Their product lineup spans from aviation fluids and paint additives to window protective films and cellulose acetate tow. They sell directly to industrial manufacturers across transportation, building and construction, personal care, medical, food, and electronics markets.

Eastman operates across four distinct segments: Additives and Functional Products, Advanced Materials, Chemical Intermediates, and Fibers. The company has a clear technical edge in value-added lines like cellulosic biopolymers and protective films rather than basic bulk chemicals. That said, heavy exposure to cyclical sectors like commercial construction and consumer durables leaves revenue exposed during broader economic slowdowns. Furthermore, the Fibers division faces structural headwinds because a major revenue driver remains filtration media for cigarette filters.

The company currently relies on a geographic footprint spanning the United States, China, and international markets to move volume. Strategic focus centers on pushing higher-margin product lines like non-phthalate plasticizers and specialty copolyesters while managing baseline commodity solvent operations. Growth in technical and healthcare-adjacent materials provides upside, but bottom-line performance remains tied to global industrial output. Eastman is a disciplined specialty operator whose returns depend heavily on execution in its Advanced Materials and Additives units.

Key Financials
Market Cap
$8.16B
Revenue
$8.87B
EBITDA
$1.39B
Gross Margin
19.7%
Profit Margin
5.0%
Revenue Growth
9.9%
Total Cash
$693.00M
Total Debt
$5.47B
Free Cash Flow
$544.63M


52-Week Price Performance Analysis

Price Statistics
P/E Ratio
18.59
Forward P/E
10.30
Beta
1.08
52-Week High
$83.47
52-Week Low
$56.11
EPS
$3.84
50-Day Avg
$70.62
200-Day Avg
$70.53
Price/Book
1.34
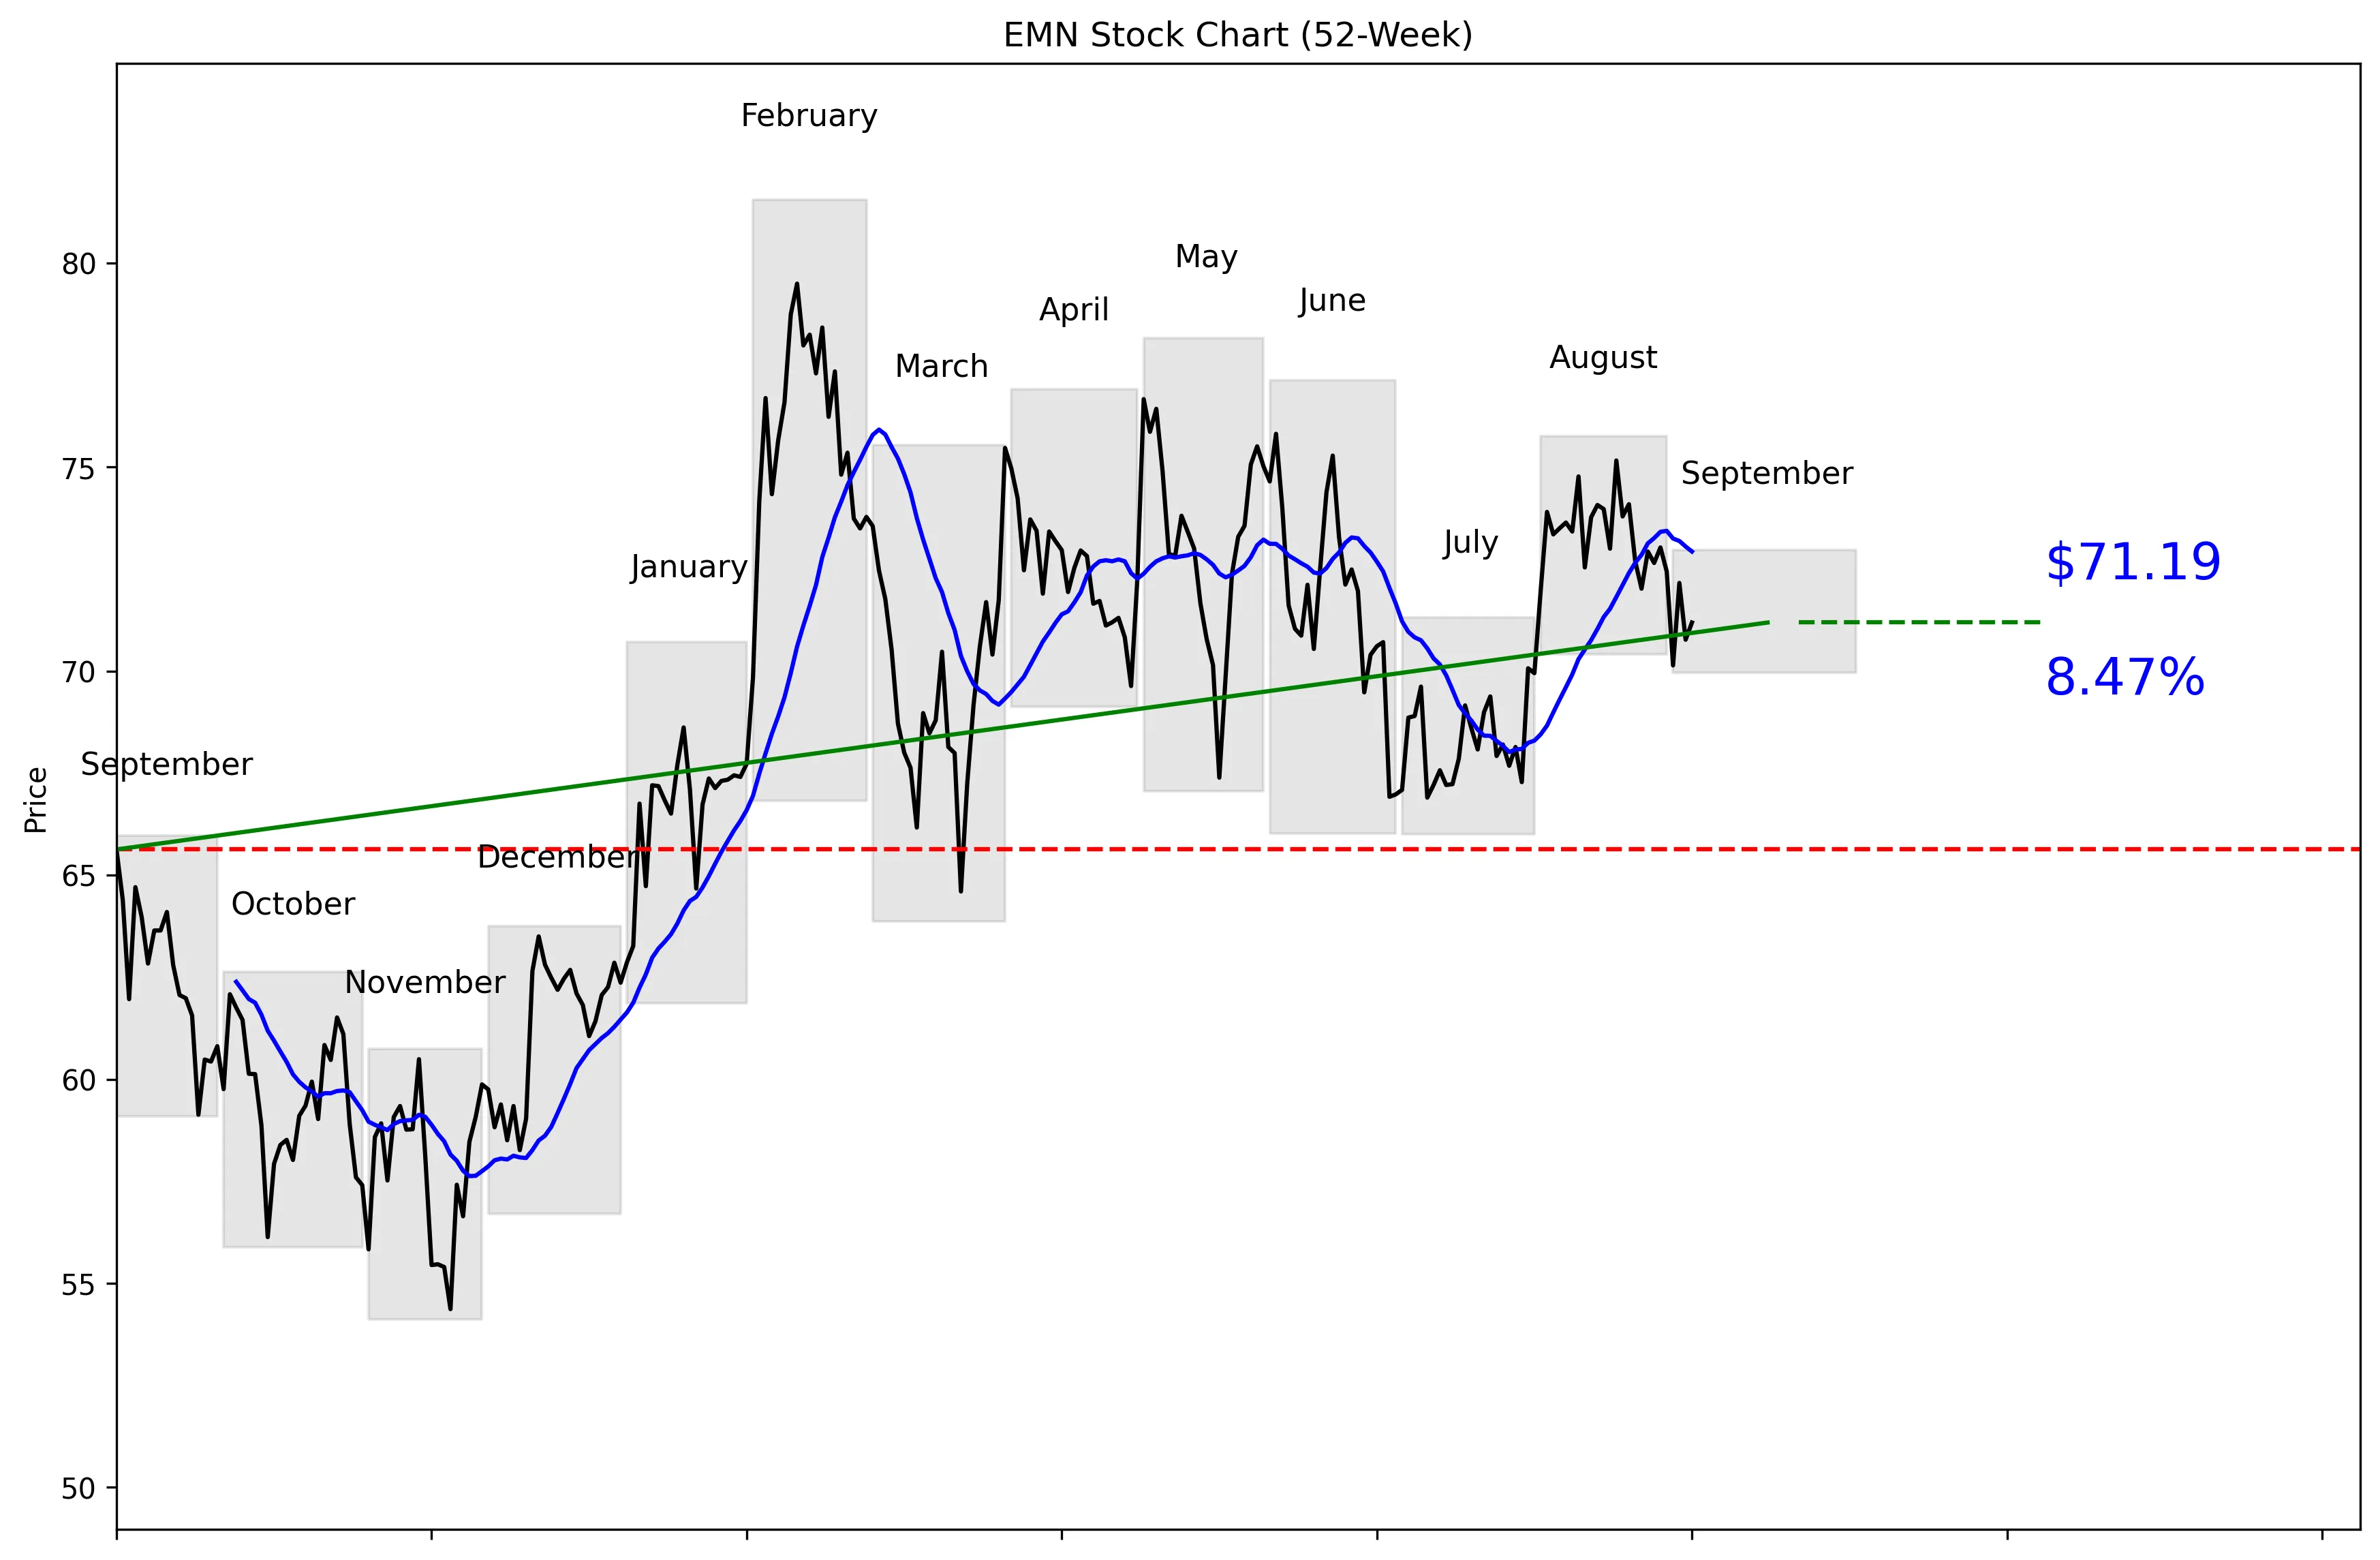
EMN 52-Week Stock Chart
Technical Analysis
EMN trades at $71.40, 62% of the way from its technical 52-week low of $54.12 to its high of $81.56. The stock is 12.71% below that high but remains 31.55% above the low. Price is 2.39% below the 20-day moving average of $72.93, while momentum is negative at 2.52% over five trading days and 3.33% over 20 trading days. Near-term support sits at the 30-day low of $67.28. Resistance is the 30-day high of $75.16, and EMN needs to reclaim that level to improve the short-term chart.


Recent News and Developments

Eastman launches Adjust SL for U.S. cereal growers

Eastman made Adjust SL plant growth regulator available in the United States on September 1. The product is registered for wheat, barley, oats and triticale and works at temperatures as low as 34°F. This is a legitimate product expansion into the U.S. agriculture market. Source: Eastman Chemical Company

Zacks flags EMN as a value stock

Zacks maintained a #3 Hold rank while giving EMN an A Value score and B VGM score. Five analysts raised fiscal 2026 earnings estimates during the prior 60 days, lifting the consensus estimate by $0.20 to $6.50 per share, while the stock traded at 11.14 times forward earnings. Source: Zacks Investment Research

EMN drops 3.2% to $70.14

Eastman shares fell 3.2% on September 1 and closed at $70.14. GuruFocus placed its proprietary fair-value estimate at $79.18, implying an 11.4% discount, but the selloff did not come with a new company catalyst. Source: GuruFocus


Market Sentiment and Analyst Recommendations

Bull Case
Revenue is $8.87 billion and growing 9.9%, giving the bull case a measurable operating foundation. At $71.40, EMN sits below the $81.60 analyst target and even below the lowest target of $74.00. Five analysts raised their fiscal 2026 earnings estimates during the prior 60 days, lifting the consensus estimate by $0.20 to $6.50 per share. Zacks also assigned EMN an A Value score and reported a forward earnings multiple of 11.14, compared with the stated P/E of 18.59. Adjust SL became available to U.S. wheat, barley, oats and triticale growers on September 1, creating a concrete product-expansion catalyst. The stock is still 12.71% below its technical 52-week high, so improving earnings and successful product execution could provide room for recovery. The reason to buy here is straightforward: revenue is growing, earnings estimates have increased, and the shares trade below every listed analyst target.
Bear Case
EMN carries $5.47 billion in total debt against only $693 million in cash. That balance-sheet gap is the clearest fundamental risk in the supplied data. The stock’s P/E of 18.59 is not automatically cheap, even though Zacks reported a lower forward multiple of 11.14. Price is below the $72.93 moving average, with five-day momentum at negative 2.52% and 20-day momentum at negative 3.33%. A break below $67.28 would put the near-term chart under additional pressure. The analyst picture is also mixed: 15 analysts are listed, but no recommendation is provided, and the low target of $74.00 offers limited dollar upside from $71.40. Adjust SL is a legitimate expansion, but the supplied data does not show sales, margins or customer adoption, so its financial impact is still unproven.
What to Watch
Watch whether EMN can reclaim its $72.93 20-day moving average and then break through $75.16 resistance. A fall below $67.28 would weaken the near-term technical setup. Investors should monitor whether the negative five-day and 20-day momentum readings of 2.52% and 3.33% begin to reverse. The September 1 U.S. launch of Adjust SL is the main operating catalyst, with adoption among wheat, barley, oats and triticale growers now worth tracking. Fiscal 2026 earnings expectations are another key marker after five analysts raised estimates and moved the consensus up by $0.20 to $6.50 per share. Revenue growth needs to hold near the reported 9.9% rate for the bull case to remain credible. The September 5 VanEck disclosure involved 31,282 shares valued at approximately $2.095 million, but it covered a second-quarter purchase and should not be treated as evidence of current buying.
Analyst Consensus
NONE

Based on 15 analyst opinions
Low Target
$74.00
Mean Target
$81.60
High Target
$100.00


Earnings and Financial Data

Sector
Basic Materials
Industry
Specialty Chemicals
Employees
13,000
Earnings & Dividends
Next Earnings
Nov 02, 2026
EPS (Trailing)
$3.84
Dividend Yield
466.0%
Payout Ratio
87.2%

Frequently Asked Questions

Is EMN a good stock to buy?
EMN has 9.9% revenue growth and trades at $71.40, below the $81.60 analyst target. The takeaway is that the valuation case has upside, but negative momentum and $5.47 billion in debt make this a risk-aware buy rather than a clean technical setup.
What is EMN’s price target?
The analyst target is $81.60, with estimates ranging from $74.00 to $100.00. The takeaway is that every supplied target is above the current $71.40 price.
What are EMN’s support and resistance levels?
Near-term support is $67.28, the 30-day low, while resistance is $75.16, the 30-day high. The takeaway is that those are the key thresholds for the next directional move.
Is EMN trading near its 52-week high?
EMN is 12.71% below its technical 52-week high of $81.56 and sits 62% of the way from its $54.12 low to that high. The takeaway is that EMN is in the upper half of its technical range but is not close to a breakout.
Does EMN pay a dividend?
No dividend information is included in the supplied key or technical data. The takeaway is that investors should not assume a dividend amount or yield from this analysis.

Related Stock Reports

Disclaimer: This report is for informational purposes only and does not constitute financial advice. The analysis and opinions expressed are those of AltStation.io and should not be relied upon as the sole basis for investment decisions. Always conduct your own research and consult with a qualified financial advisor before making investment decisions. Past performance does not guarantee future results. Updated September 07, 2026.