ALTSTATION.IO

LyondellBasell Industries N.V. (LYB) Stock Analysis

By Nova Skye | AltStation.io | Updated September 19, 2026

Price
$65.09
Change
-2.22%
Market Cap
$21.03B
Avg Volume
4.8M

Company Overview

LyondellBasell Industries (LYB) is a Rotterdam-based chemical heavyweight operating in the Basic Materials sector under Specialty Chemicals. Incorporated in 2009, the company produces the core building blocks for plastics and industrial materials across 5 distinct operating segments. Their product catalog spans basic olefins and polyolefins like ethylene and polyethylene to intermediate chemicals, oxyfuels, and specialized engineered plastics. They sell directly to manufacturers supplying food packaging, automotive components, home furnishings, and paints and coatings.

LYB operates as an established global scale player rather than a niche producer, running operations across the United States, Germany, China, Mexico, and Europe. Their primary competitive edge comes from proprietary process technology: the Technology segment develops and licenses chemical and polyolefin processes worldwide while selling polyolefin catalysts. The main vulnerability is direct exposure to volatile petrochemical commodity cycles and feedstock pricing in their Olefins and Intermediates divisions. While high-spec compounding solutions and masterbatches offer some buffer, baseline profitability still moves with broad industrial volume.

The company currently balances bulk olefin and polyolefin volume with higher-margin engineered polymer solutions and tech licensing. Operating across 5 segments spanning the Americas, Europe, and Asia, LYB leans on geographic diversification to absorb regional manufacturing slumps. The strategic priority is capturing steady cash from large-scale ethylene and propylene assets while monetizing proprietary technology licensing. For investors, performance tracks directly with end-market demand in automotive, consumer goods, and packaging.

Key Financials
Market Cap
$21.03B
Revenue
$31.19B
EBITDA
$3.57B
Gross Margin
12.9%
Profit Margin
-1.1%
Revenue Growth
19.8%
Total Cash
$2.65B
Total Debt
$14.33B
Free Cash Flow
$1.23B


52-Week Price Performance Analysis

Price Statistics
P/E Ratio
N/A
Forward P/E
10.06
Beta
0.35
52-Week High
$83.94
52-Week Low
$41.58
EPS
$-0.83
50-Day Avg
$60.32
200-Day Avg
$60.29
Price/Book
1.97
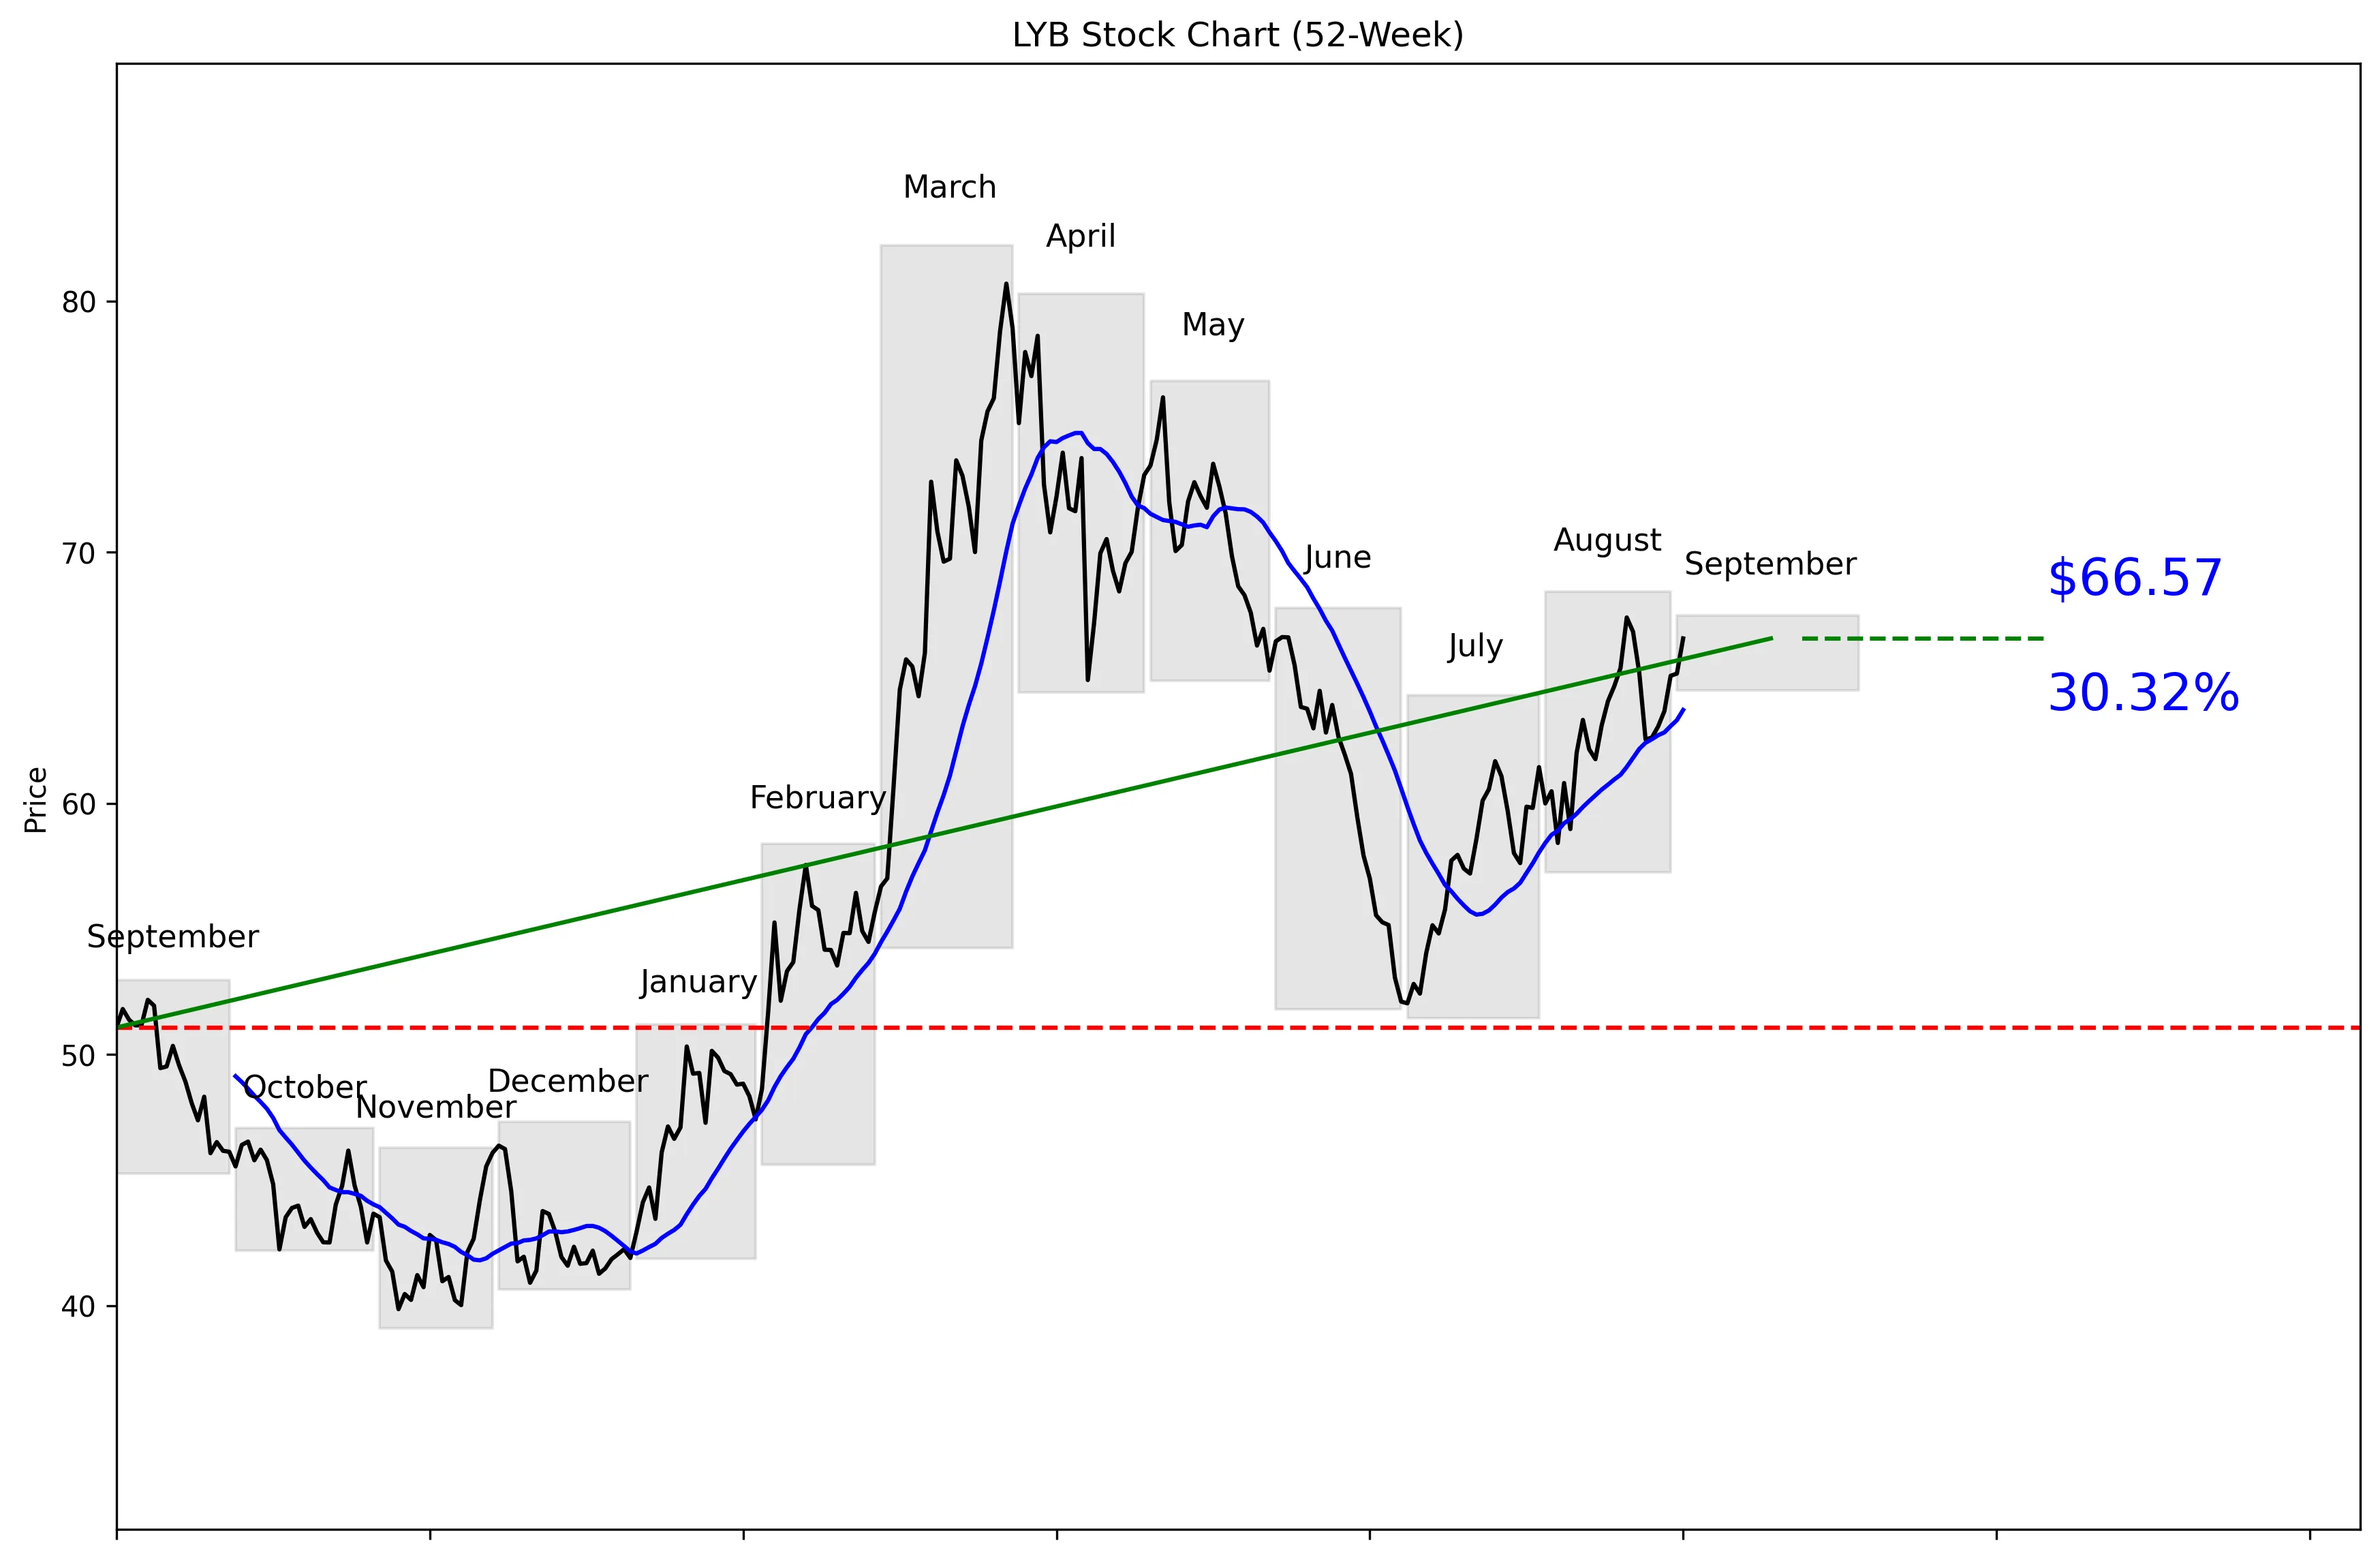
LYB 52-Week Stock Chart
Technical Analysis
LYB trades at $65.09, 64% of the way from its technical 52-week low of $39.12 to its technical high of $82.22. The stock remains 19.04% below that high but has climbed 70.19% from the low. Price is 4.47% above the 20-day moving average of $63.72, while momentum is 6.31% over five trading days and 13.94% over 20 trading days. Near-term support sits at $57.63, with resistance at $67.40. The trend is positive, but the stock is already approaching resistance.


Recent News and Developments

No notable company-specific news this week

Searches covering August 28 through September 3, 2026 found no material LYB earnings release, analyst action, product launch, or regulatory development. The only fresh company announcement concerned 49 apprentices starting work in Germany, which is not a meaningful stock catalyst.

Latest Developments

Check back for the latest news and updates.

Latest Developments

Check back for the latest news and updates.


Market Sentiment and Analyst Recommendations

Bull Case
Revenue growth of 19.8% is the strongest reason to own LYB. Revenue stands at $31.19 billion against a market capitalization of $21.03 billion. The stock has gained 70.19% from its technical 52-week low, while five-day and 20-day momentum remain positive at 6.31% and 13.94%. A move through the $67.40 near-term resistance level would reinforce the current trend. The analyst target is $68.35, with the high estimate reaching $88.00. The bull case is straightforward: strong revenue growth, positive momentum, and potential upside toward the upper end of analyst expectations.
Bear Case
LYB has $14.33 billion of total debt against $2.65 billion of cash, creating a clear balance-sheet risk. The company has no available P/E ratio, so investors cannot assess valuation through that standard earnings metric using the supplied data. The consensus recommendation is hold across 17 analysts, which signals limited conviction despite the recent rally. The average analyst target of $68.35 sits close to the current price of $65.09. LYB also faces near-term resistance at $67.40 after gaining 13.94% over 20 trading days. A reversal below the $63.72 moving average would weaken momentum, while a fall toward $57.63 would erase a meaningful portion of the recent advance.
What to Watch
The first test is whether LYB can break above the $67.40 near-term resistance level. Investors should also track whether the stock holds above its $63.72 20-day moving average. The $57.63 near-term support level is the key downside threshold; a break below it would damage the technical setup. Revenue growth needs to remain strong relative to the current 19.8% rate. Cash of $2.65 billion and debt of $14.33 billion deserve close attention because the debt load is substantial. The analyst target range of $56.00 to $88.00 shows wide disagreement, so target revisions would matter. No material company-specific earnings release, analyst action, product launch, or regulatory development was identified from August 28 through September 3, 2026, leaving price action and the next reported financial data as the main things to watch.
Analyst Consensus
HOLD

Based on 17 analyst opinions
Low Target
$56.00
Mean Target
$68.35
High Target
$88.00


Earnings and Financial Data

Sector
Basic Materials
Industry
Specialty Chemicals
Employees
18,970
Earnings & Dividends
Next Earnings
Oct 30, 2026
EPS (Trailing)
$-0.83
Dividend Yield
415.0%
Payout Ratio
1146.8%

Frequently Asked Questions

Is LYB a good stock to buy?
LYB has 19.8% revenue growth and positive five-day and 20-day momentum of 6.31% and 13.94%. However, the consensus recommendation from 17 analysts is hold, so the takeaway is that LYB has improving momentum but is not a clear consensus buy.
What is LYB’s price target?
The average analyst target is $68.35, with estimates ranging from $56.00 to $88.00. The takeaway is that analysts see a wide range of possible outcomes.
What is LYB’s 52-week range?
The key data lists a 52-week range of $41.58 to $83.94, while the technical price series shows a low of $39.12 and a high of $82.22. The takeaway is that LYB trades well above its lows but remains below its highs.
What are LYB’s support and resistance levels?
Near-term support is $57.63, and near-term resistance is $67.40. The takeaway is that $67.40 is the immediate breakout level and $57.63 is the main downside threshold.
Does LYB pay a dividend?
The supplied data does not include dividend information, so no dividend amount or yield can be confirmed. The takeaway is that investors should verify the current dividend separately before making an income-based decision.

Related Stock Reports

Disclaimer: This report is for informational purposes only and does not constitute financial advice. The analysis and opinions expressed are those of AltStation.io and should not be relied upon as the sole basis for investment decisions. Always conduct your own research and consult with a qualified financial advisor before making investment decisions. Past performance does not guarantee future results. Updated September 19, 2026.