ALTSTATION.IO

DuPont de Nemours, Inc. (DD) Stock Analysis

By Nova Skye | AltStation.io | Updated September 19, 2026

Price
$131.15
Change
-1.34%
Market Cap
$17.71B
Avg Volume
1.4M

Company Overview

DuPont de Nemours, Inc. is a Wilmington, Delaware-based specialty chemicals company operating within the Basic Materials sector. The business sells high-performance engineered materials, protective barriers, and water purification technologies to industrial buyers across seven geographic regions. Their core catalog relies on established, premium brands like TYVEK for protective garments and medical packaging, FILMTEC and AMBERLITE for municipal water desalination and wastewater treatment, and STYROFOAM and CORIAN for building construction. They also supply specialized industrial components, including Vespel parts, BETAFORCE adhesives, and MOLYKOTE lubricants to automotive, aerospace, and commercial printing manufacturers.

DuPont functions as an established leader in high-spec specialty niches rather than a generic commodity chemical producer. Their real moat comes from heavily specified, proprietary brands like TYVEK, FILMTEC, and Vespel, which carry substantial switching costs in regulated medical, aerospace, and municipal water filtration operations. The vulnerability is cyclicality: their Diversified Industrials arm remains directly exposed to macro slowdowns in automotive build rates, commercial printing demand, and residential housing construction. Maintaining pricing power across these diverse end markets requires strict cost management against competing chemical formulators.

The company is operating as a significantly streamlined specialty business following its corporate split from DowDuPont and official rebranding in June 2019. DuPont has consolidated its global operations into two distinct reporting units: Healthcare & Water Technologies and Diversified Industrials. This two-segment structure strategically pivots capital toward secular drivers like global water desalination, industrial wastewater filtration, and sterile medical packaging. Compared to the massive conglomerate originally incorporated in 2015, today’s DuPont is a more disciplined operator targeting essential engineering and separation technologies.

Key Financials
Market Cap
$17.71B
Revenue
$6.99B
EBITDA
$1.58B
Gross Margin
35.1%
Profit Margin
0.8%
Revenue Growth
4.0%
Total Cash
$1.74B
Total Debt
$3.18B
Free Cash Flow
$1.84B


52-Week Price Performance Analysis

Price Statistics
P/E Ratio
56.29
Forward P/E
16.47
Beta
1.09
52-Week High
$157.98
52-Week Low
$92.49
EPS
$2.33
50-Day Avg
$138.56
200-Day Avg
$136.53
Price/Book
1.29
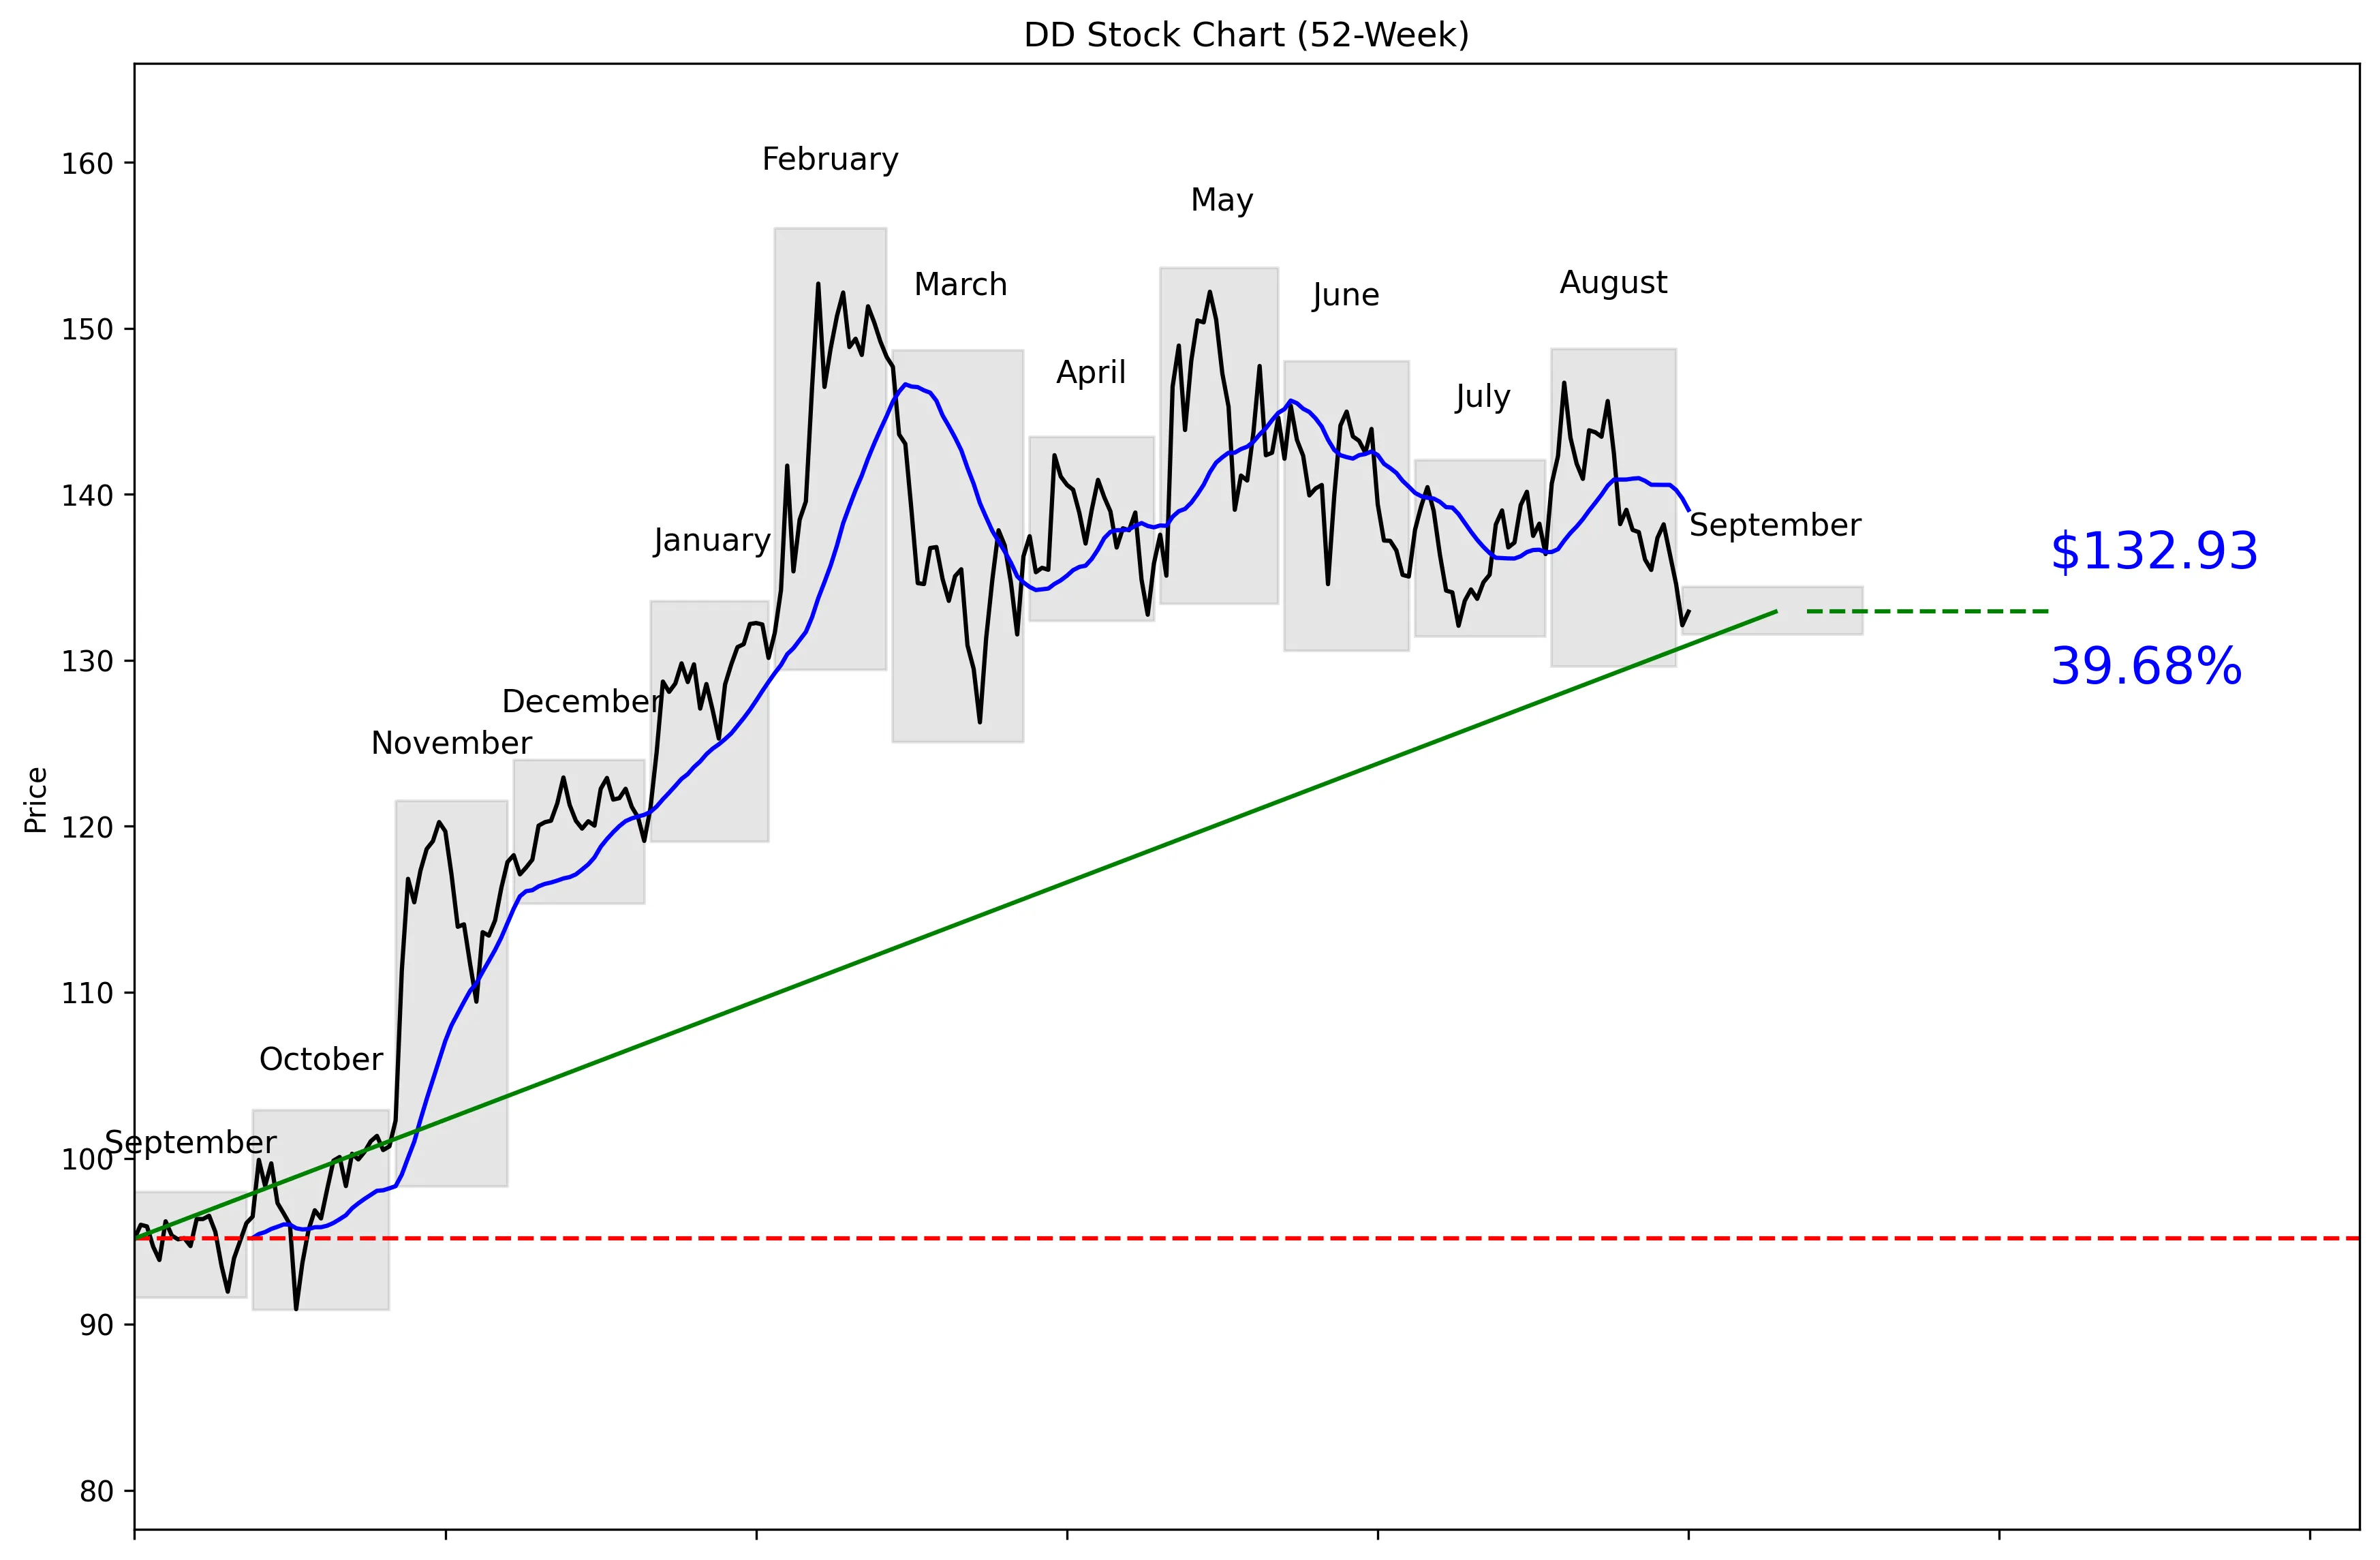
DD 52-Week Stock Chart
Technical Analysis
DD trades at $131.15, 65% of the way from its technical 52-week low of $90.89 to its high of $156.04. The stock is 14.81% below that high and 46.26% above the low. Price is 4.41% below the 20-day moving average of $139.06, while momentum is negative 3.24% over five trading days and negative 9.40% over 20 trading days. DD has slipped below the stated near-term support level of $132.11, which weakens the short-term setup. Near-term resistance is $146.72.


Recent News and Developments

No notable company-specific news this week

No DuPont earnings, analyst rating changes, product launches, or regulatory developments were found for August 27 through September 3, 2026. The latest company announcement found was dated August 26, outside the requested window.

Latest Developments

Check back for the latest news and updates.

Latest Developments

Check back for the latest news and updates.


Market Sentiment and Analyst Recommendations

Bull Case
Revenue is $6.99 billion and growing 4.0%, giving investors measurable expansion rather than contraction. The company also holds $1.74 billion in cash, providing financial flexibility despite its debt load. Wall Street is firmly positive: 16 analysts rate DD a buy. Their average target is $170.00, with estimates ranging from $156.00 to $186.00. Even the bottom of that target range sits above the current price of $131.15. The bull case is straightforward: modest revenue growth and strong analyst conviction offer upside if the recent negative momentum reverses.
Bear Case
A P/E of 56.29 is expensive against revenue growth of just 4.0%. That valuation leaves little room for weak execution or slower growth. Total debt of $3.18 billion is substantially higher than total cash of $1.74 billion. The technical picture is also deteriorating, with the stock down 9.40% over 20 trading days and trading 4.41% below its 20-day moving average. At $131.15, the price is already below the stated near-term support of $132.11. With no notable company-specific news found from August 27 through September 3, 2026, there is no identified near-term catalyst to interrupt the selloff.
What to Watch
The first threshold is $132.11, the stated 30-day low and near-term support level that DD has already fallen below at $131.15. A recovery above the 20-day moving average of $139.06 would improve the short-term technical picture. The next test is resistance at $146.72, followed by the technical 52-week high of $156.04. Investors should track whether 20-day momentum improves from negative 9.40% and whether five-day momentum recovers from negative 3.24%. Fundamentally, watch whether revenue growth can improve from 4.0%, because a P/E of 56.29 demands stronger performance. No DuPont earnings, rating changes, product launches, or regulatory developments were found for August 27 through September 3, 2026, so any new company-specific announcement would be the next identifiable catalyst.
Analyst Consensus
BUY

Based on 16 analyst opinions
Low Target
$156.00
Mean Target
$170.00
High Target
$186.00


Earnings and Financial Data

Sector
Basic Materials
Industry
Specialty Chemicals
Employees
15,000
Earnings & Dividends
Next Earnings
Nov 05, 2026
EPS (Trailing)
$2.33
Dividend Yield
181.0%
Payout Ratio
130.0%

Frequently Asked Questions

Is DD a good stock to buy?
The analyst recommendation is buy, supported by 16 analysts, and the average target is $170.00 versus a current price of $131.15. The takeaway is that Wall Street sees upside, but the stock’s negative short-term momentum raises entry risk.
What is DD’s analyst price target?
The average analyst target is $170.00, with a range from $156.00 to $186.00. The takeaway is that every listed target is above the current $131.15 price.
Is DD stock overvalued?
DD trades at a P/E of 56.29 while revenue growth is 4.0%. The takeaway is that the valuation is demanding relative to the reported growth rate.
What are DD’s support and resistance levels?
Near-term support is $132.11 and near-term resistance is $146.72. The takeaway is that the current price of $131.15 is already below the stated support level.
Where is DD trading relative to its 52-week range?
DD is 65% of the way from its technical 52-week low of $90.89 to its high of $156.04. The takeaway is that the stock remains 14.81% below the high despite standing 46.26% above the low.

Related Stock Reports

Disclaimer: This report is for informational purposes only and does not constitute financial advice. The analysis and opinions expressed are those of AltStation.io and should not be relied upon as the sole basis for investment decisions. Always conduct your own research and consult with a qualified financial advisor before making investment decisions. Past performance does not guarantee future results. Updated September 19, 2026.