ALTSTATION.IO

Entergy Corporation (ETR) Stock Analysis

By Nova Skye | AltStation.io | Updated October 09, 2026

Price
$102.71
Change
-0.09%
Market Cap
$49.07B
Avg Volume
2.7M

Company Overview

Entergy Corporation operates as a regulated electric utility headquartered in New Orleans, Louisiana. Founded in 1913, the company generates, transmits, and delivers electricity across Arkansas, Louisiana, Mississippi, and Texas. They supply power directly to 3.1 million utility customers while selling wholesale energy to retail power providers, cooperatives, utilities, and power trading firms. Beyond standard electricity distribution, the company also monetizes specialized services by decommissioning nuclear plants for third-party operators.

Entergy operates as an entrenched regional leader rather than an open-market challenger. Its competitive edge rests on an extensive regulated footprint backed by approximately 25,000 megawatts of generating capacity across natural gas, nuclear, coal, hydro, and solar sources. Regulated status grants the company a protected utility base across four states, virtually eliminating direct retail competition. The primary operational threat comes from its heavy geographic concentration in the Gulf South, tying asset performance to regional regulatory boards and weather vulnerabilities.

Entergy stands on solid operational footing, managing its 25,000-megawatt fleet to support steady regional load demand. Its power generation mix spans nuclear, gas, and coal alongside cleaner hydro and solar assets to ensure reliable baseload output. Supplementary operations in non-nuclear wholesale power and third-party nuclear decommissioning provide valuable revenue diversification beyond residential meters. Entergy remains a textbook defensive utility with stable revenue anchored to 3.1 million captive regional customers.

Key Financials
Market Cap
$49.07B
Revenue
$13.48B
EBITDA
$5.54B
Gross Margin
47.0%
Profit Margin
13.3%
Revenue Growth
5.9%
Total Cash
$3.86B
Total Debt
$34.63B
Free Cash Flow
-$4.40B


52-Week Price Performance Analysis

Price Statistics
P/E Ratio
26.27
Forward P/E
20.12
Beta
0.45
52-Week High
$118.45
52-Week Low
$90.87
EPS
$3.91
50-Day Avg
$104.88
200-Day Avg
$106.40
Price/Book
2.63
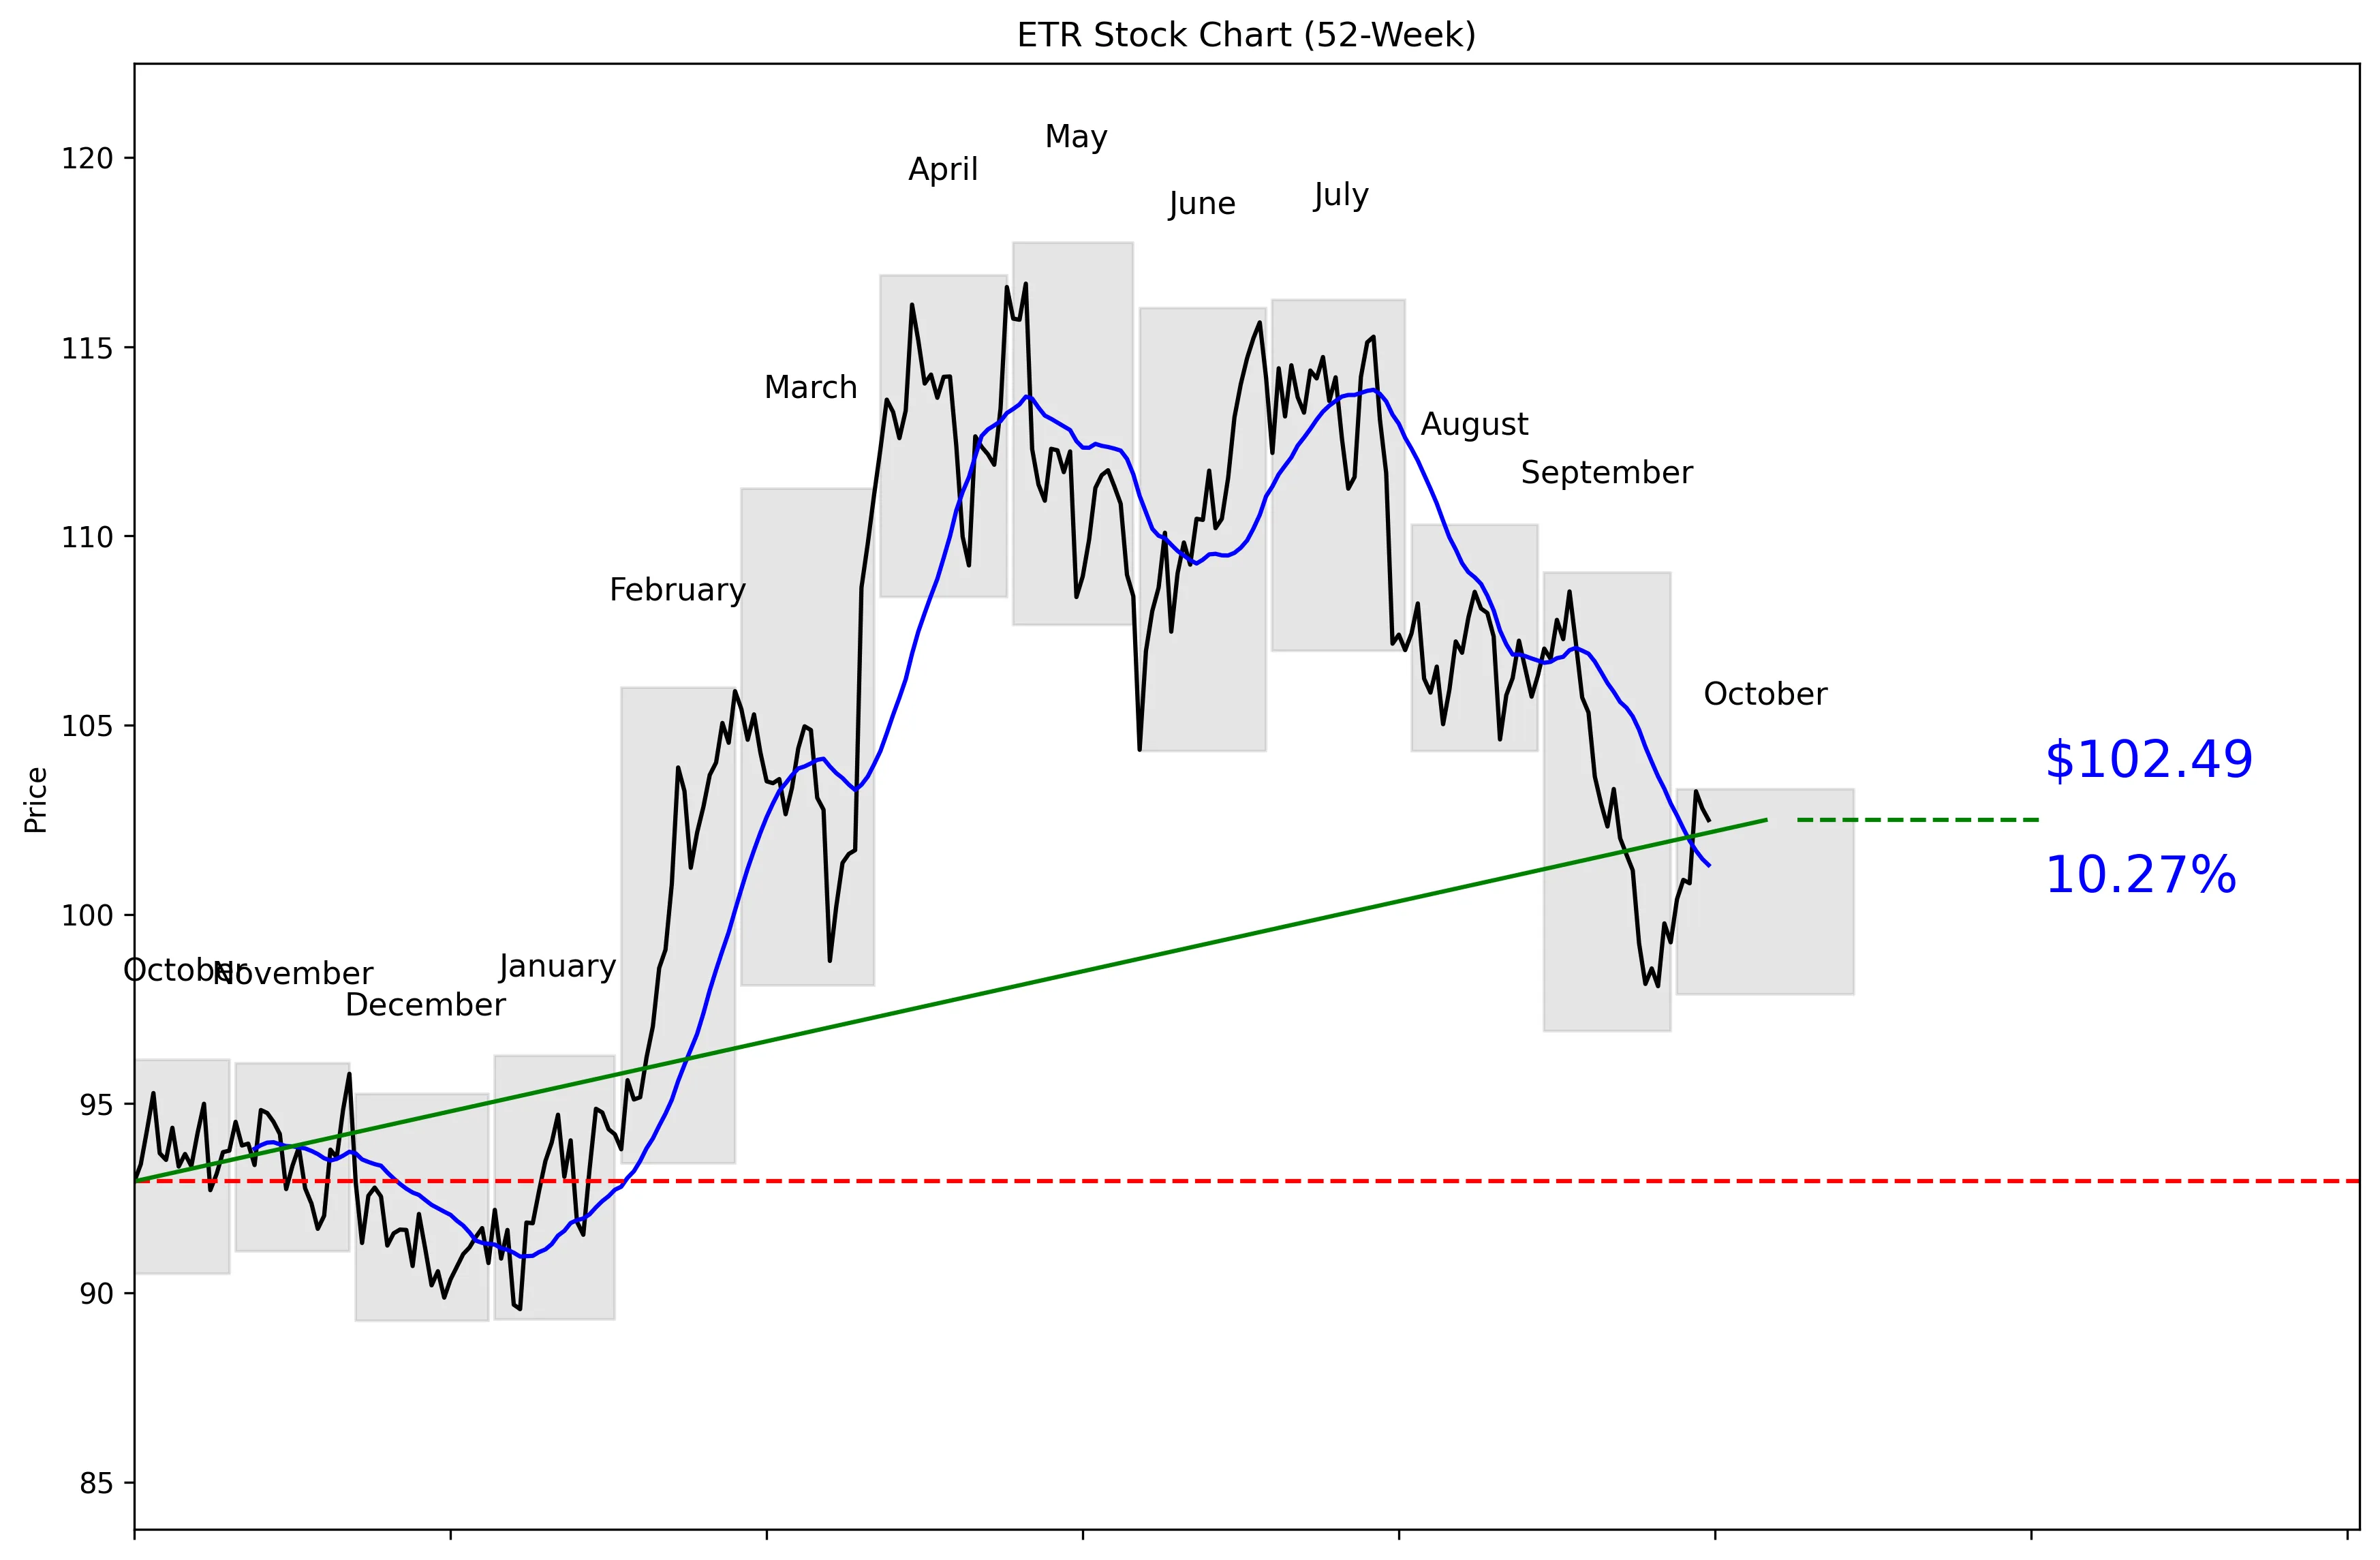
ETR 52-Week Stock Chart
Technical Analysis
ETR trades at $102.71, 46% of the way from its exact 52-week low of $89.25 to its exact high of $117.75. The stock is 12.96% below that high and 14.83% above the low. Price is 1.17% above the 20-day moving average of $101.30, while five-day momentum is positive at 2.08%. The broader 20-day move remains negative at 3.06%, so the short-term rebound has not fully reversed the recent weakness. Near-term support is $98.10, while $108.53 is the resistance level buyers need to clear.


Recent News and Developments

Evercore lifts Entergy target to $128

Evercore ISI raised its Entergy price target from $121 to $128 on October 8. ETR closed at $102.80 before the call, putting the new target $25.20 above that price. Source: MarketScreener

Meta project requires 4,500 megawatts from Entergy

Entergy Louisiana CEO Phillip May disclosed during an October 7 regulatory hearing that Meta’s Louisiana data center is expected to draw 4,500 megawatts, roughly four times New Orleans’ peak demand. The proposed settlement would let Entergy skip the usual competitive-bid process for seven power plants, making regulatory approval a major test of the company’s data-center growth strategy. Source: The Inference

ETR gains 1.6% across four trading sessions

Entergy closed at $102.49 on October 8, up 1.6% from its October 2 close of $100.91. The strongest session was October 6, when the stock gained 2.41%, followed by declines of 0.44% and 0.30% over the next two sessions. Source: Stock Analysis


Market Sentiment and Analyst Recommendations

Bull Case
Revenue is growing 5.9%, giving Entergy a measurable expansion story rather than a purely defensive utility profile. Meta’s planned Louisiana data center is expected to require 4,500 megawatts, creating a potentially significant source of electricity demand. Entergy’s proposal covers seven power plants, showing the scale of infrastructure being considered to serve that load. Wall Street’s $122.28 average target sits $19.57 above the current $102.71 price. Evercore ISI raised its target from $121 to $128 on October 8, adding another bullish signal. With a buy recommendation from 20 analysts, positive five-day momentum of 2.08%, and the stock still 12.96% below its 52-week high, the setup offers upside if growth projects secure approval.
Bear Case
The balance sheet is the clearest concern: Entergy has $34.63 billion in total debt against $3.86 billion in cash. That is a heavy debt burden for a company valued at $49.07 billion. The stock also trades at 26.27 times earnings, so investors are already paying a substantial multiple for 5.9% revenue growth. The Meta project faces regulatory risk because Entergy wants approval to bypass the usual competitive-bid process for seven power plants. Near-term price action is still mixed, with 20-day momentum down 3.06% despite the recent five-day rebound. Tropical Storm Isaias also puts outage response and repair costs in focus, adding an operating risk that the current valuation does not make easy to ignore.
What to Watch
The biggest catalyst is regulatory approval for the seven power plants tied to Meta’s expected 4,500-megawatt demand. Investors should track whether Entergy is allowed to skip the usual competitive-bid process and whether that decision changes the economics of the project. The market will also test whether Evercore’s October 8 target increase from $121 to $128 gains support from other analysts. On the chart, $108.53 is the first important upside threshold, while a break below $98.10 would weaken the near-term setup. The 20-day moving average at $101.30 is another useful checkpoint because the current price is only 1.17% above it. Over the next quarter, the thesis improves if revenue growth holds above the reported 5.9% rate and deteriorates if debt rises beyond $34.63 billion or cash falls below $3.86 billion.
Analyst Consensus
BUY

Based on 20 analyst opinions
Low Target
$91.00
Mean Target
$122.28
High Target
$137.00


Earnings and Financial Data

Sector
Utilities
Industry
Utilities – Regulated Electric
Employees
12,000
Earnings & Dividends
Next Earnings
Nov 02, 2026
EPS (Trailing)
$3.91
Dividend Yield
249.0%
Payout Ratio
64.4%

Frequently Asked Questions

Is ETR a good stock to buy?
ETR has a buy recommendation from 20 analysts and revenue growth of 5.9%. The analyst support is positive, but the 26.27 P/E and $34.63 billion debt load require caution; the takeaway is that ETR is a growth-backed utility with meaningful valuation and balance-sheet risk.
What is ETR’s price target?
The average analyst target is $122.28, with estimates ranging from $91.00 to $137.00. Against the current price of $102.71, the takeaway is that analyst expectations lean higher but include substantial downside and upside scenarios.
Is ETR stock overvalued?
ETR trades at 26.27 times earnings while revenue is growing 5.9%. The takeaway is that the stock carries a demanding valuation relative to its reported growth rate.
What are ETR’s support and resistance levels?
Near-term support is the 30-day low of $98.10, while resistance is the 30-day high of $108.53. The takeaway is that these are the key levels defining ETR’s immediate trading range.
How far is ETR from its 52-week high?
At $102.71, ETR is 12.96% below its exact 52-week high of $117.75 and 14.83% above its exact low of $89.25. The takeaway is that the stock sits near the middle of its annual range, at the 46% position.

Related Stock Reports

Disclaimer: This report is for informational purposes only and does not constitute financial advice. The analysis and opinions expressed are those of AltStation.io and should not be relied upon as the sole basis for investment decisions. Always conduct your own research and consult with a qualified financial advisor before making investment decisions. Past performance does not guarantee future results. Updated October 09, 2026.