ALTSTATION.IO

Federal Realty Investment Trust (FRT) Stock Analysis

By Nova Skye | AltStation.io | Updated October 29, 2026

Price
$108.95
Change
-0.66%
Market Cap
$9.52B
Avg Volume
880.3K

Company Overview

Federal Realty Investment Trust is a retail real estate investment trust based in North Bethesda, Maryland, operating since its incorporation in 1962. The company owns, operates, and redevelops open-air shopping centers and mixed-use commercial destinations in major coastal markets. They lease space to roughly 3,700 commercial tenants across 28.8 million square feet of commercial space, alongside approximately 2,500 residential units. Key signature properties include major mixed-use hubs such as Santana Row, Pike & Rose, and Assembly Row.

Federal Realty is an established market leader in the retail REIT sector, built on targeting supply-constrained coastal markets where consumer demand outpaces available retail space. Their edge comes from designing high-traffic, mixed-use community destinations rather than generic strip centers, which helps maintain strong tenant demand. The main risk factor lies in their geographic focus on select major metros, making them sensitive to regional economic headwinds and broader commercial real estate cycles. Still, their focus on affluent, high-density areas gives them significantly better pricing power than commodity retail landlords.

The company stands as one of the most consistent income generators in the real estate sector rather than an aggressive growth story. Their defining milestone is 59 consecutive years of quarterly dividend increases, which is the single longest track record in the entire REIT industry. With 103 properties anchored by both commercial square footage and residential units, the strategy prioritizes disciplined asset redevelopment over chasing speculative expansion. Federal Realty remains a durable, defensively positioned cash generator built on top-tier real estate fundamentals.

Key Financials
Market Cap
$9.52B
Revenue
$1.34B
EBITDA
$837.70M
Gross Margin
68.1%
Profit Margin
32.7%
Revenue Growth
7.2%
Total Cash
$115.28M
Total Debt
$4.85B
Free Cash Flow
$456.14M


52-Week Price Performance Analysis

Price Statistics
P/E Ratio
22.01
Forward P/E
33.40
Beta
0.94
52-Week High
$128.21
52-Week Low
$90.03
EPS
$4.95
50-Day Avg
$111.42
200-Day Avg
$112.92
Price/Book
2.95
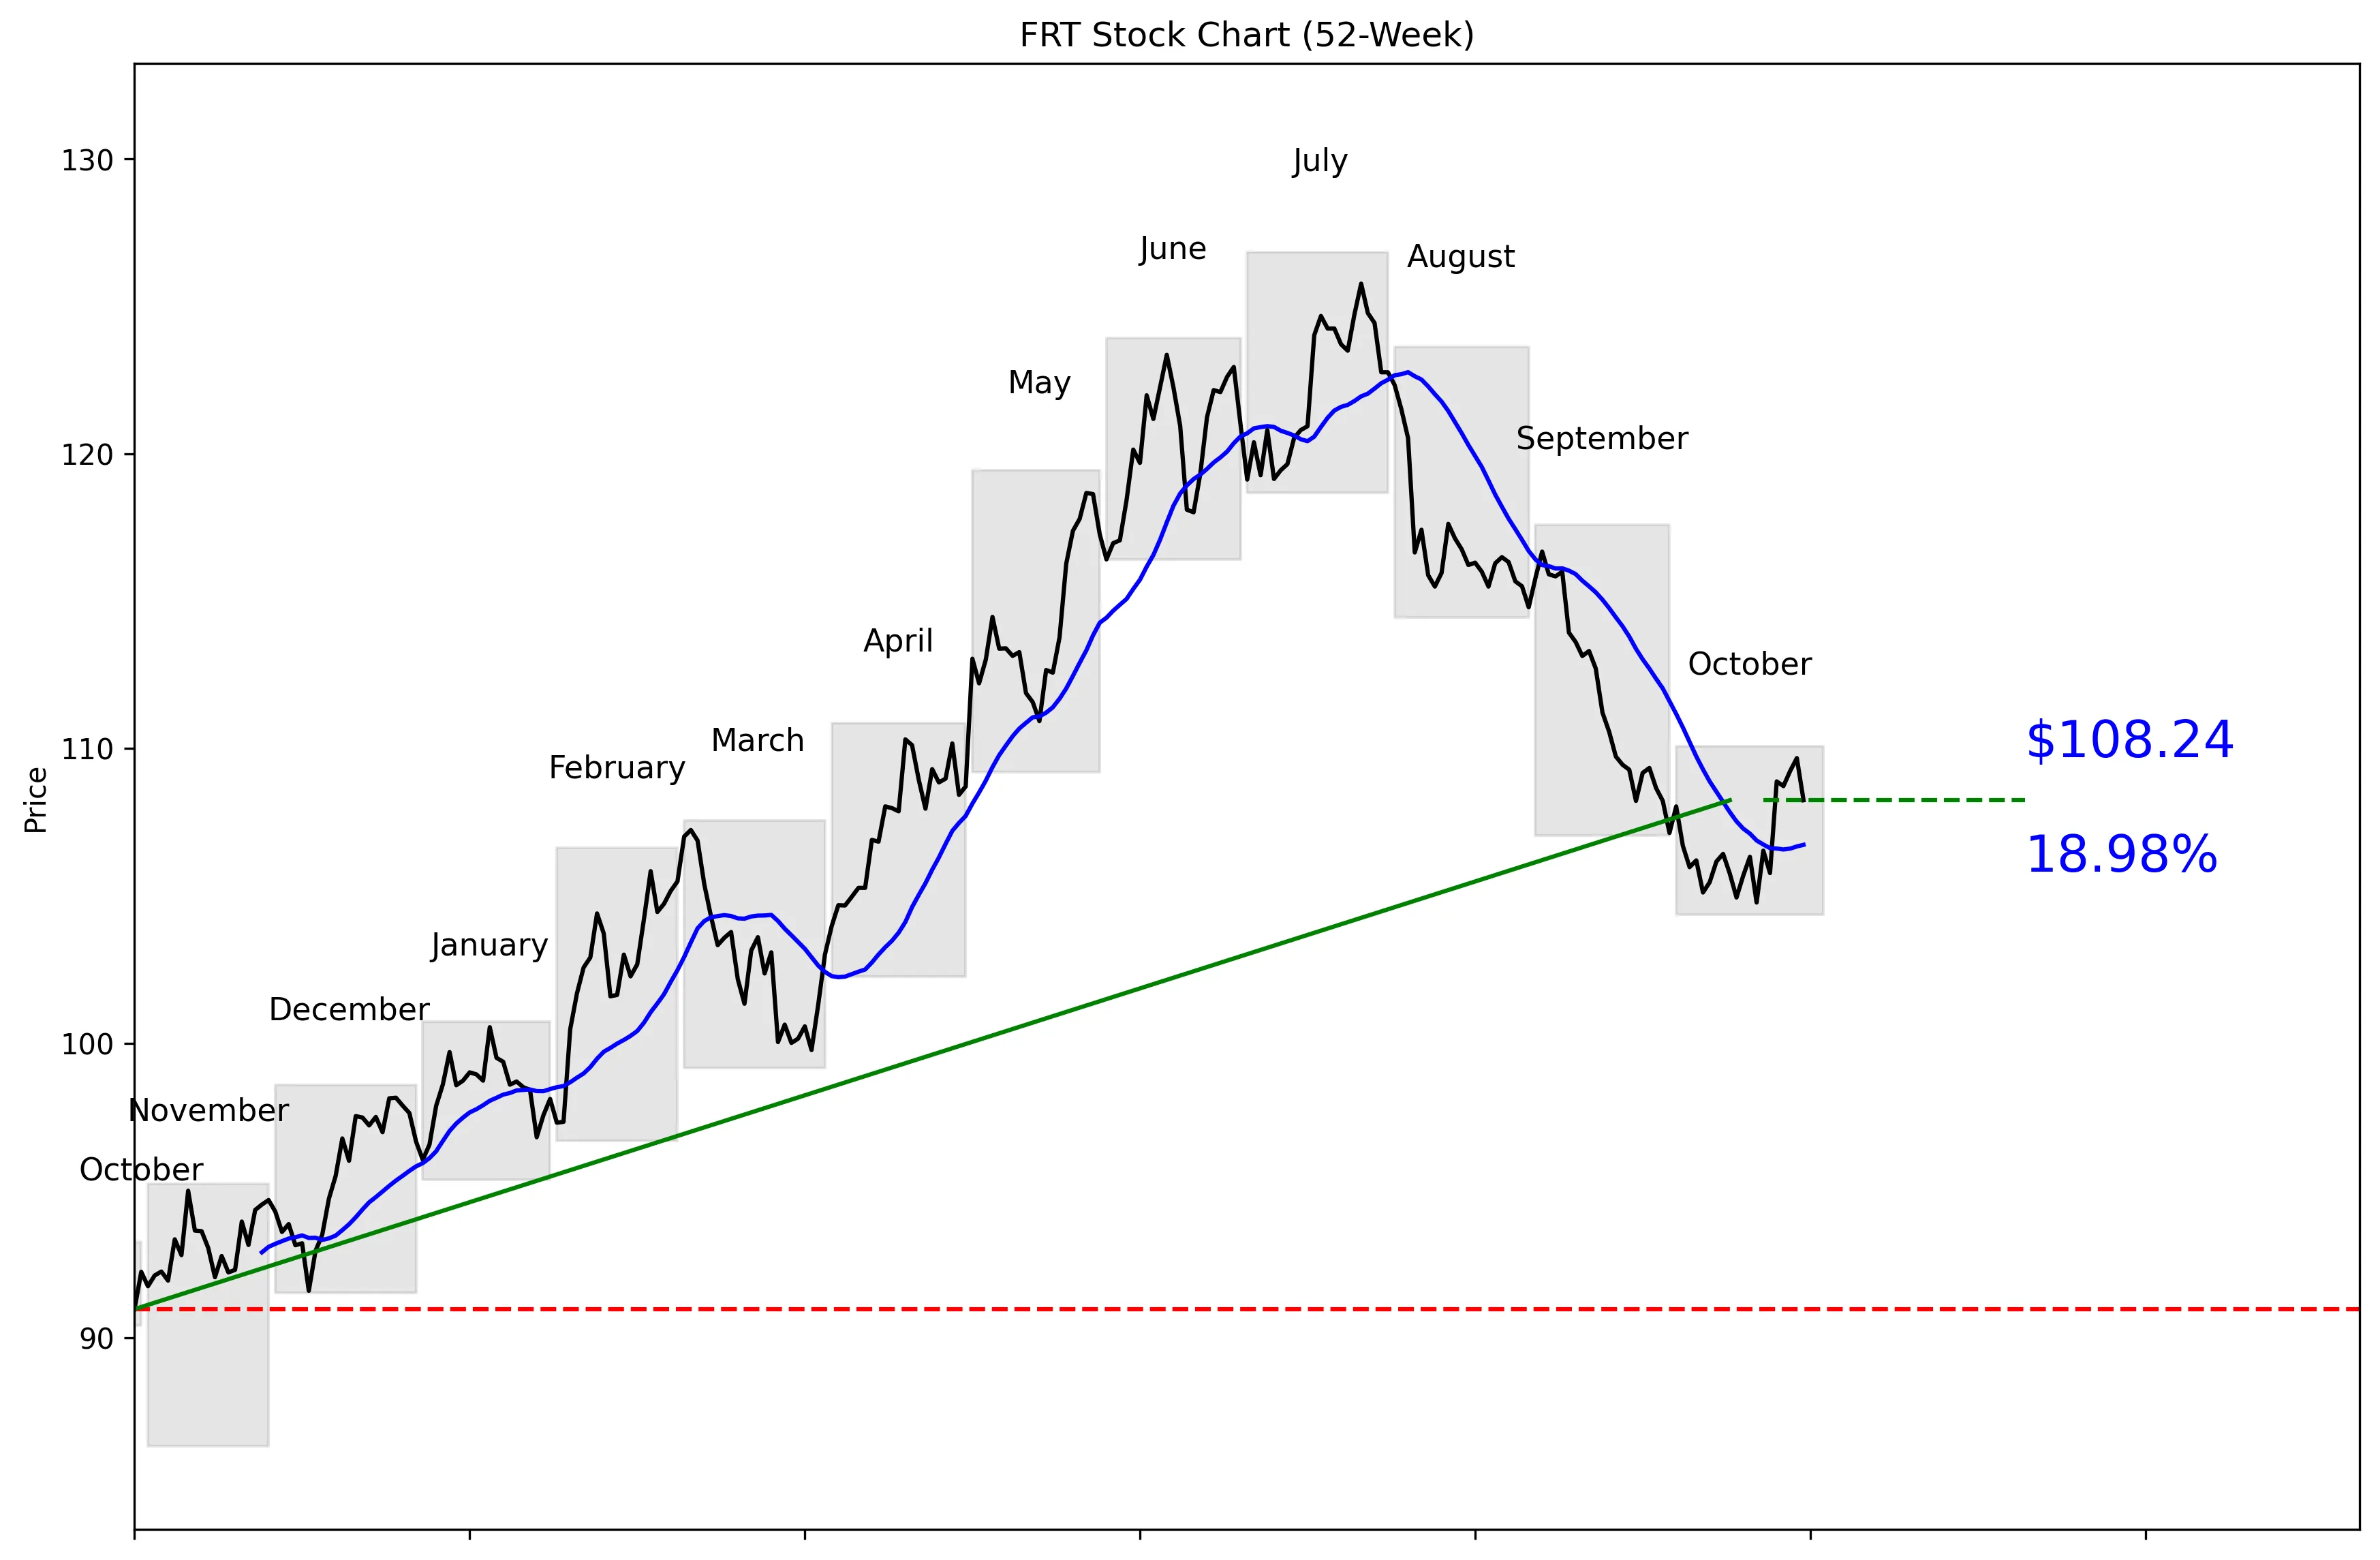
FRT 52-Week Stock Chart
Technical Analysis
FRT trades at $108.95, 54% of the way from its 52-week low of $86.33 to its high of $126.84. The stock is 14.66% below that high and 25.38% above the low. Price is 1.42% above the 20-day moving average of $106.73. Momentum is positive at 2.34% over five trading days and 1.04% over 20 trading days. Near-term support sits at $104.77, while $110.56 is the immediate resistance level.


Recent News and Developments

Wells Fargo cuts FRT price target to $119

Wells Fargo analyst James Feldman lowered the FRT price target from $126 to $119 on October 23 while maintaining an Overweight rating. The 5.6% target cut is cautious, but Wells Fargo still sees attractive risk-reward and expects solid third-quarter results. Source: TipRanks

FRT earnings arrive before Friday’s opening bell

Federal Realty will report third-quarter results before the market opens on October 30, followed by a 9:00 a.m. ET conference call. The published consensus estimate is $1.85 per share. Source: Kiplinger

FRT options price in a potentially large move

The November 20, 2026 $65 put carried some of the highest implied volatility among equity options on October 27. Zacks reported that the current-quarter consensus estimate had slipped from $1.86 to $1.85 over 60 days after three analysts reduced their estimates and none raised them. Source: Zacks


Market Sentiment and Analyst Recommendations

Bull Case
Revenue grew 7.2% to $1.34 billion, giving FRT a real fundamental growth argument. The analyst consensus is buy across 19 analysts. Their average target is $127.37, with estimates ranging from $115.00 to $145.00, all above the current $108.95 price. Wells Fargo maintained its Overweight rating even after reducing its target from $126 to $119. Positive momentum also supports the setup, with shares above the $106.73 moving average and gaining 2.34% over five trading days. The reason to buy here is straightforward: revenue is growing, analysts remain bullish, and the current price remains below every listed analyst target.
Bear Case
FRT is not cheap at 22.01 times earnings. The balance sheet carries $4.85 billion in total debt against only $115.28 million in cash. Wells Fargo’s target reduction from $126 to $119 shows that expectations are moving in the wrong direction even though the rating remains Overweight. The current-quarter consensus estimate slipped from $1.86 to $1.85 over 60 days after three analysts cut estimates and none raised them. Shares also fell 1.3% to $108.24 on October 28 ahead of earnings, showing some caution around the report. A break below $104.77 would weaken the near-term chart, while failure to clear $110.56 would leave the stock stuck below resistance.
What to Watch
Third-quarter results are scheduled before the market opens on October 30, followed by a 9:00 a.m. ET conference call. The published consensus estimate is $1.85 per share, making that the first number to check. Investors should also watch whether the recent estimate cuts continue after the report. On the chart, $110.56 is the first upside test; a move through it would strengthen the current positive momentum. The downside threshold is $104.77, and a break below it would damage the near-term setup. Over the next quarter, the thesis improves if revenue growth holds near 7.2% and analyst targets remain above the current $108.95 price; it weakens if estimates and targets keep falling.
Analyst Consensus
BUY

Based on 19 analyst opinions
Low Target
$115.00
Mean Target
$127.37
High Target
$145.00


Earnings and Financial Data

Sector
Real Estate
Industry
REIT – Retail
Employees
314
Earnings & Dividends
Next Earnings
Oct 30, 2026
EPS (Trailing)
$4.95
Dividend Yield
423.0%
Payout Ratio
91.3%

Frequently Asked Questions

Is FRT a good stock to buy?
The current recommendation is buy based on 19 analysts, and revenue growth is 7.2%. The clear takeaway is that analysts favor FRT, but its 22.01 P/E and $4.85 billion debt still matter.
What is FRT’s price target?
The average analyst target is $127.37, with a range from $115.00 to $145.00. The clear takeaway is that every listed target is above the current $108.95 price.
What is FRT’s 52-week high and low?
The technical price series shows a 52-week high of $126.84 and a low of $86.33. The clear takeaway is that FRT sits 54% of the way from that low to that high.
What are FRT’s support and resistance levels?
Near-term support is the 30-day low of $104.77, while resistance is the 30-day high of $110.56. The clear takeaway is that those are the immediate levels to monitor.
Does FRT pay a dividend?
The provided data does not include FRT’s dividend rate, yield, or payment history. The clear takeaway is that no dividend conclusion can be made from this dataset.

Related Stock Reports

Disclaimer: This report is for informational purposes only and does not constitute financial advice. The analysis and opinions expressed are those of AltStation.io and should not be relied upon as the sole basis for investment decisions. Always conduct your own research and consult with a qualified financial advisor before making investment decisions. Past performance does not guarantee future results. Updated October 29, 2026.