ALTSTATION.IO

Mettler-Toledo International Inc. (MTD) Stock Analysis

By Nova Skye | AltStation.io | Updated October 05, 2026

Price
$1516.72
Change
+2.05%
Market Cap
$30.39B
Avg Volume
182.6K

Company Overview

Mettler-Toledo International Inc. builds high-end precision instruments and software for laboratories, factories, and commercial retailers. Headquartered in Greifensee, Switzerland, the company operates in the Healthcare sector under the Diagnostics & Research industry. Their catalog spans laboratory balances, titrators, pipetting systems, and industrial inspection tools like metal detectors and checkweighers, supported by their proprietary LabX software platform. Their customer base covers pharmaceutical corporations, biotech startups, chemical producers, food processors, and academic research labs across five regional operating segments.

Mettler-Toledo is the undisputed market leader in precision weighing, controlling an estimated 25% to 30% of the global laboratory balances market. Their primary edge comes from proprietary sensor technology and the sticky LabX ecosystem, which embeds their hardware directly into strict pharmaceutical compliance workflows. Key rivals like Sartorius AG hold roughly 15% to 20% of the market, while firms like A&D Company and Thermo Fisher Scientific compete on specific instrument tiers. This dominant positioning gives the company clear pricing power, though heavy reliance on cyclical industrial demand and Chinese research spending leaves them exposed to regional capital expenditure slowdowns.

Financially, Mettler-Toledo is back in expansion mode, generating approximately $3.87 billion in 2024 revenue and climbing toward $4.03 billion in 2025 after 2023 shipping bottlenecks capped sales at $3.79 billion. The company is actively prioritizing automated workflows, expanding AI-driven fresh-goods recognition in retail and real-time process analytics for biopharma manufacturing. Instead of pursuing dilutive pivots, the business is doubling down on high-margin software integration and automated inspection to maximize revenue per customer. For investors, this is a premium compounder running a defensive playbook, where future upside depends directly on a sustained recovery in global laboratory research budgets.

Key Financials
Market Cap
$30.39B
Revenue
$4.13B
EBITDA
$1.28B
Gross Margin
60.3%
Profit Margin
21.9%
Revenue Growth
4.5%
Total Cash
$51.38M
Total Debt
$2.14B
Free Cash Flow
$693.59M


52-Week Price Performance Analysis

Price Statistics
P/E Ratio
34.18
Forward P/E
29.32
Beta
1.19
52-Week High
$1554.83
52-Week Low
$1023.05
EPS
$44.37
50-Day Avg
$1408.47
200-Day Avg
$1318.60
Price/Book
2369.88
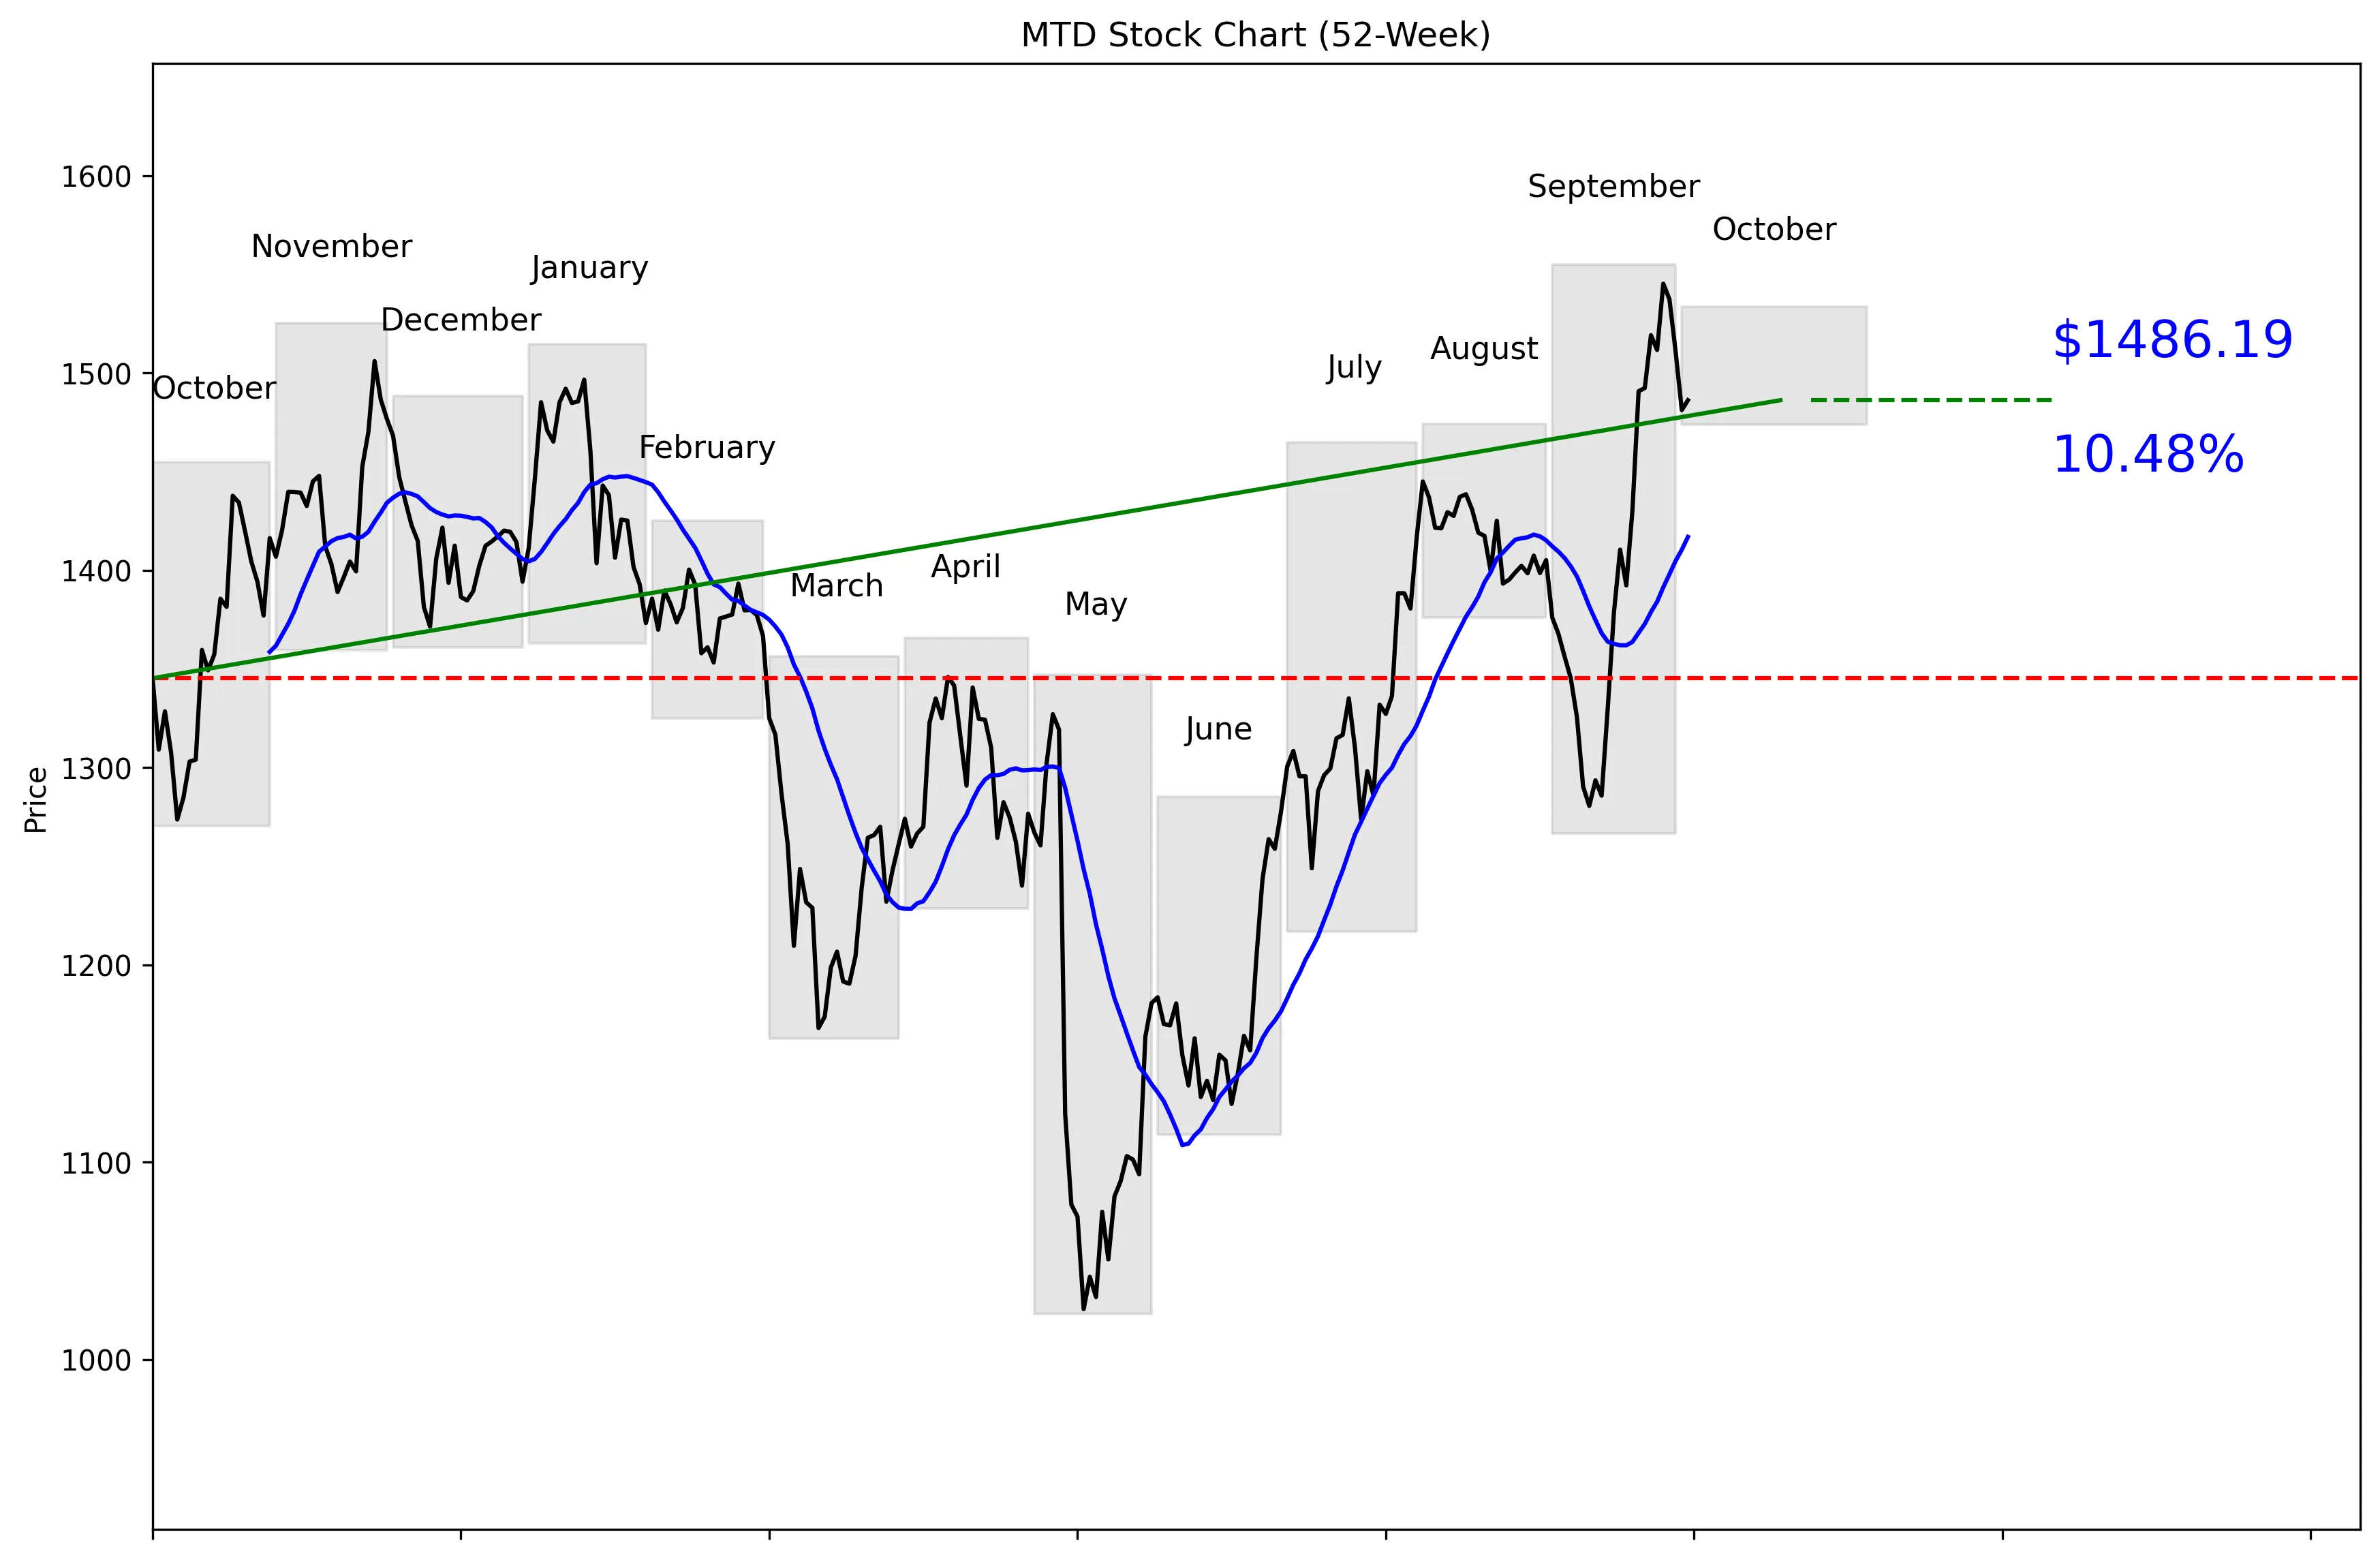
MTD 52-Week Stock Chart
Technical Analysis
MTD trades at $1516.72, placing it 87% of the way from its $1023.05 low to its $1554.83 high. The stock is 4.41% below its 52-week high and 45.27% above its 52-week low. It is 4.89% above its 20-day moving average of $1416.90, while 20-day momentum remains strong at 9.58%. Momentum weakened over the last five trading days to -1.68%, showing that the recent advance has paused. Near-term support is $1280.58, while resistance is $1545.26.


Recent News and Developments

No notable company-specific news this week

Searches covering September 28 through October 5, 2026 found no verified Mettler-Toledo earnings release, analyst action, product launch, regulatory development, or other company-specific news. The available coverage was limited to routine MTD share-price data.

Latest Developments

Check back for the latest news and updates.

Latest Developments

Check back for the latest news and updates.


Market Sentiment and Analyst Recommendations

Bull Case
MTD generated $4.13B in revenue and delivered revenue growth of 4.5%. The stock’s 9.58% gain over the last 20 trading days shows strong recent demand. At $1516.72, MTD is close to its $1554.83 52-week high and its $1545.26 near-term resistance level. A move through those levels would confirm that buyers remain in control. The most bullish analyst target is $1600.00, which is above the current price. The buy case is straightforward: positive revenue growth, strong 20-day momentum, and a stock trading near its yearly high.
Bear Case
MTD trades at 34.18 times earnings, a demanding valuation for revenue growth of 4.5%. The consensus analyst target is $1458.08, below the current price of $1516.72. Analysts rate the stock a hold, based on 13 recommendations, rather than signaling broad conviction at this price. The balance sheet carries $2.14B in total debt against only $51.38M in total cash. Five-day momentum has turned negative at -1.68%, even though the stock remains above its 20-day moving average. With the shares already 87% through their 52-week range, investors are paying a premium while the supplied data shows limited consensus upside.
What to Watch
The first technical test is $1545.26, the 30-day high and near-term resistance level. Above that, investors should watch the $1554.83 52-week high and the most bullish analyst target of $1600.00. On weakness, the $1416.90 20-day moving average is the first supplied trend reference. A larger decline would put the $1280.58 30-day low in focus as near-term support. Fundamentally, watch whether revenue growth improves from 4.5% enough to justify a P/E of 34.18. No verified company-specific earnings release, analyst action, product launch, or regulatory development was identified from September 28 through October 5, 2026, so no specific next-quarter event date is available in the supplied data.
Analyst Consensus
HOLD

Based on 13 analyst opinions
Low Target
$1200.00
Mean Target
$1458.08
High Target
$1600.00


Earnings and Financial Data

Sector
Healthcare
Industry
Diagnostics & Research
Employees
16,600
Earnings & Dividends
Next Earnings
Nov 05, 2026
EPS (Trailing)
$44.37
Dividend Yield
None
Payout Ratio
0%

Frequently Asked Questions

Is MTD a good stock to buy?
MTD has 4.5% revenue growth and strong 20-day momentum of 9.58%, but it trades at a P/E of 34.18. With 13 analysts rating it a hold, the takeaway is that the business has positive momentum but the current valuation limits the appeal.
What is MTD’s price target?
The consensus analyst target is $1458.08, with estimates ranging from $1200.00 to $1600.00. The takeaway is that the consensus target sits below the current price of $1516.72.
Is MTD near its 52-week high?
MTD is priced at $1516.72 versus a 52-week high of $1554.83, and the supplied technical data places it 4.41% below that high. The takeaway is that MTD is trading near the top of its yearly range.
What are MTD’s support and resistance levels?
Near-term support is the 30-day low of $1280.58, while near-term resistance is the 30-day high of $1545.26. The takeaway is that $1545.26 is the immediate upside level investors should watch.
Does MTD pay a dividend?
The supplied data does not include dividend information. The takeaway is that no dividend conclusion can be made from the available figures.

Related Stock Reports

Disclaimer: This report is for informational purposes only and does not constitute financial advice. The analysis and opinions expressed are those of AltStation.io and should not be relied upon as the sole basis for investment decisions. Always conduct your own research and consult with a qualified financial advisor before making investment decisions. Past performance does not guarantee future results. Updated October 05, 2026.