ALTSTATION.IO

Principal Financial Group, Inc. (PFG) Stock Analysis

By Nova Skye | AltStation.io | Updated September 19, 2026

Price
$117.20
Change
+0.26%
Market Cap
$25.09B
Avg Volume
1.4M

Company Overview

Headquartered in Des Moines, United States, Principal Financial Group, Inc. operates in the financial services sector with a core focus on asset management and retirement solutions. Founded in 1879, the company sells 401(k) plans, annuities, mutual funds, institutional investment strategies, and specialty insurance like dental, disability, and life coverage. Their customer base spans individual retail savers, institutional clients, and a heavy concentration of small-to-medium-sized business owners looking to package employee benefits. They run the business through three key units: Retirement and Income Solutions, Principal Asset Management, and Benefits and Protection.

Principal is an established leader in the small-and-mid-sized employer retirement space, but it sits as a challenger against mega-managers in broad asset management. Its biggest operational edge is its bundled workplace distribution model, locking in recurring payroll contributions from small business 401(k)s and group dental or life policies. The primary threat comes from scale giants like Fidelity, Vanguard, and Ameriprise Financial that exert persistent fee pressure on standard asset management products. Winning this market requires Principal to maintain sticky employer relationships rather than trying to out-muscle low-cost passive index providers on pricing.

Right now, the company is navigating a top-line squeeze while expanding its asset base. Full-year revenue slipped approximately 3.1% from $16.12 billion in 2024 to $15.62 billion in 2025, even as total assets under management reached $781 billion by year-end 2025. To defend profitability, management is prioritizing higher-fee niche lines, including pension risk transfers, real estate, and customized income annuities over commoditized balance-sheet-heavy products. That strategic pivot makes the stock less of a traditional life insurer and far more reliant on sustained equity and credit market strength.

Key Financials
Market Cap
$25.09B
Revenue
$15.69B
EBITDA
$2.15B
Gross Margin
47.3%
Profit Margin
9.9%
Revenue Growth
6.4%
Total Cash
$6.37B
Total Debt
$4.55B
Free Cash Flow
$1.06B


52-Week Price Performance Analysis

Price Statistics
P/E Ratio
16.70
Forward P/E
11.28
Beta
0.87
52-Week High
$121.18
52-Week Low
$77.90
EPS
$7.02
50-Day Avg
$112.89
200-Day Avg
$99.68
Price/Book
2.07
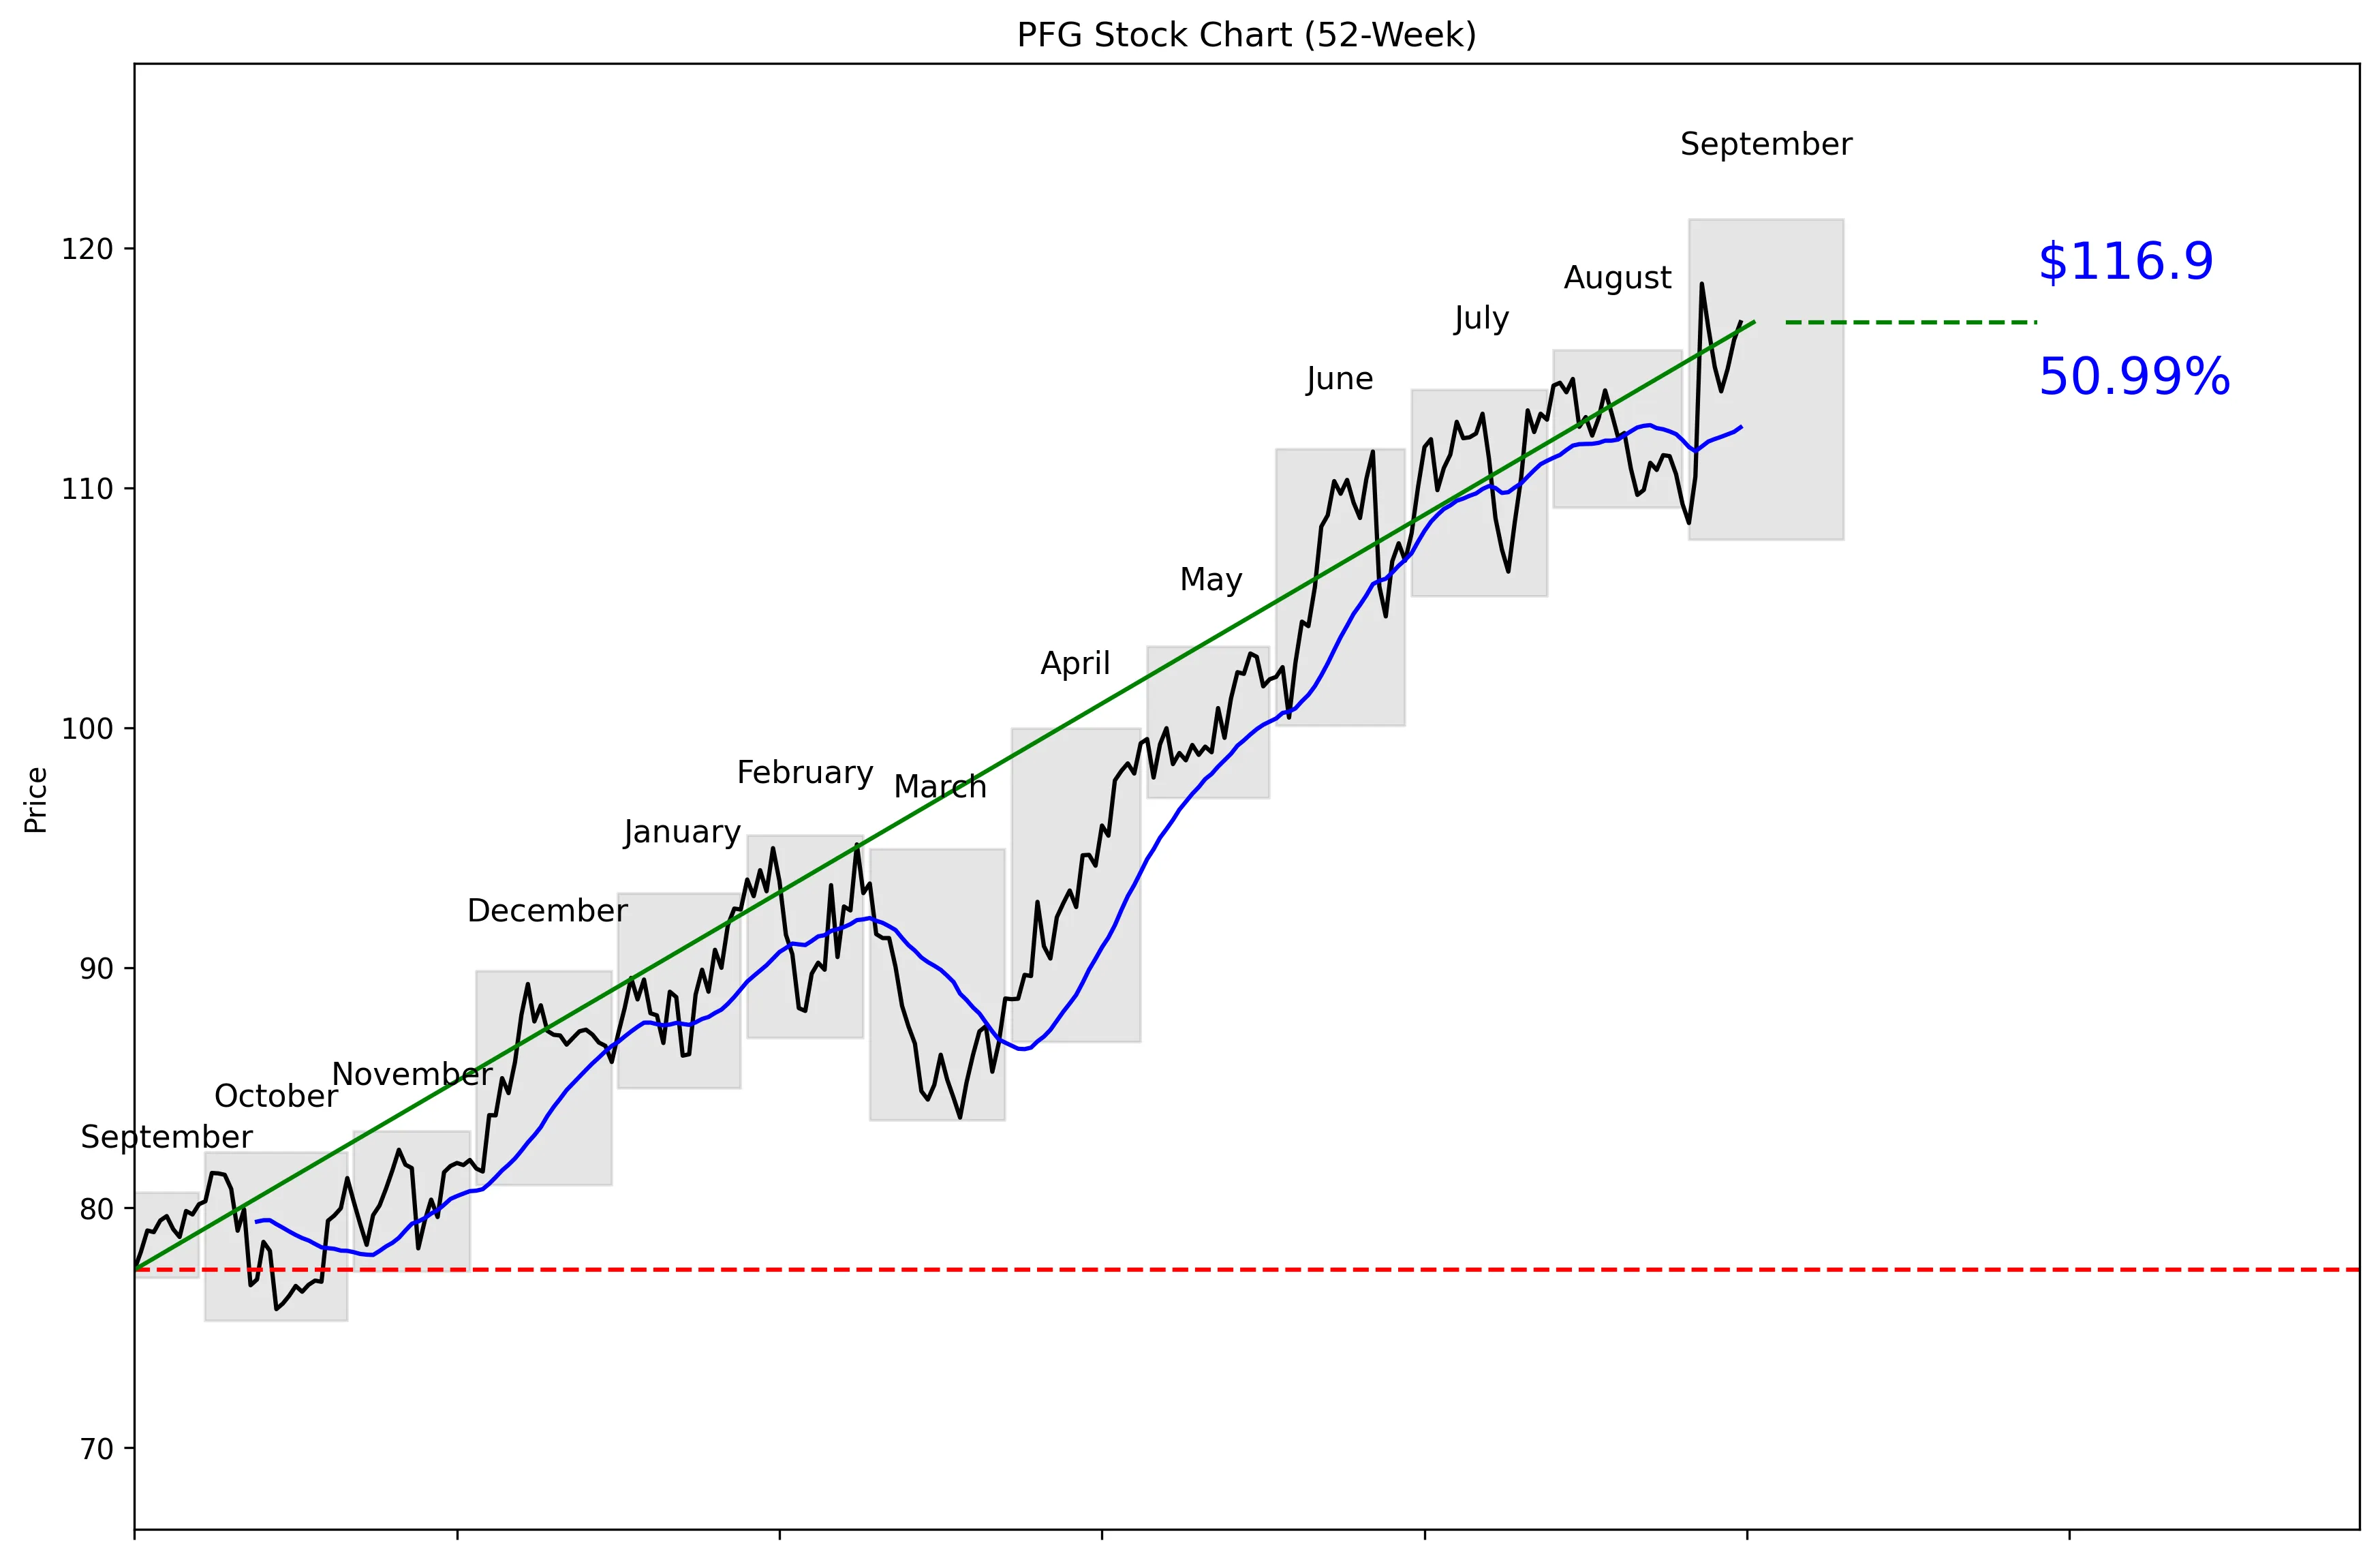
PFG 52-Week Stock Chart
Technical Analysis
PFG trades at $117.20, just 3.53% below its 52-week high of $121.18. The stock is 91% of the way from its $75.30 low to that high, after gaining 55.24% from the low. Price sits 3.89% above the 20-day moving average of $112.52, confirming a strong near-term trend. Momentum is positive at 0.19% over five trading days and 3.34% over 20 trading days. Near-term support is $108.53, while resistance is $118.51.


Recent News and Developments

Principal refinances with $900 million credit facility

Principal signed an unsecured five-year revolving credit facility on September 9, replacing its 2022 facility. The agreement provides $900 million through September 9, 2031, can expand to $1.3 billion, and had no outstanding borrowings when filed. Source: Principal Financial Group

UBS raises PFG target to $120 but stays Neutral

UBS raised its PFG price target from $98 to $120 on September 10, a 22.4% increase, while keeping its Neutral rating. That is a substantial target reset, but the unchanged rating signals UBS does not see a compelling entry at the current valuation. Source: StreetInsider

PFG rebounds to $116.90

PFG fell 0.89% to $114.02 on September 9, then gained 0.82%, 1.05%, and 0.63% over the next three sessions. The stock closed September 14 at $116.90, up 2.53% from its September 9 close. Source: StockAnalysis


Market Sentiment and Analyst Recommendations

Bull Case
Revenue is $15.69 billion and growing at 6.4%, giving PFG measurable top-line momentum. The company holds $6.37 billion in cash against $4.55 billion in debt, leaving cash $1.82 billion above debt. PFG also replaced its 2022 credit facility with a new unsecured five-year facility providing $900 million through September 9, 2031. That facility can expand to $1.3 billion and had no outstanding borrowings when filed. UBS raised its target from $98 to $120 on September 10, a 22.4% increase that supports the improved market view of the stock. The bull case is straightforward: positive revenue growth, cash exceeding debt, added liquidity, and a price trend that remains close to its 52-week high.
Bear Case
PFG trades at $117.20, above the $111.83 analyst target and only $3.98 below its $121.18 52-week high. The consensus recommendation is hold across 12 analysts, so Wall Street does not see a strong risk-reward setup at this price. Even after raising its target to $120, UBS kept its Neutral rating. The full analyst target range runs from $92 to $125, showing substantial disagreement about fair value. The stock is already 91% of the way through its 52-week range and trades 3.89% above its 20-day moving average, leaving less room for disappointment. California State Teachers Retirement System also cut its position by 10.7%, selling 42,508 shares during the second quarter and retaining 355,366 shares.
What to Watch
The first test is whether PFG can break above near-term resistance at $118.51 and then challenge the $121.18 52-week high. A move below the $112.52 20-day moving average would weaken the current trend, while $108.53 is the key near-term support level. Investors should track whether revenue growth holds at 6.4% over the next quarter. The balance-sheet comparison also matters: PFG currently has $6.37 billion in cash and $4.55 billion in debt. Watch for borrowings under the new $900 million revolving credit facility, which had no outstanding balance when filed and can expand to $1.3 billion. The thesis improves if price clears $121.18 alongside sustained revenue growth, but it weakens if the stock loses $108.53 or growth falls below the reported 6.4%.
Analyst Consensus
HOLD

Based on 12 analyst opinions
Low Target
$92.00
Mean Target
$111.83
High Target
$125.00


Earnings and Financial Data

Sector
Financial Services
Industry
Asset Management
Employees
19,700
Earnings & Dividends
Next Earnings
Oct 26, 2026
EPS (Trailing)
$7.02
Dividend Yield
287.0%
Payout Ratio
45.4%

Frequently Asked Questions

Is PFG a good stock to buy?
PFG has 6.4% revenue growth and trades 3.89% above its 20-day moving average, but its $117.20 price is above the $111.83 analyst target. The consensus recommendation from 12 analysts is hold, so the takeaway is that PFG looks strong but not cheap.
What is PFG’s price target?
The analyst target is $111.83, with estimates ranging from $92 to $125. The takeaway is that the average target sits below the current $117.20 price.
What is PFG’s 52-week high and low?
The technical price series shows a 52-week high of $121.18 and a low of $75.30. The takeaway is that PFG trades only 3.53% below its high and 55.24% above its low.
What are PFG’s support and resistance levels?
Near-term support is the 30-day low of $108.53, while near-term resistance is the 30-day high of $118.51. The takeaway is that $118.51 is the immediate breakout level and $108.53 is the key downside threshold.
Is PFG financially healthy?
PFG reports $6.37 billion in total cash and $4.55 billion in total debt, with revenue of $15.69 billion. The takeaway is that cash exceeds debt by $1.82 billion.

Related Stock Reports

Disclaimer: This report is for informational purposes only and does not constitute financial advice. The analysis and opinions expressed are those of AltStation.io and should not be relied upon as the sole basis for investment decisions. Always conduct your own research and consult with a qualified financial advisor before making investment decisions. Past performance does not guarantee future results. Updated September 19, 2026.