ALTSTATION.IO

General Mills, Inc. (GIS) Stock Analysis

By Nova Skye | AltStation.io | Updated October 10, 2026

Price
$32.00
Change
-1.83%
Market Cap
$17.11B
Avg Volume
9.7M

Company Overview

General Mills is a packaged foods staple in the Consumer Defensive sector, headquartered in Minneapolis, Minnesota. Founded in 1866, the company manufactures and sells branded foods spanning ready-to-eat cereal, convenient meals, baking mixes, snacks, and pet food. Its massive portfolio includes household names like Cheerios, Nature Valley, Pillsbury, and Blue Buffalo. They sell directly to grocery stores, mass merchandisers, discount chains, e-commerce outlets, foodservice operators, and also maintain 232 company-operated and 376 franchised ice cream parlors.

General Mills sits as a clear market leader in North American retail grocery, not a niche challenger. The business is organized into four core segments: North America Retail, International, North America Pet, and North America Foodservice. Its competitive advantage is sheer shelf dominance across legacy brands like Betty Crocker, Häagen-Dazs, and Old El Paso, giving it dependable distribution reach. The primary vulnerability is consumer migration away from traditional packaged foods and ready-to-eat cereals toward private-label store brands.

The company is actively balancing mature center-aisle categories by diversifying into higher-margin pet care and specialty nutrition. Anchored by Blue Buffalo, Tiki Pets, and Edgard & Cooper, its North America Pet segment represents a deliberate push into premium animal wellness alongside human food lines. Selling across drug, dollar, and club stores gives General Mills broad defensive coverage across economic cycles. That brand scale keeps the floor high, but expanding its pet and snacking footprint is critical for actual revenue momentum.

Key Financials
Market Cap
$17.11B
Revenue
$18.30B
EBITDA
$3.42B
Gross Margin
33.7%
Profit Margin
-4.9%
Revenue Growth
-2.8%
Total Cash
$433.10M
Total Debt
$13.62B
Free Cash Flow
$1.30B


52-Week Price Performance Analysis

Price Statistics
P/E Ratio
N/A
Forward P/E
10.15
Beta
0.02
52-Week High
$49.71
52-Week Low
$31.18
EPS
$-1.64
50-Day Avg
$36.79
200-Day Avg
$38.48
Price/Book
2.30
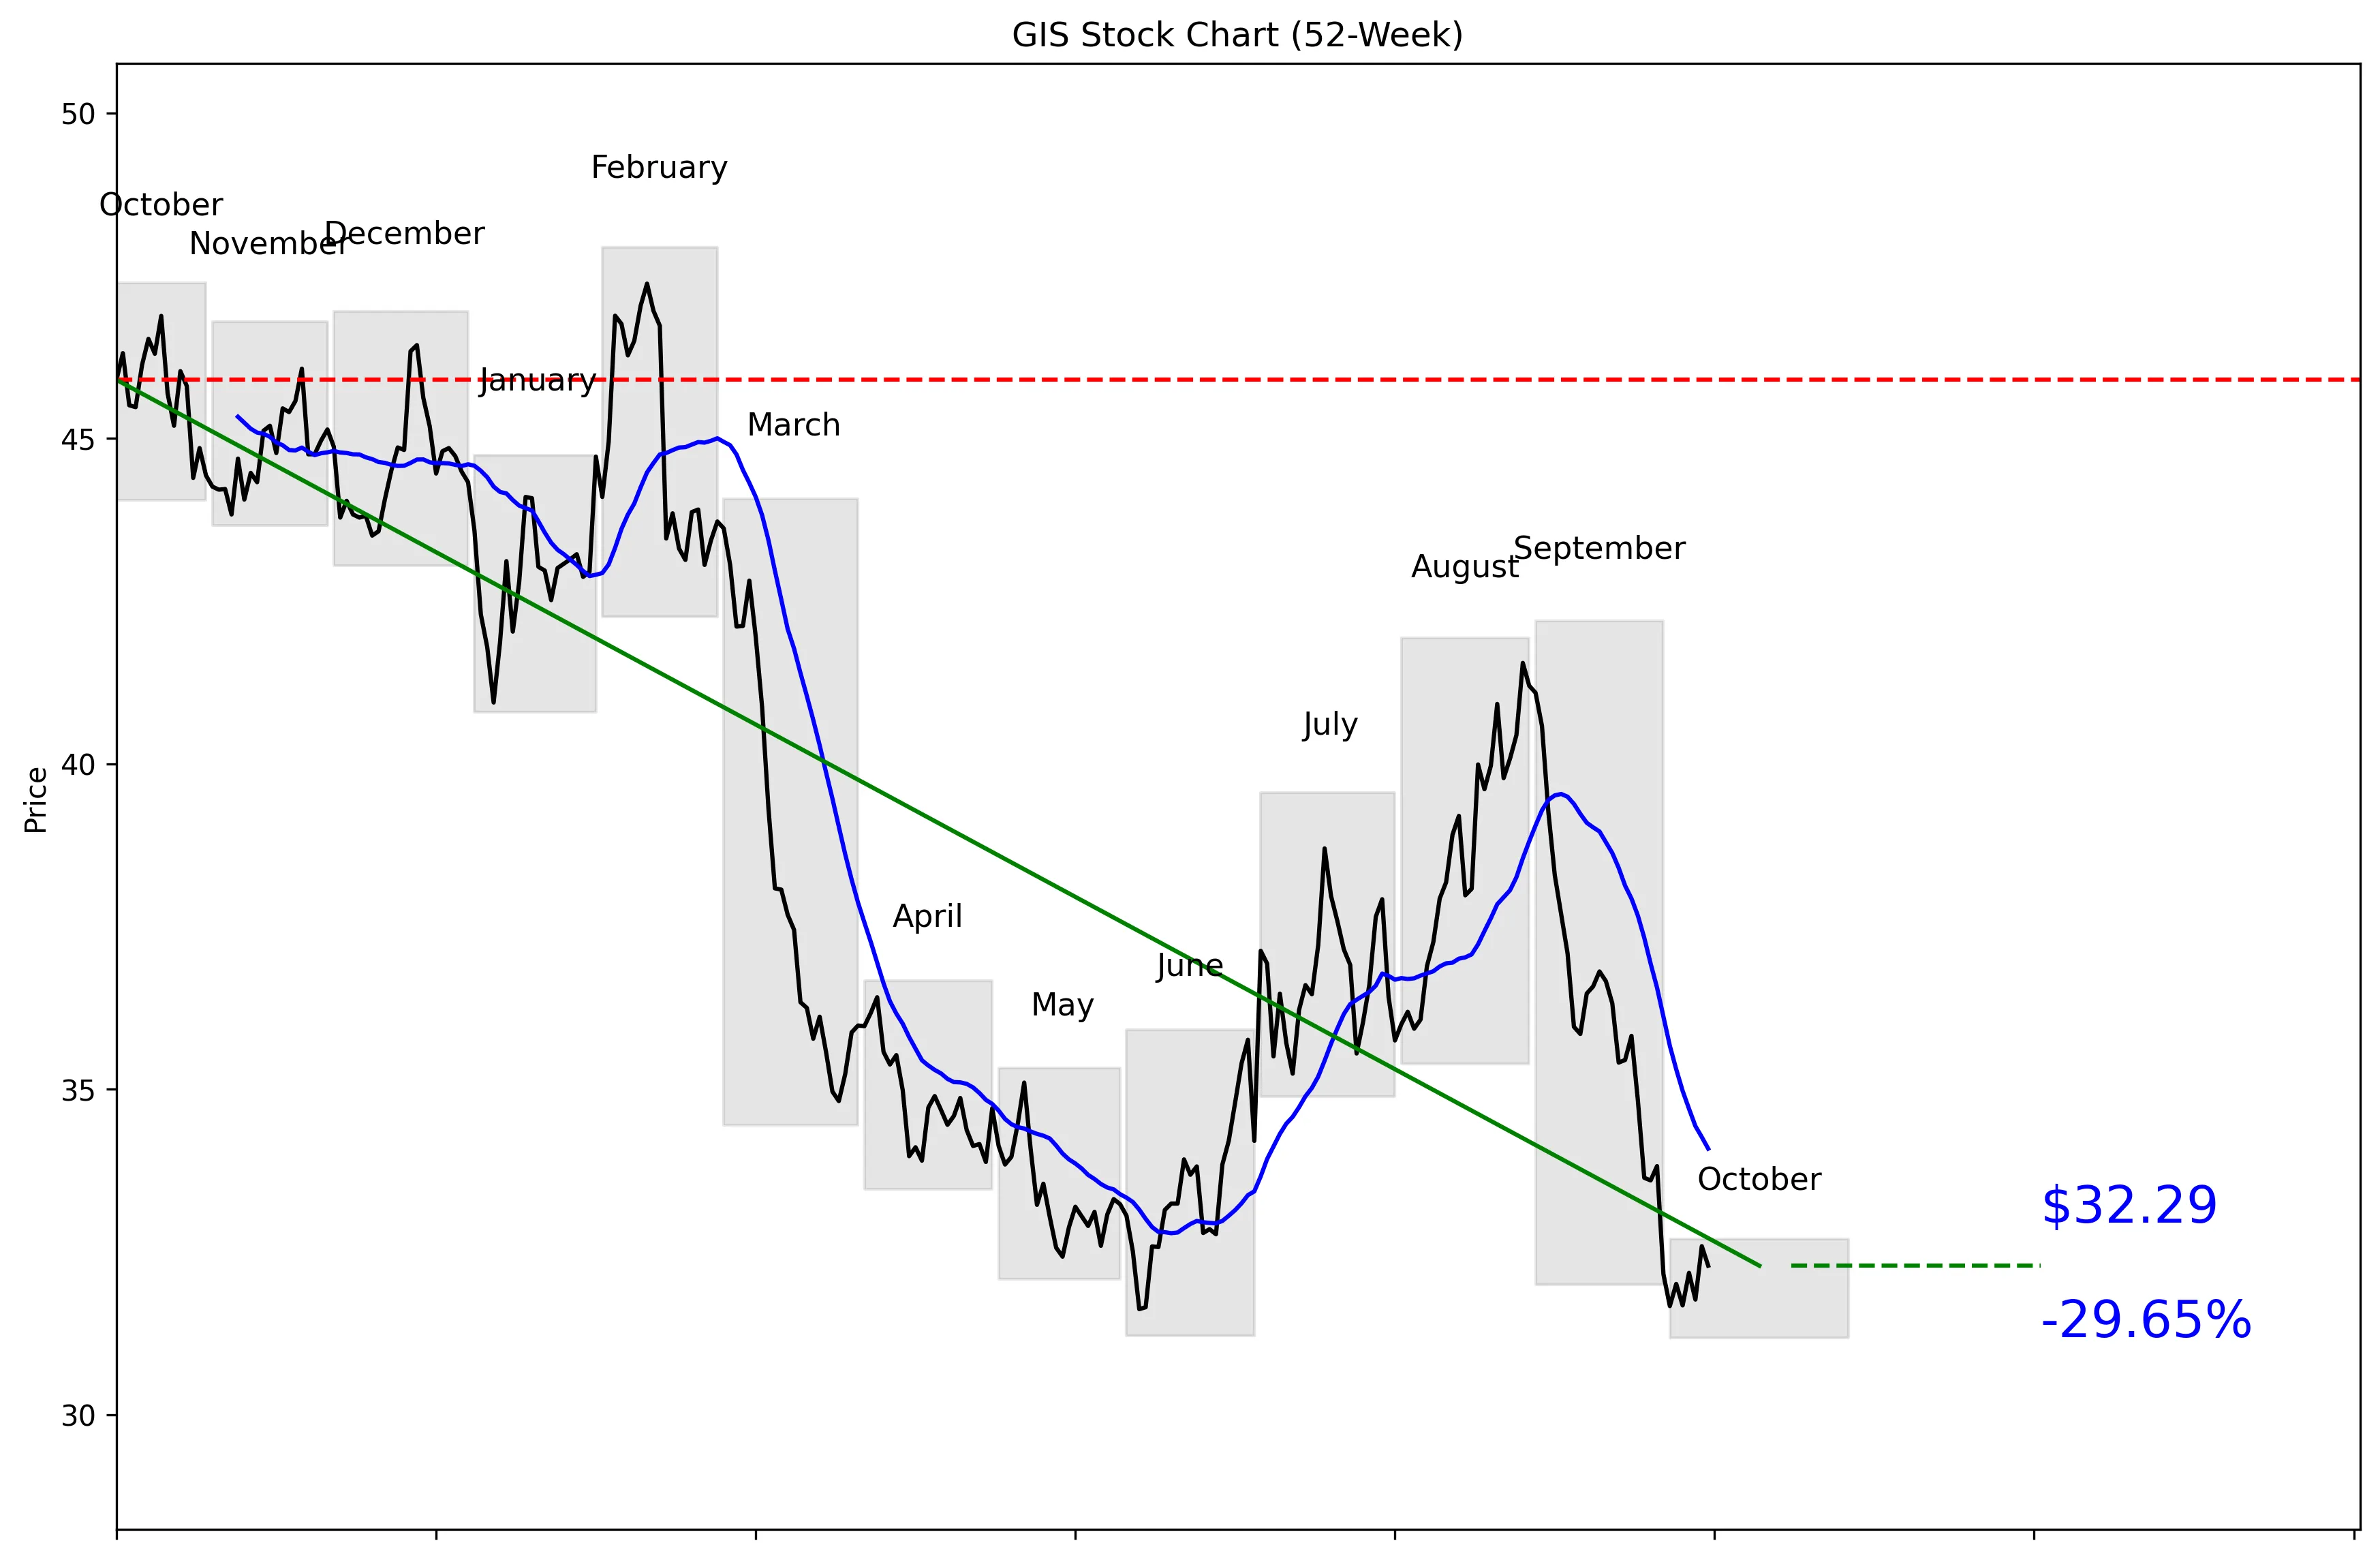
GIS 52-Week Stock Chart
Technical Analysis
GIS trades at $32.00, just 7% of the way from its $31.18 52-week low to its $47.94 high. The stock is 32.64% below that high and only 3.56% above the low. Price sits 5.27% below the 20-day moving average of $34.09, while 20-day momentum is negative 9.93%. Five-day momentum has improved to 0.87%, but that is not enough to reverse the broader decline. Near-term support is $31.67, with resistance far above at $41.55.


Recent News and Developments

General Mills completes senior-note tender offers

General Mills accepted all tendered notes in its five highest-priority series and 51.55% of its 2.875% notes due 2030. The offers expired October 9, with settlement expected October 14. Source: Yahoo Finance

Pillsbury launches limited-time biscuit sandwich shop

Pillsbury partnered with Chain on a Los Angeles pop-up running from October 8 through November 6. The menu includes four biscuit sandwiches, led by an 8.75-inch creation with sausage, egg, fried chicken, peach hot honey, pimento cheese and cinnamon-baked apples. Source: General Mills

General Mills executive sells $197,191 of stock

Segment President Pankaj Sharma sold 6,294 GIS shares at $31.3301 each on October 1, according to a filing reported October 5. He retained direct ownership of 41,325.245 shares after the sale. Source: Investing.com


Market Sentiment and Analyst Recommendations

Bull Case
GIS is trading close to its 52-week low, leaving expectations low and creating room for a recovery. The $37.00 analyst target implies 15.63% upside from $32.00, while the high target of $45.00 implies 40.63% upside. Revenue remains substantial at $18.30 billion compared with a $17.11 billion market cap. Pillsbury’s Los Angeles pop-up, running through November 6, gives General Mills a direct promotional catalyst for a major brand. The five-day gain of 0.87% also suggests selling pressure may be easing near the lows. The bull case is simple: buy a beaten-down company near support and wait for revenue performance and sentiment to stabilize.
Bear Case
Revenue growth is negative 2.8%, so this is not a growth story right now. Total debt stands at $13.62 billion against only $433.10 million in cash, creating a clear balance-sheet concern. No P/E is available, which removes a standard valuation check and makes it harder to argue that the stock is fundamentally cheap. GIS remains 5.27% below its 20-day moving average, and 20-day momentum is negative 9.93%. The stock is only 3.56% above its 52-week low, so another break lower would not require much downside. Segment President Pankaj Sharma’s October 1 sale of 6,294 shares for $197,191 adds another negative signal, even though he retained 41,325.245 shares. With 18 analysts rating GIS a hold, the available evidence supports caution rather than conviction.
What to Watch
The first event is the expected October 14 settlement of General Mills’ senior-note tender offers. Investors should watch whether the debt picture improves from the current $13.62 billion level, especially with cash at only $433.10 million. Pillsbury’s limited-time Los Angeles shop runs through November 6, but the important question is whether brand activity translates into better revenue performance. Revenue growth needs to improve from negative 2.8% for the fundamental thesis to strengthen. On the chart, $31.67 is the immediate support level; a break below it would put the $31.18 52-week low back in focus. A move above the $34.09 20-day moving average would be the first technical improvement, while $41.55 remains the major near-term resistance level. The $37.00 analyst target is achievable only if both weak momentum and declining revenue begin to reverse.
Analyst Consensus
HOLD

Based on 18 analyst opinions
Low Target
$30.00
Mean Target
$37.00
High Target
$45.00


Earnings and Financial Data

Sector
Consumer Defensive
Industry
Packaged Foods
Employees
30,000
Earnings & Dividends
Next Earnings
Dec 23, 2026
EPS (Trailing)
$-1.64
Dividend Yield
749.0%
Payout Ratio
59.4%

Frequently Asked Questions

Is GIS a good stock to buy?
GIS has a hold recommendation from 18 analysts and revenue growth of negative 2.8%. The clear takeaway is that GIS is a wait-and-see stock, not a high-conviction buy.
What is the analyst price target for GIS?
The analyst target is $37.00, with estimates ranging from $30.00 to $45.00. From the current $32.00 price, the takeaway is that analysts see moderate upside but a wide range of possible outcomes.
Is GIS stock near its 52-week low?
GIS is priced at $32.00, just 3.56% above its $31.18 52-week low. The takeaway is that the stock is trading near the bottom of its annual range.
What are GIS stock’s support and resistance levels?
Near-term support is $31.67, while near-term resistance is $41.55. The takeaway is that downside support is close, but the main resistance level is much higher.
How strong is GIS stock’s momentum?
Five-day momentum is positive 0.87%, but 20-day momentum is negative 9.93%, and the stock is 5.27% below its $34.09 20-day moving average. The takeaway is that the short-term bounce has not reversed the broader negative trend.

Related Stock Reports

Disclaimer: This report is for informational purposes only and does not constitute financial advice. The analysis and opinions expressed are those of AltStation.io and should not be relied upon as the sole basis for investment decisions. Always conduct your own research and consult with a qualified financial advisor before making investment decisions. Past performance does not guarantee future results. Updated October 10, 2026.