ALTSTATION.IO

Constellation Energy Corporation (CEG) Stock Analysis

By Nova Skye | AltStation.io | Updated September 22, 2026

Price
$263.44
Change
+0.51%
Market Cap
$93.34B
Avg Volume
3.0M

Company Overview

Headquartered in Baltimore, Maryland, Constellation Energy Corporation operates in the Utilities sector as an independent power producer. Incorporated in 2021, the company generates and sells electricity, natural gas, energy-related products, and sustainable solutions. It supplies power across five operating segments—Mid-Atlantic, Midwest, New York, ERCOT, and Other Power Regions—backed by roughly 31,676 megawatts of generating capacity across nuclear, wind, solar, natural gas, and hydro assets. Its customer base spans residential consumers, commercial and industrial clients, public sector entities, municipalities, cooperatives, and wholesale distribution utilities.

Constellation is the clear market leader in American nuclear energy, operating approximately 22 gigawatts of nuclear capacity across 21 reactors. That nuclear footprint gives the business a durable moat because replicating these massive, zero-carbon generating assets is practically impossible in the current economic environment. Competitors like Vistra and Duke Energy run sizable generation fleets, but Constellation maintains the edge in baseload clean power with plant capacity factors consistently exceeding 93%. The main threat to watch is power price volatility across regional grids, but the structural scarcity of 24/7 clean power keeps Constellation in the driver’s seat.

The company is expanding rapidly, pivoting to secure lucrative, long-term power purchase agreements with hyperscalers and energy-intensive data centers. Federal nuclear production tax credits provide a reliable earnings floor through 2032, effectively de-risking its bottom line against commodity downturns. Constellation is successfully converting its baseline generation into steady, contracted cash flow rather than leaving its output exposed to spot price swings. It is one of the strongest setups in the independent power space today.

Key Financials
Market Cap
$93.34B
Revenue
$31.27B
EBITDA
$7.95B
Gross Margin
22.1%
Profit Margin
11.1%
Revenue Growth
23.0%
Total Cash
$697.00M
Total Debt
$24.70B
Free Cash Flow
-$6.63B


52-Week Price Performance Analysis

Price Statistics
P/E Ratio
25.78
Forward P/E
19.80
Beta
1.12
52-Week High
$412.70
52-Week Low
$228.63
EPS
$10.22
50-Day Avg
$271.37
200-Day Avg
$292.33
Price/Book
2.93
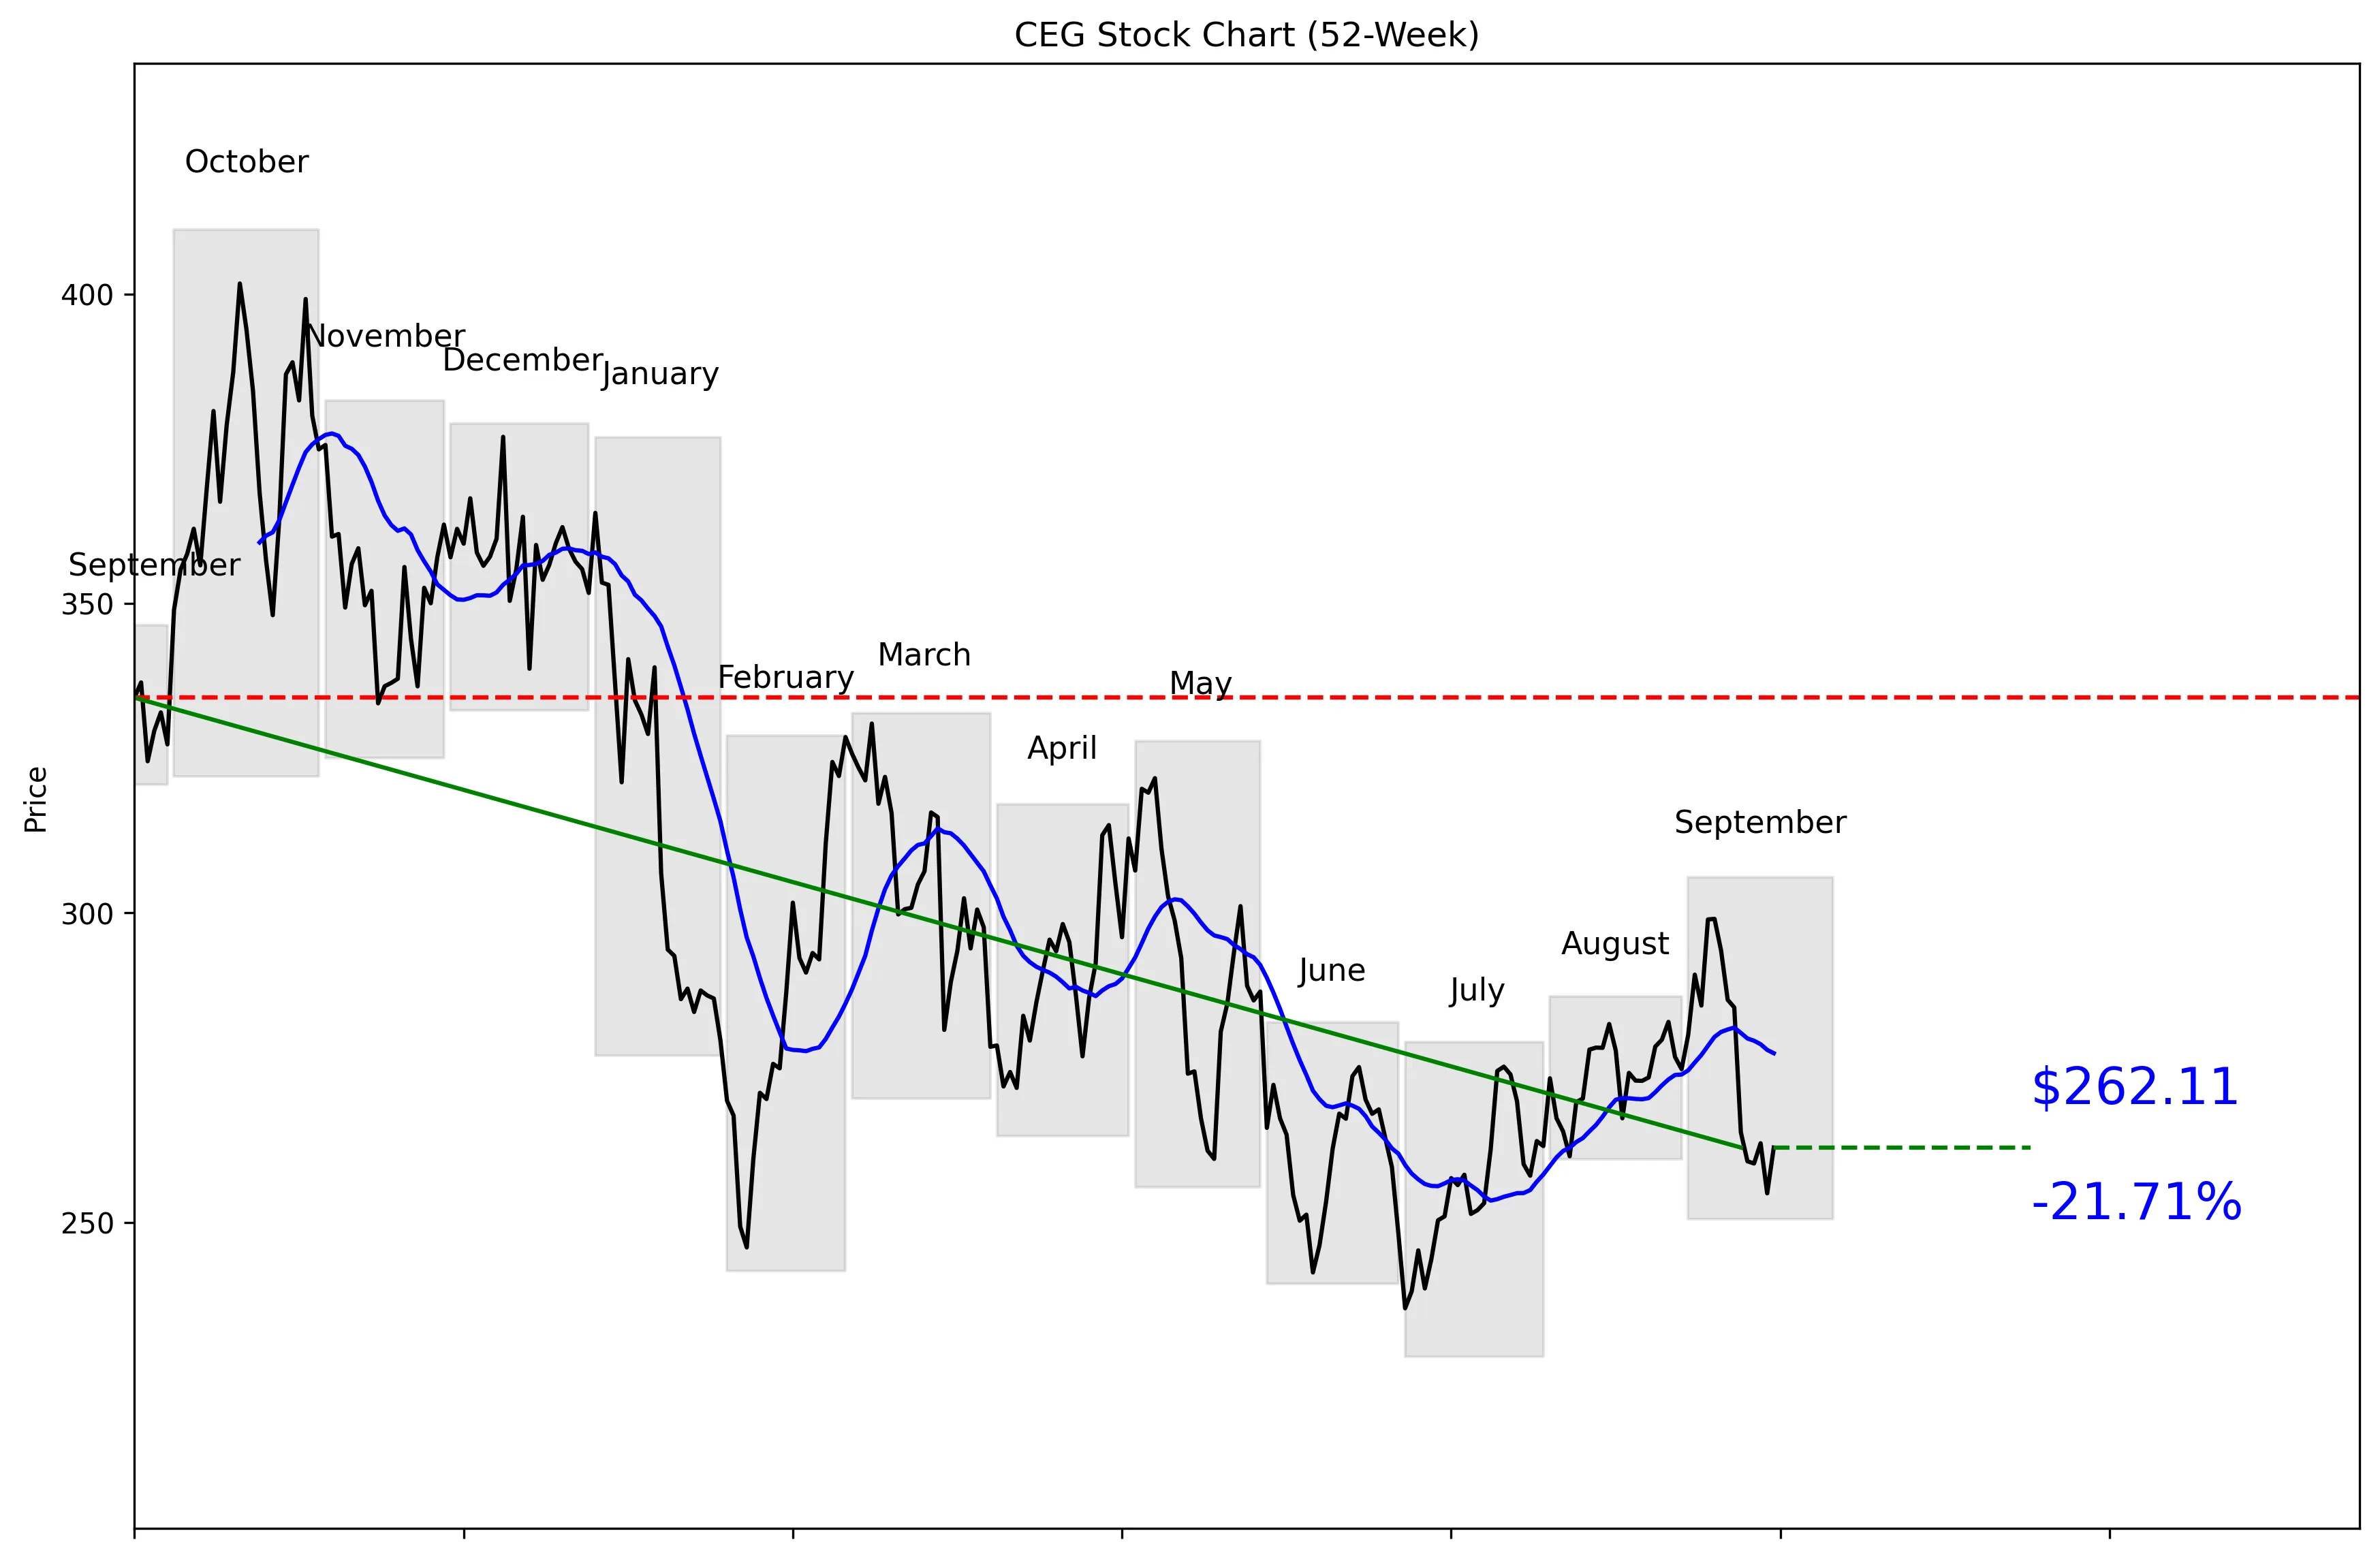
CEG 52-Week Stock Chart
Technical Analysis
CEG trades at $263.44, just 19% of the way from its 52-week low of $228.28 to its 52-week high of $410.41. The stock is 36.13% below that high but remains 14.82% above the low. Price sits 5.49% below the 20-day moving average of $277.35, while five-day and 20-day momentum are negative at 0.93% and 3.95%, respectively. Near-term support is $254.71, and resistance is $299.05. The chart stays weak unless CEG recovers the moving average and starts closing the gap toward resistance.


Recent News and Developments

Morgan Stanley raises CEG price target to $369

Morgan Stanley maintained its Overweight rating on Constellation Energy on September 18. The firm raised its price target by $5, from $364 to $369. Source: Yahoo Finance

Constellation joins flexible-power alliance

Constellation joined the AI Energy Management Alliance alongside Google, Nvidia, Anthropic and other energy and technology companies. The 20-member group will promote data centers that adjust electricity demand to ease pressure on power grids and electricity prices. Source: Axios

NRC discusses Calvert Cliffs license amendments

The Nuclear Regulatory Commission held a closed meeting with Constellation on September 21 concerning upcoming license-amendment requests for Calvert Cliffs Unit 2. The proprietary webinar was scheduled from 2:00 p.m. to 3:00 p.m. Eastern. Source: U.S. Nuclear Regulatory Commission


Market Sentiment and Analyst Recommendations

Bull Case
Revenue is $31.27 billion and is growing 23.0%, giving investors a clear fundamental reason to consider the stock. The analyst consensus is buy across 20 analysts, with an average target of $348.55 and a range of $290.00 to $441.00. Morgan Stanley maintained its Overweight rating on September 18 and raised its target from $364 to $369. CEG also joined the AI Energy Management Alliance alongside Google, Nvidia, Anthropic and other energy and technology companies. That alliance puts Constellation directly inside the discussion about managing data-center electricity demand and grid pressure. At $263.44, the stock trades below even the low end of the analyst target range, so the upside case is meaningful if revenue growth holds and sentiment recovers.
Bear Case
The stock trades at 25.78 times earnings, which leaves little room for disappointing growth or execution. Total debt is $24.70 billion against just $697.00 million in cash, creating a major balance-sheet imbalance. The chart is also damaged: CEG is 36.13% below its 52-week high and 5.49% below its 20-day moving average. Five-day momentum is negative 0.93%, while 20-day momentum is negative 3.95%. The September 21 rebound of 2.91% came immediately after a 3.08% decline on September 18, showing that volatility remains high. A break below $254.71 would weaken the near-term setup and put more focus on the 52-week low of $228.28.
What to Watch
The first level to monitor is $254.71, the 30-day low and current near-term support. A sustained move above the $277.35 20-day moving average would be the first sign that short-term momentum is improving. The larger technical test is $299.05, the 30-day high and near-term resistance. Investors should watch whether revenue growth remains near 23.0%, because the 25.78 P/E depends on continued growth. The Nuclear Regulatory Commission’s September 21 meeting with Constellation concerned upcoming license-amendment requests for Calvert Cliffs Unit 2, making that regulatory process worth tracking. Morgan Stanley’s new $369 target and the broader analyst range of $290.00 to $441.00 provide clear benchmarks for whether Wall Street confidence strengthens or fades over the next quarter.
Analyst Consensus
BUY

Based on 20 analyst opinions
Low Target
$290.00
Mean Target
$348.55
High Target
$441.00


Earnings and Financial Data

Sector
Utilities
Industry
Utilities – Independent Power Producers
Employees
15,291
Earnings & Dividends
Next Earnings
Nov 09, 2026
EPS (Trailing)
$10.22
Dividend Yield
65.0%
Payout Ratio
15.9%

Frequently Asked Questions

Is CEG a good stock to buy?
The recommendation is buy based on 20 analysts, and revenue growth is 23.0%. The clear takeaway is that analysts are bullish, but the stock’s negative short-term momentum still matters.
What is CEG’s price target?
The average analyst target is $348.55, with estimates ranging from $290.00 to $441.00. The takeaway is that every listed target is above the current $263.44 price.
What is CEG’s 52-week range?
The supplied key data lists a range of $228.63 to $412.70, while the actual price-series calculation shows a low of $228.28 and a high of $410.41. The takeaway is that CEG currently sits near the lower end of its yearly trading range.
What are CEG’s support and resistance levels?
Near-term support is the 30-day low of $254.71, while near-term resistance is the 30-day high of $299.05. The takeaway is that these are the key boundaries for the current trading range.
Does CEG pay a dividend?
Dividend information is not included in the supplied data, so no dividend amount or yield can be confirmed here. The takeaway is to verify the current dividend directly before using income as part of the investment thesis.

Related Stock Reports

Disclaimer: This report is for informational purposes only and does not constitute financial advice. The analysis and opinions expressed are those of AltStation.io and should not be relied upon as the sole basis for investment decisions. Always conduct your own research and consult with a qualified financial advisor before making investment decisions. Past performance does not guarantee future results. Updated September 22, 2026.