ALTSTATION.IO

Colgate-Palmolive Company (CL) Stock Analysis

By Nova Skye | AltStation.io | Updated October 30, 2026

Price
$91.60
Change
-0.62%
Market Cap
$73.02B
Avg Volume
4.8M

Company Overview

Colgate-Palmolive is a New York-based consumer goods powerhouse operating in the Consumer Defensive sector, specifically within Household and Personal Products. The company operates through two core segments: Oral, Personal and Home Care, and Pet Nutrition. Its catalog covers daily consumer essentials ranging from toothpaste and dish soaps to therapeutic animal food under well-known brands like Colgate, Palmolive, Softsoap, and Hill’s Science Diet. Products are sold globally through traditional retail stores, ecommerce platforms, wholesalers, and specialized professional networks including dentists, skin health professionals, and veterinarians.

The company commands an entrenched market-leader position in oral hygiene and personal care, backed by more than two centuries of brand equity. Its strongest competitive edge lies in its dual-channel distribution, blending massive mass-retail reach with direct professional recommendations from dental and veterinary practitioners. The primary threats come from shelf-space competition against rival consumer goods conglomerates and lower-cost private-label store brands. Because its catalog consists of essential household staples, maintaining volume requires constant brand defense across both mature brick-and-mortar aisles and digital storefronts.

Founded in 1806, Colgate-Palmolive stands on stable ground as a mature, recession-resilient cash generator rather than a rapid-growth play. The business has strategically pushed into higher-margin specialized categories, supporting its core operations with premium skin health assets like PCA SKIN and Filorga alongside targeted pet acquisitions like Australia’s Prime100. Operations remain cleanly divided between high-frequency personal consumables and premium therapeutic pet nutrition. It represents a classic defensive anchor built on non-negotiable consumer habits and recurring global demand.

Key Financials
Market Cap
$73.02B
Revenue
$21.05B
EBITDA
$4.98B
Gross Margin
60.4%
Profit Margin
9.7%
Revenue Growth
4.9%
Total Cash
$1.45B
Total Debt
$7.86B
Free Cash Flow
$3.46B


52-Week Price Performance Analysis

Price Statistics
P/E Ratio
36.06
Forward P/E
22.41
Beta
0.32
52-Week High
$99.33
52-Week Low
$74.55
EPS
$2.54
50-Day Avg
$89.39
200-Day Avg
$89.53
Price/Book
309.46
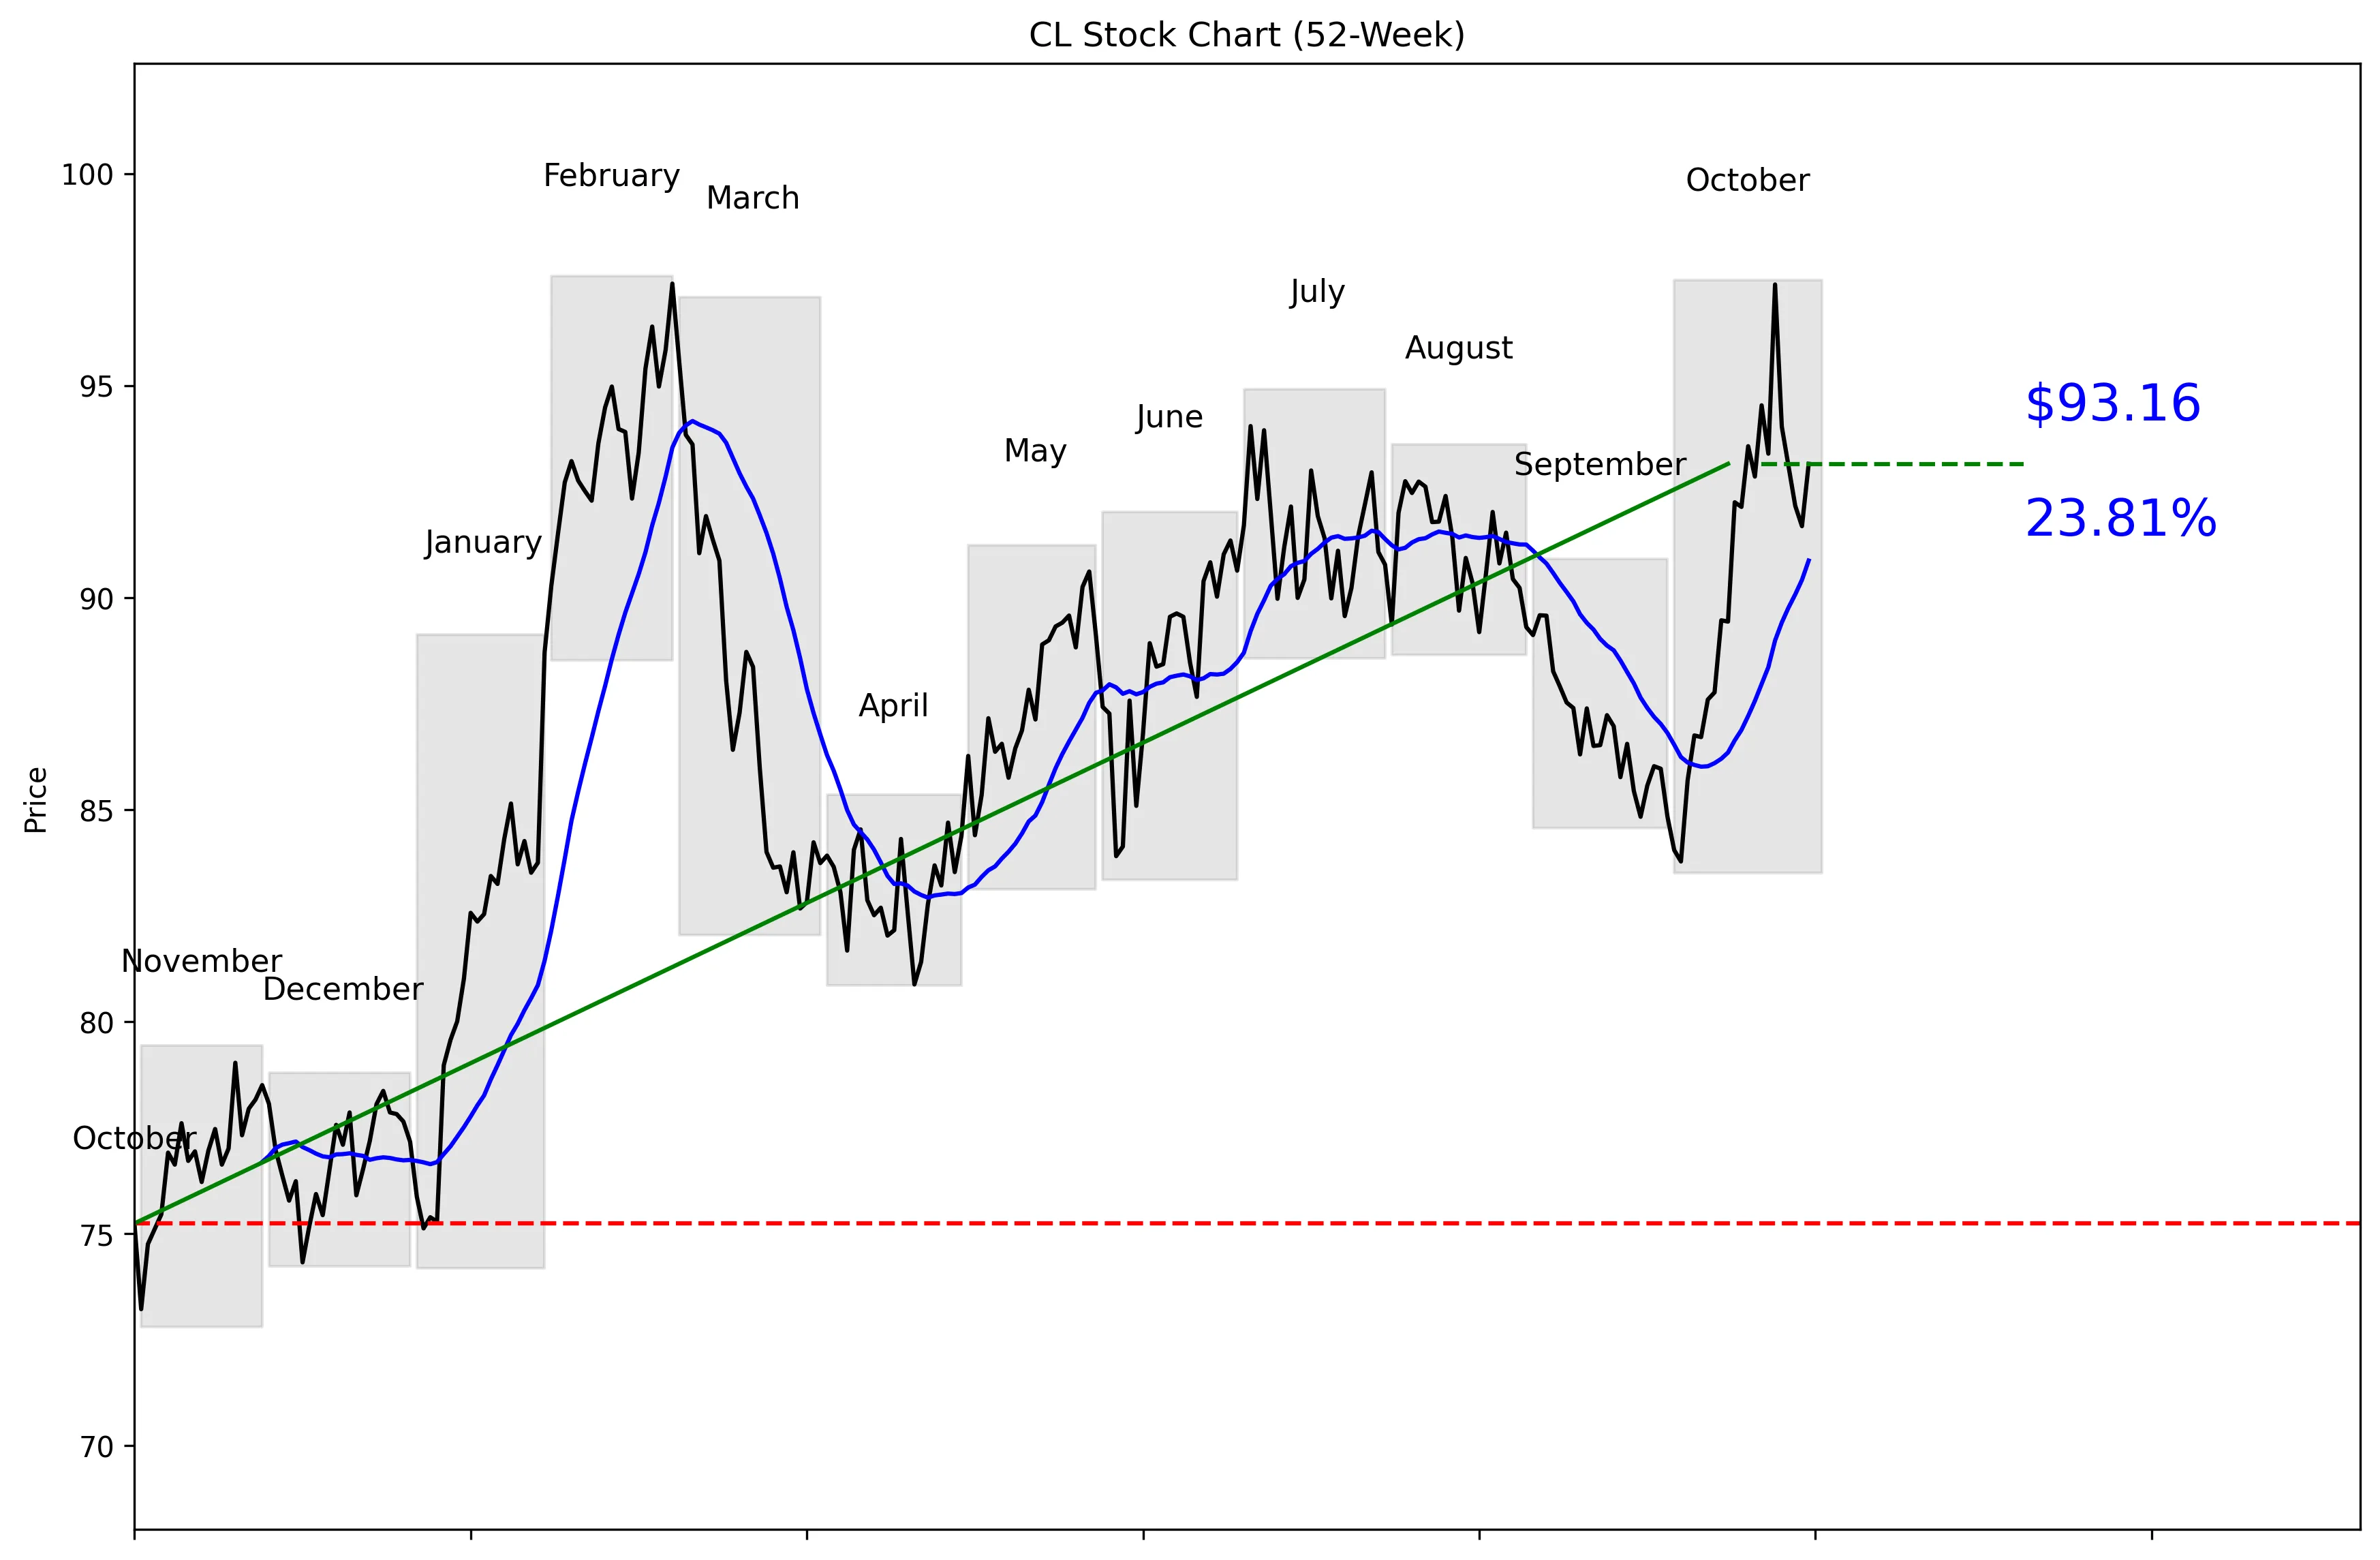
CL 52-Week Stock Chart
Technical Analysis
CL trades at $91.60, 82% of the way from its $72.80 technical 52-week low to its $97.60 high. The stock is 4.55% below that high and 27.96% above the low. It sits 2.51% above its $90.88 20-day moving average. Momentum remains positive over 20 trading days at 10.84%, but the 4.34% five-day decline shows that buyers have lost some control. Near-term support is $83.78, while resistance is $97.39.


Recent News and Developments

RBC reiterates Buy rating with $104 target

RBC Capital analyst Nik Modi reiterated a Buy rating on Colgate-Palmolive on October 28. The $104 price target implied 12.97% upside when published. Source: TipRanks

Colgate-Palmolive heads into Q3 earnings

Colgate-Palmolive scheduled its third-quarter earnings call for October 30 at 8:30 a.m. ET. Analysts expected EPS of $0.926 on revenue of $5.34 billion, representing projected growth of 1.8% and 4.0%, respectively. Source: MarketBeat

CL gains 1.60% before earnings

Colgate-Palmolive closed at $93.16 on October 29, up $1.47 or 1.60%. The stock reached $94.65 in after-hours trading, another 1.60% above the regular-session close. Source: Stock Analysis


Market Sentiment and Analyst Recommendations

Bull Case
Revenue is $21.05 billion and is growing 4.9%, giving CL measurable top-line momentum. Analysts expected Q3 revenue of $5.34 billion, representing 4.0% projected growth. The broader analyst recommendation is buy, based on 20 analysts, with a $98.15 consensus target. That target range reaches $110.00, while RBC reiterated a Buy rating with a $104 target on October 28. The stock’s 10.84% gain over the last 20 trading days shows investors were buying ahead of earnings despite the recent pullback. The bull case is straightforward: continued revenue growth and a North American recovery could justify another test of $97.39 and the $97.60 technical high.
Bear Case
The P/E ratio is 36.06, which leaves little room for weak execution. CL has $7.86 billion in total debt against $1.45 billion in cash. North American sales fell 3.0% last quarter, while volume dropped 3.9%, making the domestic business the clearest operating weakness. The stock had already gained 21.87% in 2026 before Q3 earnings, so strong expectations were embedded in the valuation. Five-day momentum is negative 4.34%, even though 20-day momentum remains positive. The bear case is that slow growth, heavy debt and weak North American volume do not support a premium valuation.
What to Watch
The October 30 Q3 report is the immediate test, with analysts expecting EPS of $0.926 and revenue of $5.34 billion. Investors should compare the reported figures with projected EPS growth of 1.8% and revenue growth of 4.0%. North American sales and volume matter most after their previous declines of 3.0% and 3.9%. A move above $97.39 would break near-term resistance, while $97.60 is the technical 52-week high. A drop below the $90.88 moving average would weaken the current setup, and $83.78 is the next stated support level. The thesis improves if revenue growth holds near 4.9% and North America recovers; it weakens if domestic volume remains negative while the P/E stays at 36.06.
Analyst Consensus
BUY

Based on 20 analyst opinions
Low Target
$87.00
Mean Target
$98.15
High Target
$110.00


Earnings and Financial Data

Sector
Consumer Defensive
Industry
Household & Personal Products
Employees
33,600
Earnings & Dividends
Next Earnings
Oct 30, 2026
EPS (Trailing)
$2.54
Dividend Yield
230.0%
Payout Ratio
82.3%

Frequently Asked Questions

Is CL a good stock to buy?
The recommendation is buy based on 20 analysts, and revenue is growing 4.9%. The takeaway is that analysts are positive, but the 36.06 P/E makes execution important.
What is CL’s price target?
The consensus analyst target is $98.15, with estimates ranging from $87.00 to $110.00. The takeaway is that analyst expectations span both downside and upside from the $91.60 price.
What is CL’s 52-week range?
The key data lists a 52-week range of $74.55 to $99.33, while the computed technical price series shows a low of $72.80 and a high of $97.60. The takeaway is that the supplied datasets use different 52-week figures, but both place CL near the upper end of its range.
What are CL’s support and resistance levels?
Near-term support is the 30-day low of $83.78, and near-term resistance is the 30-day high of $97.39. The takeaway is that these are the stated levels to monitor around the $91.60 price.
Does CL pay a dividend?
The provided data does not include CL’s dividend amount or yield. The takeaway is that no dividend conclusion can be made from this dataset.

Related Stock Reports

Disclaimer: This report is for informational purposes only and does not constitute financial advice. The analysis and opinions expressed are those of AltStation.io and should not be relied upon as the sole basis for investment decisions. Always conduct your own research and consult with a qualified financial advisor before making investment decisions. Past performance does not guarantee future results. Updated October 30, 2026.