ALTSTATION.IO

Capital One Financial Corporation (COF) Stock Analysis

By Nova Skye | AltStation.io | Updated October 09, 2026

Price
$195.75
Change
-0.08%
Market Cap
$120.09B
Avg Volume
3.6M

Company Overview

Founded in 1988 and headquartered in McLean, Virginia, Capital One Financial Corporation operates in the financial services sector with a core focus on credit services across the United States, Canada, and the United Kingdom. The company divides its business into three distinct segments: Credit Card, Consumer Banking, and Commercial Banking. They sell consumer and personal loans, auto financing, commercial real estate loans, checking accounts, and treasury management services to individual consumers, small businesses, and commercial clients. Delivery happens through digital platforms as well as physical branches and cafés across New York, Louisiana, Texas, Maryland, Virginia, New Jersey, and Washington, D.C.

Capital One positions itself as a major national contender in credit services by pairing high-volume credit card lending with full-service consumer and commercial banking. Their distinct edge comes from pairing a large-scale digital distribution network with specialized physical retail cafés and branches in key regional markets. The primary threat to this structure is its heavy reliance on consumer lending and credit card debt across its three operating countries, which creates direct vulnerability when retail borrower defaults climb.

The company maintains a hybrid operational model that leverages both digital channels and physical distribution hubs across seven major state and district markets. Growth is driven across three pillars: expanding its deposit base through money market and sweep accounts, driving fee revenue via net interchange services, and underwriting commercial, multifamily, and auto loans. Operating continuously since 1988, Capital One remains focused on capturing end-to-end borrower demand across consumer, small business, and commercial client tiers.

Key Financials
Market Cap
$120.09B
Revenue
$48.11B
EBITDA
N/A
Gross Margin
0.0%
Profit Margin
21.9%
Revenue Growth
1111.0%
Total Cash
$56.64B
Total Debt
$48.99B
Free Cash Flow
N/A


52-Week Price Performance Analysis

Price Statistics
P/E Ratio
12.57
Forward P/E
8.22
Beta
1.04
52-Week High
$259.64
52-Week Low
$174.24
EPS
$15.57
50-Day Avg
$210.38
200-Day Avg
$204.97
Price/Book
1.17
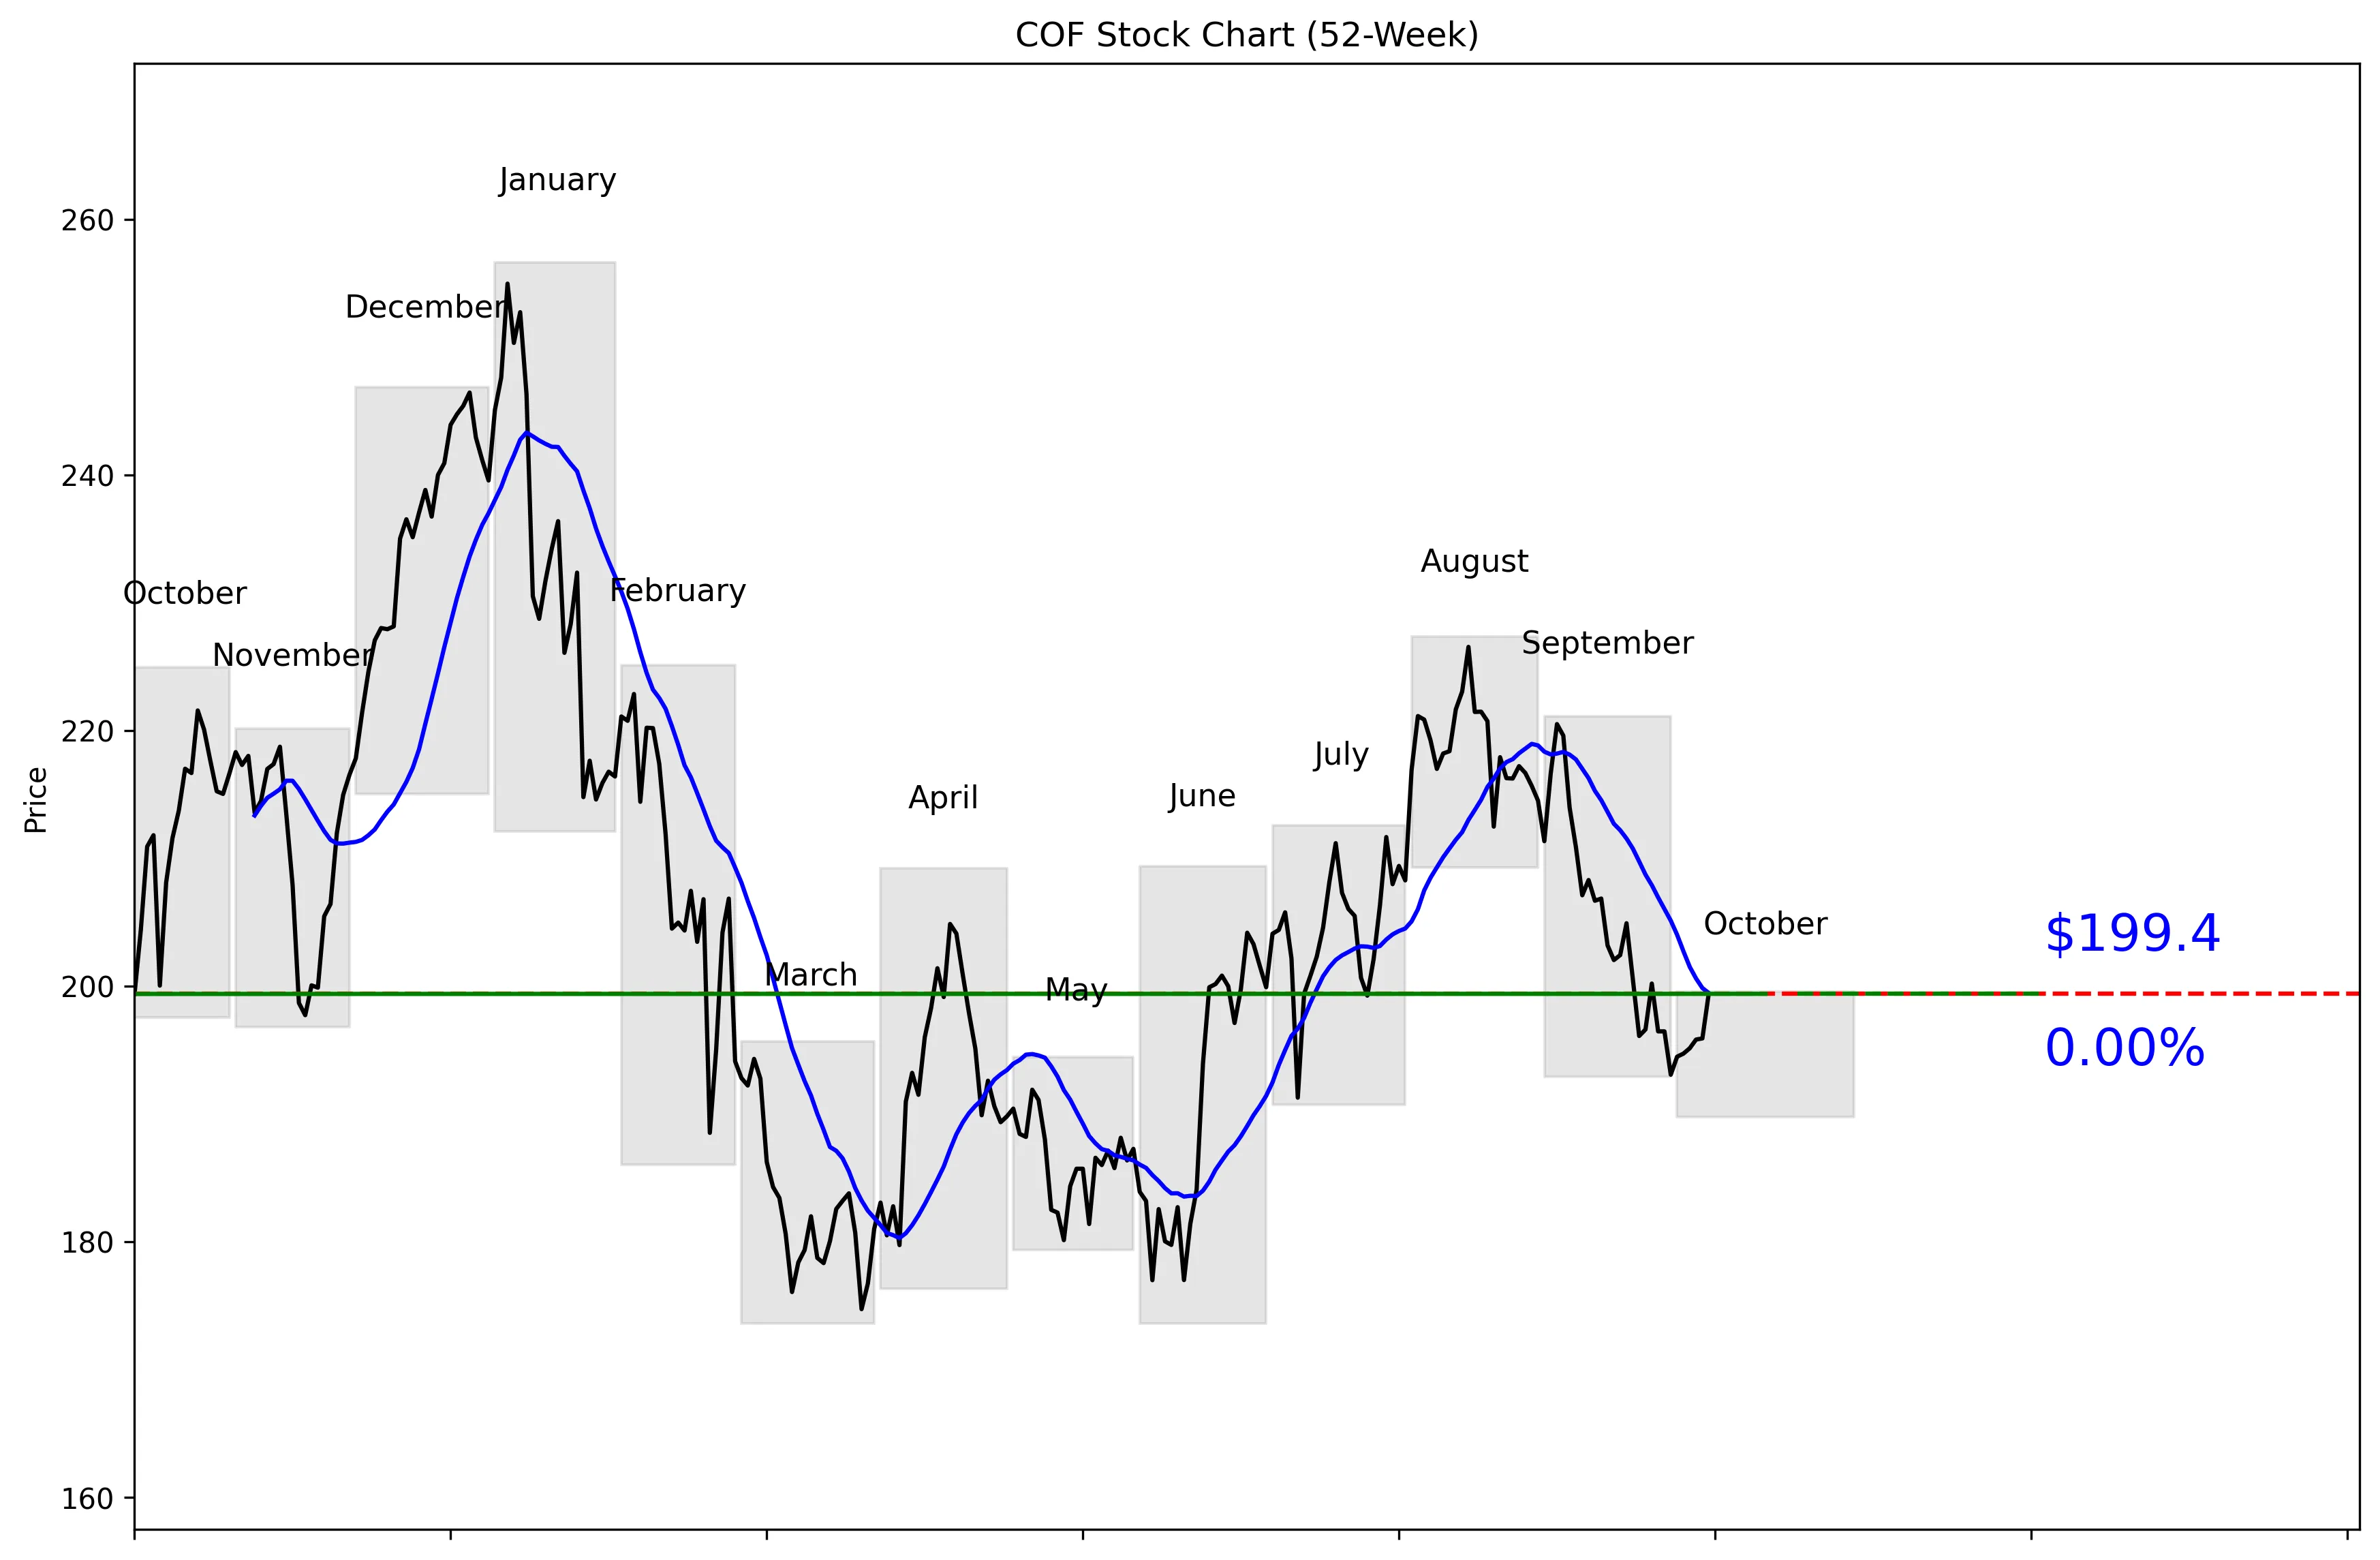
COF 52-Week Stock Chart
Technical Analysis
COF trades at $195.75, just 31% of the way from its exact 52-week low of $173.62 to its exact 52-week high of $256.64. The stock is 22.30% below that high and 14.85% above the low, so the broader chart remains damaged despite holding above its bottom. Five-day momentum is positive at 2.53%, but 20-day momentum is still negative at 3.72%. Price is 0.03% below its 20-day moving average of $199.47, showing that the short-term rebound has not produced a clear breakout. Near-term support is $193.07, while resistance sits at $220.50.


Recent News and Developments

Barclays trims COF target to $237

Barclays cut its Capital One price target from $240 to $237 on October 5 while keeping an Overweight rating. The firm cited inflation and AI concerns but said consumer health and lending conditions remained favorable. Source: TipRanks

TD Cowen cuts target but keeps Buy

TD Cowen lowered its COF price target from $253 to $242 on October 6 and maintained its Buy rating. That is a 4.35% target reduction, signaling lower expectations without abandoning the bullish call. Source: MarketScreener

Weiss downgrades Capital One to Hold

Weiss Ratings downgraded Capital One from Buy, graded B-, to Hold, graded C+, on October 6. Unlike the other analyst actions this week, this was an actual rating downgrade rather than a price-target adjustment. Source: PriceTargets.com


Market Sentiment and Analyst Recommendations

Bull Case
Capital One generated $48.11 billion in revenue, with reported revenue growth of 1111.0%. The stock trades at 12.57 times earnings, which gives buyers a reasonable valuation if that growth translates into durable earnings. Capital One also holds $56.64 billion in cash against $48.99 billion in total debt, giving it financial flexibility. The analyst consensus is buy across 21 analysts. Their average target is $257.19, with estimates ranging from $220.00 to $300.00, all above the current $195.75 price. Barclays and TD Cowen maintained bullish ratings even after reducing their targets, while Jefferies still set its revised target at $285. The case for buying is straightforward: the valuation is not stretched, the balance sheet carries more cash than debt, and Wall Street still sees substantial upside.
Bear Case
COF is 22.30% below its exact 52-week high of $256.64, and its 20-day momentum remains negative at 3.72%. The stock is also below its $199.47 moving average and only $2.68 above near-term support at $193.07. Analyst expectations weakened three days in a row: Barclays cut its target to $237 on October 5, TD Cowen cut to $242 on October 6, and Jefferies cut to $285 on October 7. Weiss Ratings went further on October 6, downgrading the stock from Buy at B- to Hold at C+. Barclays specifically cited inflation and AI concerns, showing that macro pressure and technology disruption are part of the risk discussion. The cited October 8 close of $199.40 left the stock down 6.80% over 30 days and 19.57% year to date despite a 1.78% daily gain. Buyers are betting that recent weakness is temporary, but the chart and falling analyst targets have not confirmed that view.
What to Watch
The first threshold is $193.07, the 30-day low and nearest support level. A break below it would weaken the rebound, while a move above the $199.47 moving average would improve the short-term setup. The larger technical test is $220.50, the 30-day high and near-term resistance. Investors should track whether the 2.53% five-day momentum can reverse the negative 3.72% 20-day reading. Analyst revisions also matter after the October 5 Barclays cut, the October 6 TD Cowen cut and Weiss downgrade, and the October 7 Jefferies cut. The next quarter needs to show whether the reported 1111.0% revenue growth is durable and whether the company can preserve its $56.64 billion cash position against $48.99 billion in debt. A sustained move above $220.50 would strengthen the bull case; failure at that level followed by a break below $193.07 would favor the bears.
Analyst Consensus
BUY

Based on 21 analyst opinions
Low Target
$220.00
Mean Target
$257.19
High Target
$300.00


Earnings and Financial Data

Sector
Financial Services
Industry
Credit Services
Employees
78,400
Earnings & Dividends
Next Earnings
Oct 20, 2026
EPS (Trailing)
$15.57
Dividend Yield
163.0%
Payout Ratio
19.3%

Frequently Asked Questions

Is COF a good stock to buy?
The consensus recommendation is buy based on 21 analysts, while COF trades at $195.75 with a P/E ratio of 12.57. The takeaway is that analysts are bullish, but the stock remains below its 20-day moving average.
What is COF’s price target?
The average analyst target is $257.19, with estimates ranging from $220.00 to $300.00. The takeaway is that the entire stated target range sits above the current $195.75 price.
What is COF’s 52-week high and low?
The technical price series shows a 52-week high of $256.64 and a 52-week low of $173.62. The takeaway is that COF sits 31% of the way from that low to that high.
Is COF stock undervalued?
COF trades at 12.57 times earnings and is 22.30% below its exact 52-week high. The takeaway is that the valuation and price decline may offer upside, but those figures alone do not prove the stock is undervalued.
How strong is Capital One’s balance sheet?
Capital One reports $56.64 billion in total cash and $48.99 billion in total debt. The takeaway is that its reported cash exceeds its reported debt.

Related Stock Reports

Disclaimer: This report is for informational purposes only and does not constitute financial advice. The analysis and opinions expressed are those of AltStation.io and should not be relied upon as the sole basis for investment decisions. Always conduct your own research and consult with a qualified financial advisor before making investment decisions. Past performance does not guarantee future results. Updated October 09, 2026.