ALTSTATION.IO

Fair Isaac Corporation (FICO) Stock Analysis

By Nova Skye | AltStation.io | Updated October 24, 2026

Price
$815.89
Change
-0.90%
Market Cap
$17.62B
Avg Volume
680.9K

Company Overview

Founded in 1956 and based in Bozeman, Montana, Fair Isaac Corporation operates in the technology sector as an application software provider. The company builds predictive analytics and automated decision engines across two core divisions: Scores and Software. Its Scores division sells credit ratings to financial institutions, mortgage lenders, and retail consumers via myFICO.com subscriptions. Its Software division provides enterprise tools like the modular FICO Platform, fraud detection systems, and decision engines like Blaze Advisor to businesses managing risk and customer accounts.

FICO is the dominant market leader in consumer credit risk, holding an entrenched position as the de facto standard across US lending. That near-monopoly positioning gives its Scores segment extraordinary pricing power and operating margins around 88%. Its primary challenger is VantageScore, a joint venture created by the three major credit bureaus: Equifax, Experian, and TransUnion. While regulatory shifts have expanded VantageScore’s presence in mortgage originations, FICO’s decades of institutional integration make it difficult and risky for lenders to abandon.

The company is currently driving top-line growth through aggressive score price increases while transitioning its software business toward the cloud. The Scores segment remains the primary cash engine, consistently generating over 75% of FICO’s operating profit. Meanwhile, management’s main strategic pivot is expanding the cloud-native FICO Platform to build sticky, recurring subscription software revenue. FICO remains one of the highest-margin businesses in application software, but its long-term performance depends on successfully scaling this platform while defending its pricing power against bureau-backed rivals.

Key Financials
Market Cap
$17.62B
Revenue
$2.39B
EBITDA
$1.26B
Gross Margin
85.1%
Profit Margin
34.1%
Revenue Growth
25.7%
Total Cash
$248.44M
Total Debt
$5.60B
Free Cash Flow
$774.41M


52-Week Price Performance Analysis

Price Statistics
P/E Ratio
23.62
Forward P/E
16.60
Beta
1.34
52-Week High
$1858.91
52-Week Low
$586.05
EPS
$34.54
50-Day Avg
$918.14
200-Day Avg
$1149.91
Price/Book
-4.30
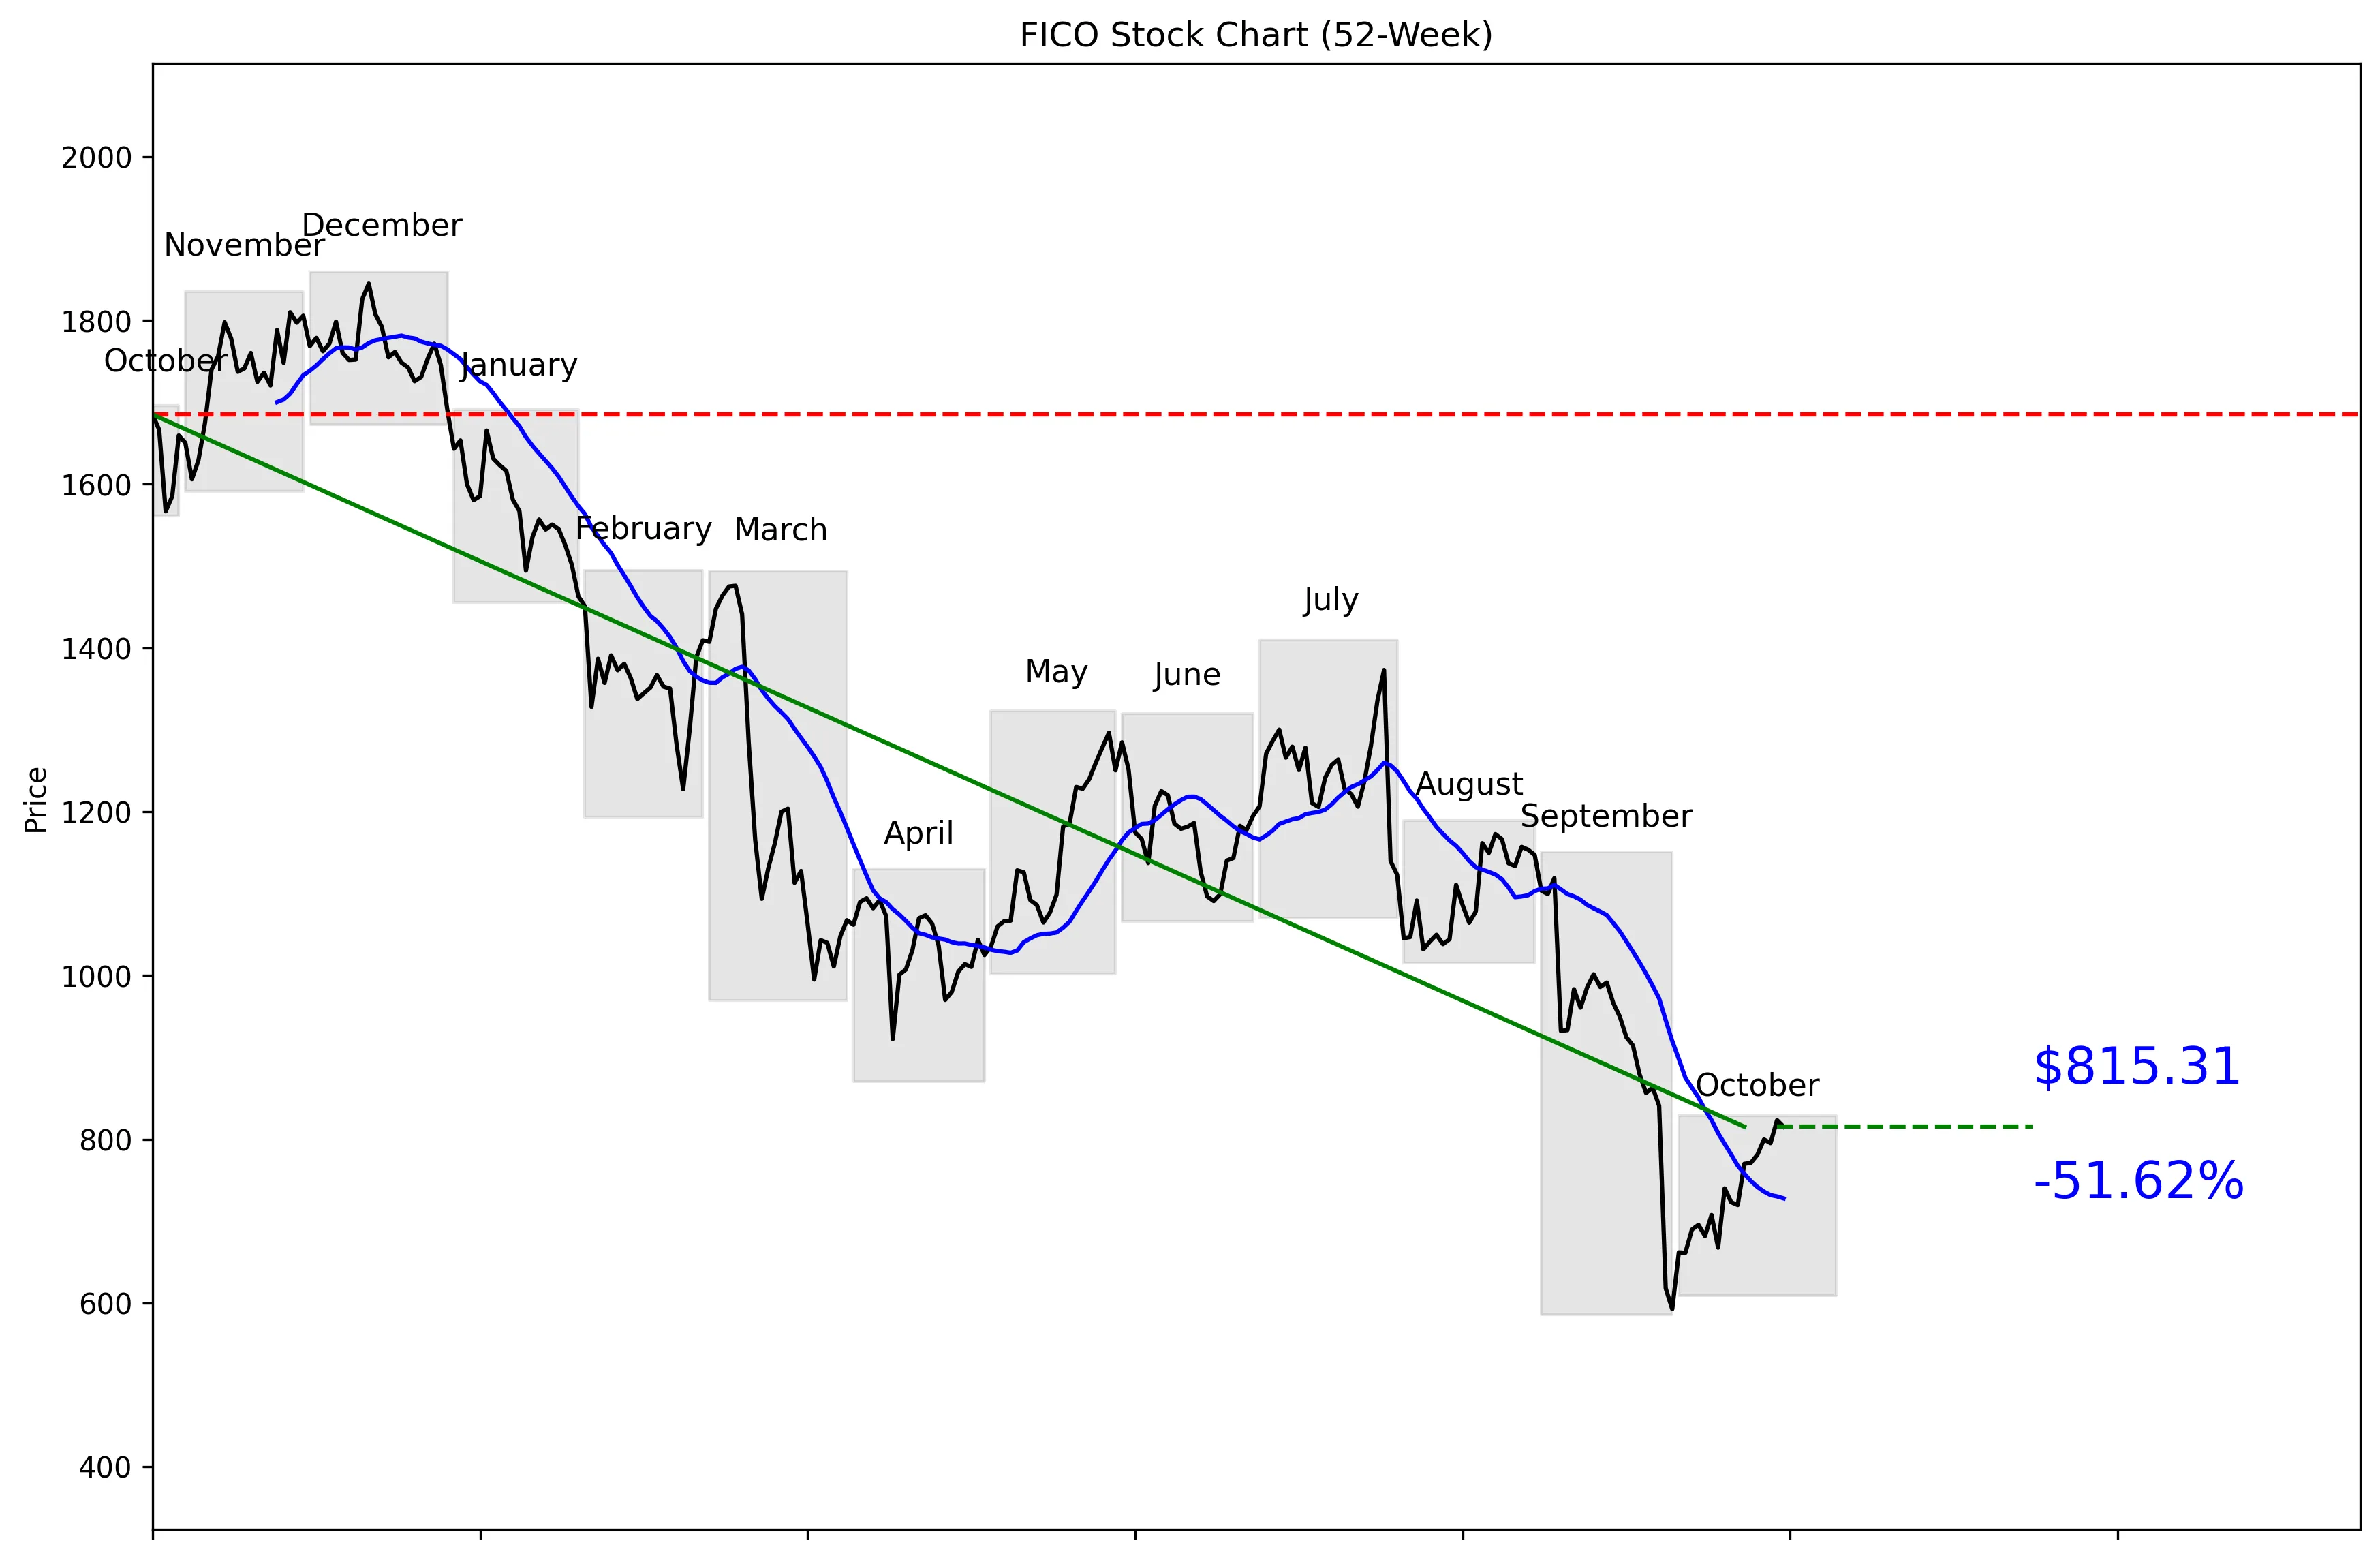
FICO 52-Week Stock Chart
Technical Analysis
FICO trades at $815.89, down 56.14% from its $1,858.91 52-week high. The stock is 39.12% above its $586.05 low and sits just 18% of the way through its 52-week range. Price is 12.04% above the 20-day moving average of $727.72, showing a short-term recovery. Five-day momentum is positive at 5.72%, but 20-day momentum remains negative at 5.54%. Near-term support is $592.47, while resistance sits at $1,001.50.


Recent News and Developments

FICO Holds Mortgage Score Bundle at $10

FICO kept its wholesale mortgage price at $10 for lenders and brokers enrolled in its Preferred Program. The bundle includes both Classic FICO Score and FICO Score 10T through participating tri-merge resellers. Source: FICO

FICO Sets November 4 Earnings Date

FICO will report fiscal fourth-quarter 2026 results after the market closes on November 4. The earnings call starts at 5:00 p.m. Eastern; no financial results were included in the announcement. Source: FICO

UK Credit Card Balances Break £2,000

FICO data showed the average active UK credit card balance reached a record £2,005 in August, up 1.2% month over month and 4.8% year over year. Average spending rose 3.1% to £840, while the share of balances paid fell to 33.3%. Source: FICO


Market Sentiment and Analyst Recommendations

Bull Case
Revenue is $2.39 billion and growing 25.7%, which is the strongest reason to own FICO here. The stock trades at 23.62 times earnings, giving investors exposure to that growth without paying the valuation attached to its 52-week high. FICO also kept its wholesale mortgage score bundle at $10 for lenders and brokers enrolled in its Preferred Program. Analysts rate the stock a buy, with 19 analysts contributing to the recommendation. Their average target is $1,007.10, above the current $815.89 price. With the stock 56.14% below its 52-week high, the bull case is straightforward: strong revenue growth, positive analyst sentiment, and substantial room to recover.
Bear Case
FICO carries $5.60 billion in total debt against only $248.44 million in cash. That balance-sheet gap is the clearest fundamental risk in the supplied data. The stock’s 52-week range of $586.05 to $1,858.91 also shows extreme price volatility. Twenty-day momentum is still negative at 5.54%, despite the recent five-day gain. Analyst targets range from $490 to $1,675, which signals major disagreement about what the company is worth. Mizuho’s target cut from $1,344 to $1,063 reinforces the risk that valuation expectations are still being reset.
What to Watch
FICO reports fiscal fourth-quarter 2026 results after the market closes on November 4, with the earnings call scheduled for 5:00 p.m. Eastern. Revenue growth is the first number to watch because the current rate is 25.7%. Investors should also monitor whether the stock can break above its $1,001.50 near-term resistance. A sustained move below the $727.72 20-day moving average would weaken the short-term recovery. The $592.47 near-term support level is the major downside threshold, sitting close to the $586.05 52-week low. Watch analyst revisions after earnings, particularly whether targets move toward the current $1,007.10 average or closer to the low-end target of $490.
Analyst Consensus
BUY

Based on 19 analyst opinions
Low Target
$490.00
Mean Target
$1007.10
High Target
$1675.00


Earnings and Financial Data

Sector
Technology
Industry
Software – Application
Employees
3,876
Earnings & Dividends
Next Earnings
Nov 04, 2026
EPS (Trailing)
$34.54
Dividend Yield
None
Payout Ratio
0%

Frequently Asked Questions

Is FICO a good stock to buy?
The current recommendation is buy based on 19 analysts, and revenue is growing 25.7%. The clear takeaway is that analysts favor the stock, but its wide trading range shows substantial risk.
What is FICO’s price target?
The average analyst target is $1,007.10, with estimates ranging from $490 to $1,675. The takeaway is that the average target is above the current $815.89 price, but analyst expectations vary widely.
Is FICO stock undervalued?
FICO trades at a P/E ratio of 23.62 and sits 56.14% below its 52-week high. The takeaway is that the stock is far below its peak, but the supplied data does not establish a definitive fair value.
What are FICO’s support and resistance levels?
Near-term support is $592.47 and near-term resistance is $1,001.50. The takeaway is that these are the key 30-day price levels to track.
How much debt does FICO have?
FICO has $5.60 billion in total debt and $248.44 million in total cash. The takeaway is that debt is a material risk investors should monitor.

Related Stock Reports

Disclaimer: This report is for informational purposes only and does not constitute financial advice. The analysis and opinions expressed are those of AltStation.io and should not be relied upon as the sole basis for investment decisions. Always conduct your own research and consult with a qualified financial advisor before making investment decisions. Past performance does not guarantee future results. Updated October 24, 2026.