ALTSTATION.IO

Corning Incorporated (GLW) Stock Analysis

By Nova Skye | AltStation.io | Updated October 12, 2026

Price
$156.73
Change
+2.55%
Market Cap
$135.01B
Avg Volume
10.3M

Company Overview

Corning Incorporated (GLW) manufactures specialized glass, ceramics, and optical fiber from its headquarters in Corning, New York. Founded in 1851 and renamed from Corning Glass Works in April 1989, the company operates in the Electronic Components industry within the Technology sector. It sells fiber-optic cables and connectivity hardware to telecom providers, glass substrates for flat-panel displays, cover glass for smartphones, emissions filters for automakers, and labware under brands like PYREX and Falcon. Its buyers range from consumer electronics manufacturers and telecom carriers to automotive companies and pharmaceutical researchers across North America, Asia, and Europe.

Corning is an established market leader in specialty glass and optical fiber, shielded by proprietary fusion manufacturing processes and a deep patent portfolio. Its strongest competitive edge lies in long-standing, multi-year supply relationships with major consumer electronics and enterprise tech companies. It faces stiff competition from AGC Inc. and Nippon Electric Glass in display substrates, alongside Prysmian Group and CommScope in optical cabling. The biggest vulnerability for Corning is hardware cyclicality, where periodic slowdowns in smartphone upgrades and consumer TV purchases squeeze factory utilization.

After sales dropped to $12.58 billion in 2023 during a broad industry inventory reset, Corning returned to growth with $13.11 billion in revenue for 2024 under its Springboard operating plan. The company is actively pivoting toward artificial intelligence data centers, securing critical multi-year supply contracts for high-density optical fiber. That AI infrastructure buildout gives Corning a high-margin growth driver that offsets softer demand in legacy display glass. It is a sharp execution story that positions a legacy materials manufacturer right in the middle of the next-generation compute buildout.

Key Financials
Market Cap
$135.01B
Revenue
$16.96B
EBITDA
$4.08B
Gross Margin
36.4%
Profit Margin
11.2%
Revenue Growth
16.6%
Total Cash
$2.50B
Total Debt
$9.38B
Free Cash Flow
$734.50M


52-Week Price Performance Analysis

Price Statistics
P/E Ratio
71.90
Forward P/E
35.85
Beta
1.12
52-Week High
$271.78
52-Week Low
$77.39
EPS
$2.18
50-Day Avg
$155.03
200-Day Avg
$152.00
Price/Book
11.31
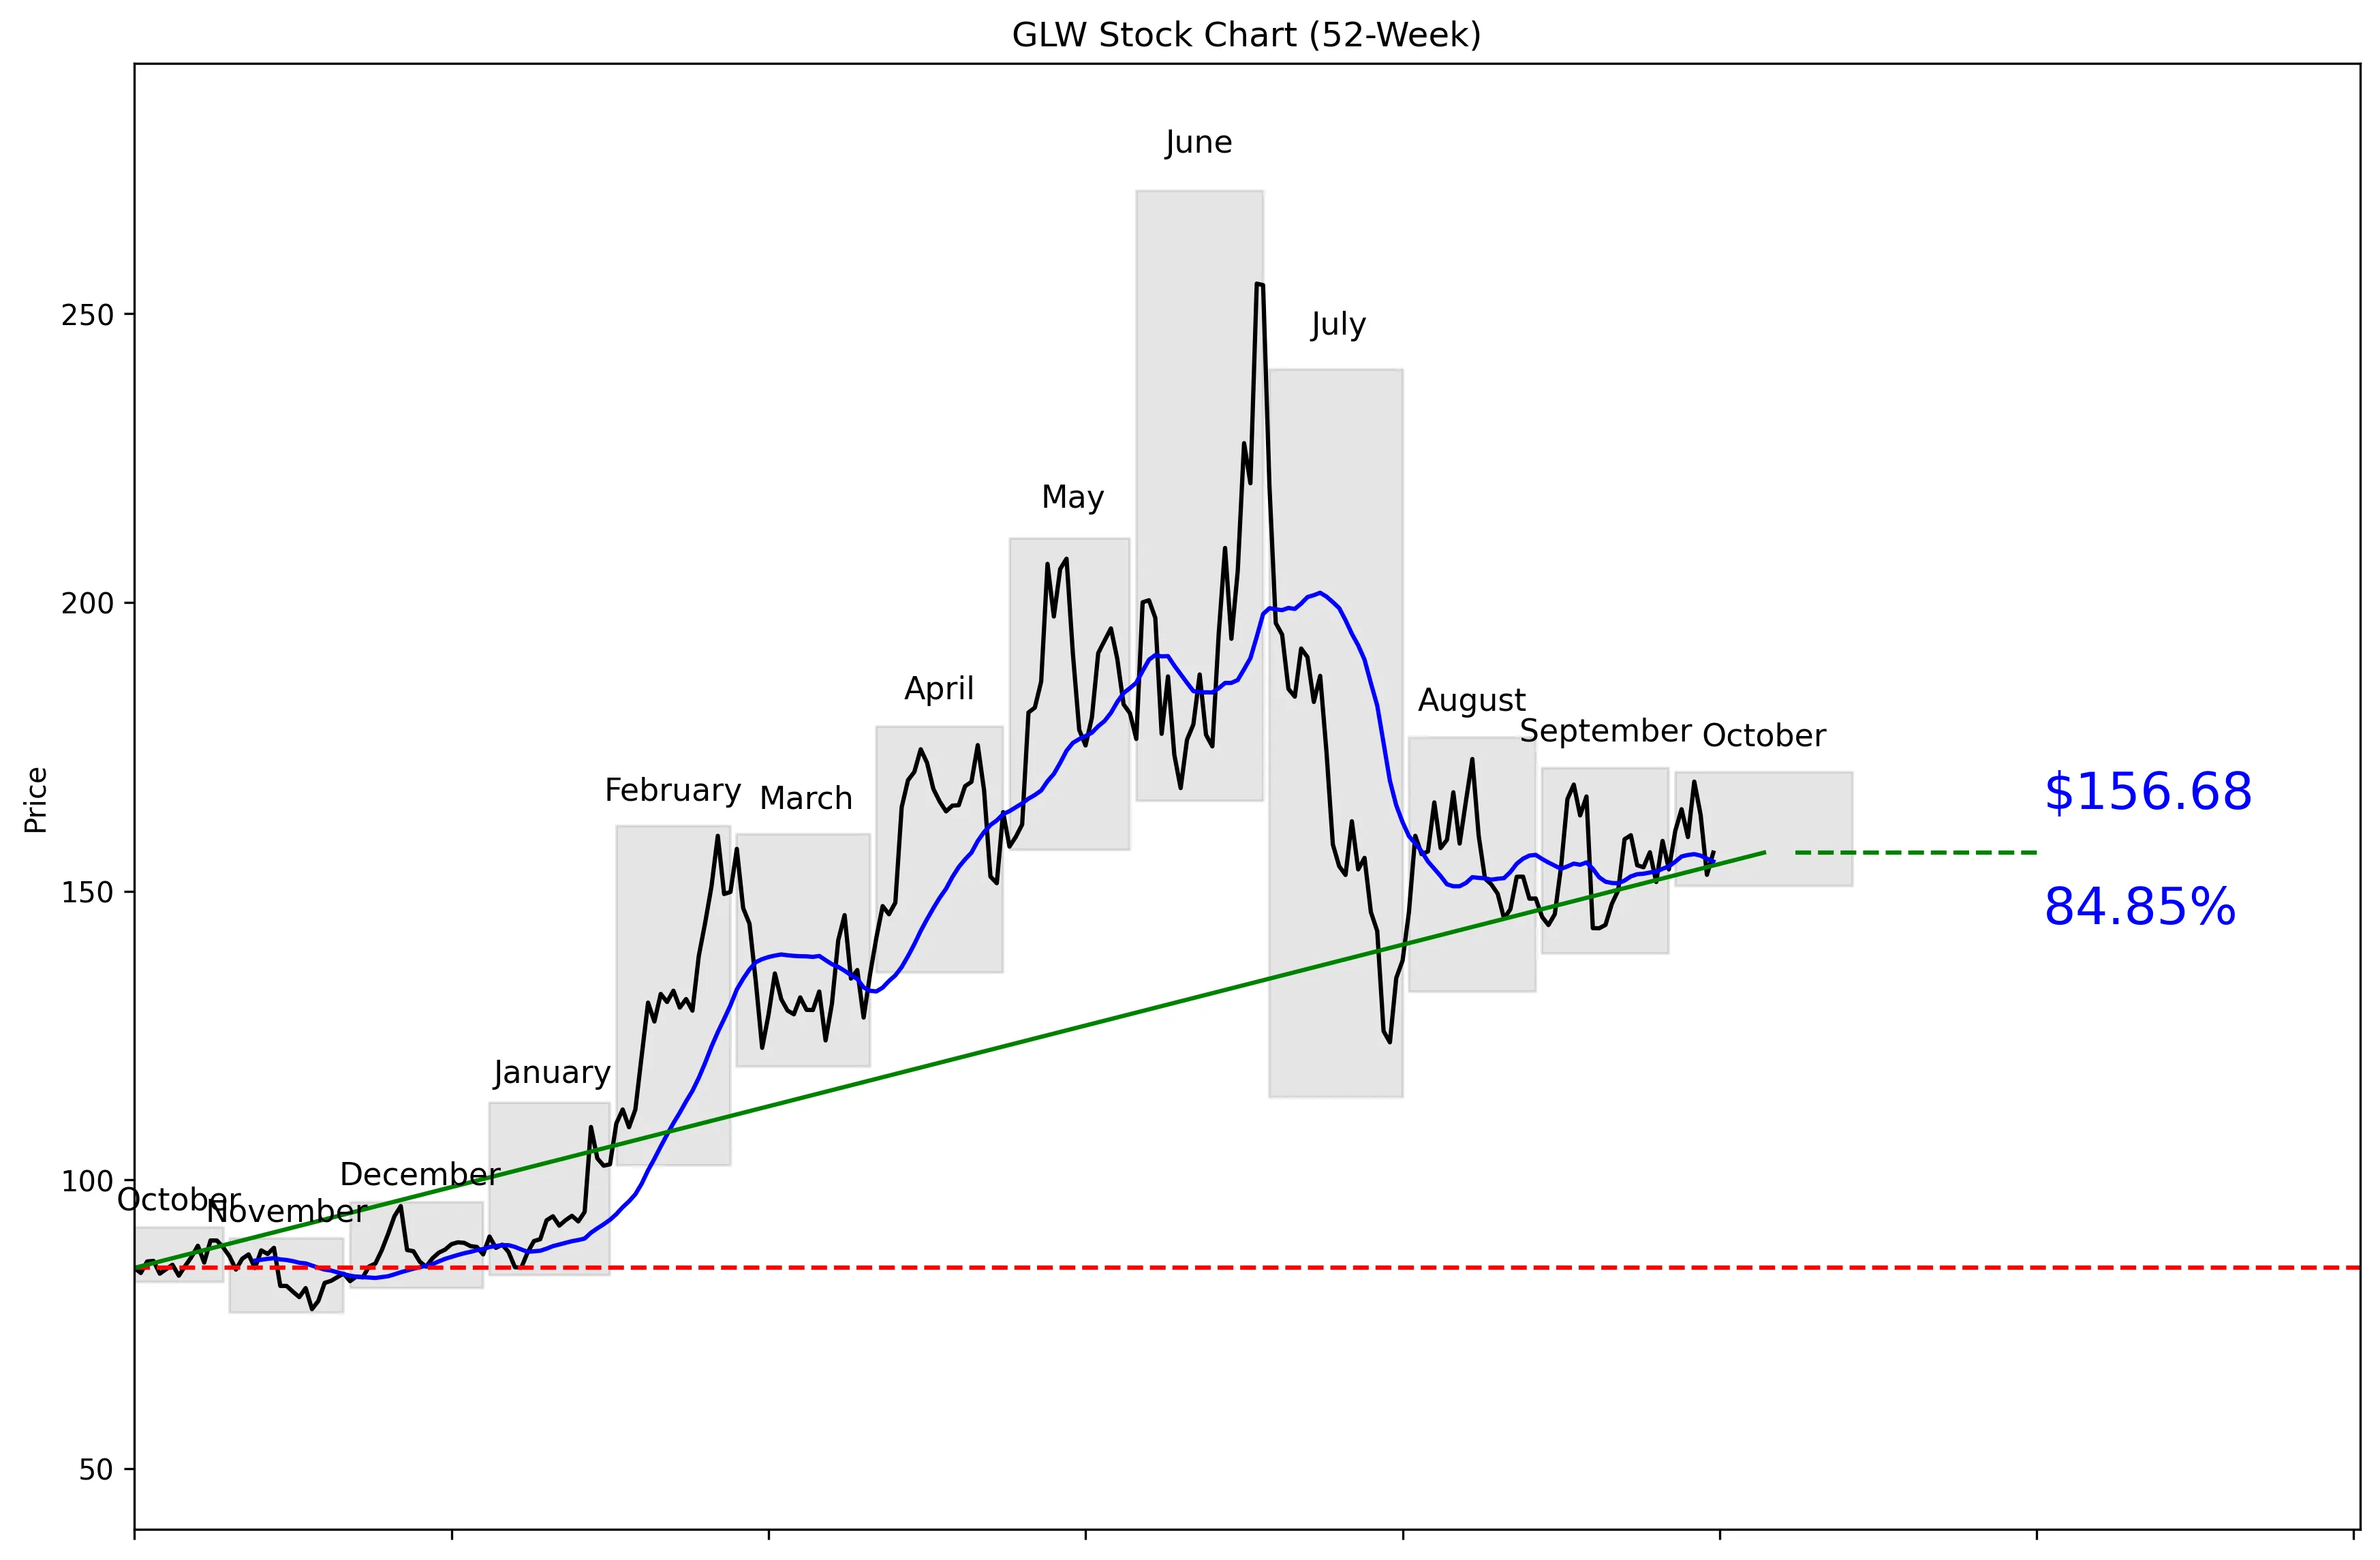
GLW 52-Week Stock Chart
Technical Analysis
GLW trades at $156.73, 41% of the way from its 52-week low of $76.98 to its 52-week high of $271.27. The stock is 42.24% below that high but 103.53% above the low. Price sits 0.98% above the 20-day moving average of $155.15. Momentum remains weak, with losses of 4.57% over five trading days and 5.84% over 20 trading days. Near-term support is $143.57, while resistance is $168.97.


Recent News and Developments

UBS lifts Corning target to $201

UBS analyst Joshua Spector maintained a Buy rating on Corning on October 5. He raised the price target from $196 to $201, a 2.6% increase. Source: Benzinga

Corning holds quarterly dividend at $0.28

Corning’s board declared a quarterly dividend of $0.28 per share on October 6. It is payable December 11 to shareholders of record on November 13. Source: Corning Incorporated

GLW swings sharply and finishes the week lower

Corning jumped 6.02% on October 6, then fell 3.39% on October 7 and 6.38% on October 8. Shares rebounded 2.52% on October 9 to close at $156.68, below the October 5 close of $159.37. Source: Stock Analysis


Market Sentiment and Analyst Recommendations

Bull Case
Revenue is $16.96 billion and growing 16.6%, giving investors a concrete fundamental reason to own the stock. GLW has also risen 103.53% from its 52-week low, showing that buyers have defended the broader recovery despite the recent pullback. The analyst consensus is buy across 17 analysts. Their average target is $187.71, with estimates ranging from $129.00 to $238.00. UBS reinforced the bullish view on October 5 by maintaining its Buy rating and raising its target from $196 to $201. The bull case is straightforward: strong revenue growth, positive analyst sentiment, and a current price below both the average analyst target and UBS target.
Bear Case
A P/E of 71.90 leaves little room for disappointing growth or execution. Total debt is $9.38 billion against $2.50 billion in cash, so the balance sheet carries substantially more debt than liquidity. The stock remains 42.24% below its 52-week high, which shows how much value has already been erased from the peak. Momentum is negative over both five and 20 trading days at 4.57% and 5.84%, respectively. Recent volatility is severe: GLW rose 6.02% on October 6, fell 3.39% on October 7, dropped another 6.38% on October 8, and recovered 2.52% on October 9. The supplied data does not identify specific competitive or macro threats, but the valuation, debt load, and unstable price action are enough to make this a high-expectation stock.
What to Watch
The first test is whether GLW can hold its 30-day support at $143.57. A move through the 30-day resistance level of $168.97 would strengthen the near-term technical picture. Investors should also watch whether the price can stay above its 20-day moving average of $155.15 after posting negative momentum over both five and 20 trading days. Revenue growth of 16.6% is the central fundamental metric because a P/E of 71.90 demands continued growth. Shareholders of record on November 13 are scheduled to receive the declared $0.28 quarterly dividend on December 11. The thesis improves if revenue growth remains strong and price clears $168.97; it weakens if momentum carries GLW below $143.57.
Analyst Consensus
BUY

Based on 17 analyst opinions
Low Target
$129.00
Mean Target
$187.71
High Target
$238.00


Earnings and Financial Data

Sector
Technology
Industry
Electronic Components
Employees
67,200
Earnings & Dividends
Next Earnings
Oct 27, 2026
EPS (Trailing)
$2.18
Dividend Yield
73.0%
Payout Ratio
51.4%

Frequently Asked Questions

Is GLW a good stock to buy?
The recommendation is buy based on 17 analysts, and revenue is growing 16.6%. The takeaway is that Wall Street is bullish, but the 71.90 P/E makes GLW an expensive stock.
What is GLW’s price target?
The average analyst target is $187.71, with a range from $129.00 to $238.00. The takeaway is that analysts see upside from the current $156.73 price, although the lowest target is below it.
Is GLW overvalued?
GLW trades at a P/E of 71.90 with revenue growth of 16.6%. The takeaway is that investors are paying a high valuation for that growth.
What are GLW’s support and resistance levels?
Near-term support is the 30-day low of $143.57, while resistance is the 30-day high of $168.97. The takeaway is that these are the key levels to watch around the current $156.73 price.
How far is GLW from its 52-week high?
GLW is 42.24% below its exact 52-week high of $271.27 and 103.53% above its exact 52-week low of $76.98. The takeaway is that the stock has recovered sharply from the low but remains far below its peak.

Related Stock Reports

Disclaimer: This report is for informational purposes only and does not constitute financial advice. The analysis and opinions expressed are those of AltStation.io and should not be relied upon as the sole basis for investment decisions. Always conduct your own research and consult with a qualified financial advisor before making investment decisions. Past performance does not guarantee future results. Updated October 12, 2026.