ALTSTATION.IO

HP Inc. (HPQ) Stock Analysis

By Nova Skye | AltStation.io | Updated September 06, 2026

Price
$32.69
Change
+2.36%
Market Cap
$29.48B
Avg Volume
15.7M

Company Overview

HP Inc. is a Palo Alto-based computer hardware heavyweight in the technology sector that makes the laptops, desktops, workstations, and printers used by consumers, small businesses, and massive enterprises. The business operates across three segments: Personal Systems, Printing, and Corporate Investments. Personal Systems generates the bulk of revenue, selling commercial and consumer notebooks, point-of-sale systems, displays, and endpoint security. Meanwhile, the Printing unit sells desktop printers, industrial 3D printing equipment, and high-margin ink supplies worldwide. Founded in 1939 and rebranded from Hewlett-Packard in October 2015, the company pairs physical hardware with lifecycle deployment and support contracts globally.

HP is a heavyweight market leader holding the number two spot globally in PC shipments, trailing only Lenovo. Its primary competitive edge is a massive enterprise distribution network paired with a printing business that delivers steady operating margins above 18%. However, commodity hardware competition from rivals like Dell and Canon puts continuous pressure on baseline consumer margins. To protect cash flow, HP focuses heavily on premium workstations, hybrid work setups, and industrial printing rather than chasing low-margin volume. It is not a high-growth tech disruptor, but its entrenched commercial contracts give it a durable defensive position.

The company is currently executing a tactical pivot toward higher-margin premium systems and AI PCs to offset mature hardware volume headwinds. In the third quarter of fiscal 2026, HP delivered $15.7 billion in net revenue, representing a 12.5% increase year-over-year. Personal Systems drove the expansion with revenue surging 18% to $11.8 billion on disciplined pricing, even while total PC unit volume dropped 16%. Meanwhile, Printing revenue contracted 2% to $3.9 billion, showing that premium computing is carrying near-term growth while printing acts as a steady cash cow. HP is proving it can squeeze solid profits out of a mature market, though sustained upside relies on enterprise appetite for higher-end hardware refreshes.

Key Financials
Market Cap
$29.48B
Revenue
$59.16B
EBITDA
$4.64B
Gross Margin
19.7%
Profit Margin
4.1%
Revenue Growth
12.5%
Total Cash
$4.17B
Total Debt
$10.34B
Free Cash Flow
$3.39B


52-Week Price Performance Analysis

Price Statistics
P/E Ratio
12.48
Forward P/E
10.41
Beta
1.19
52-Week High
$32.78
52-Week Low
$17.56
EPS
$2.62
50-Day Avg
$27.01
200-Day Avg
$22.82
Price/Book
-320.44
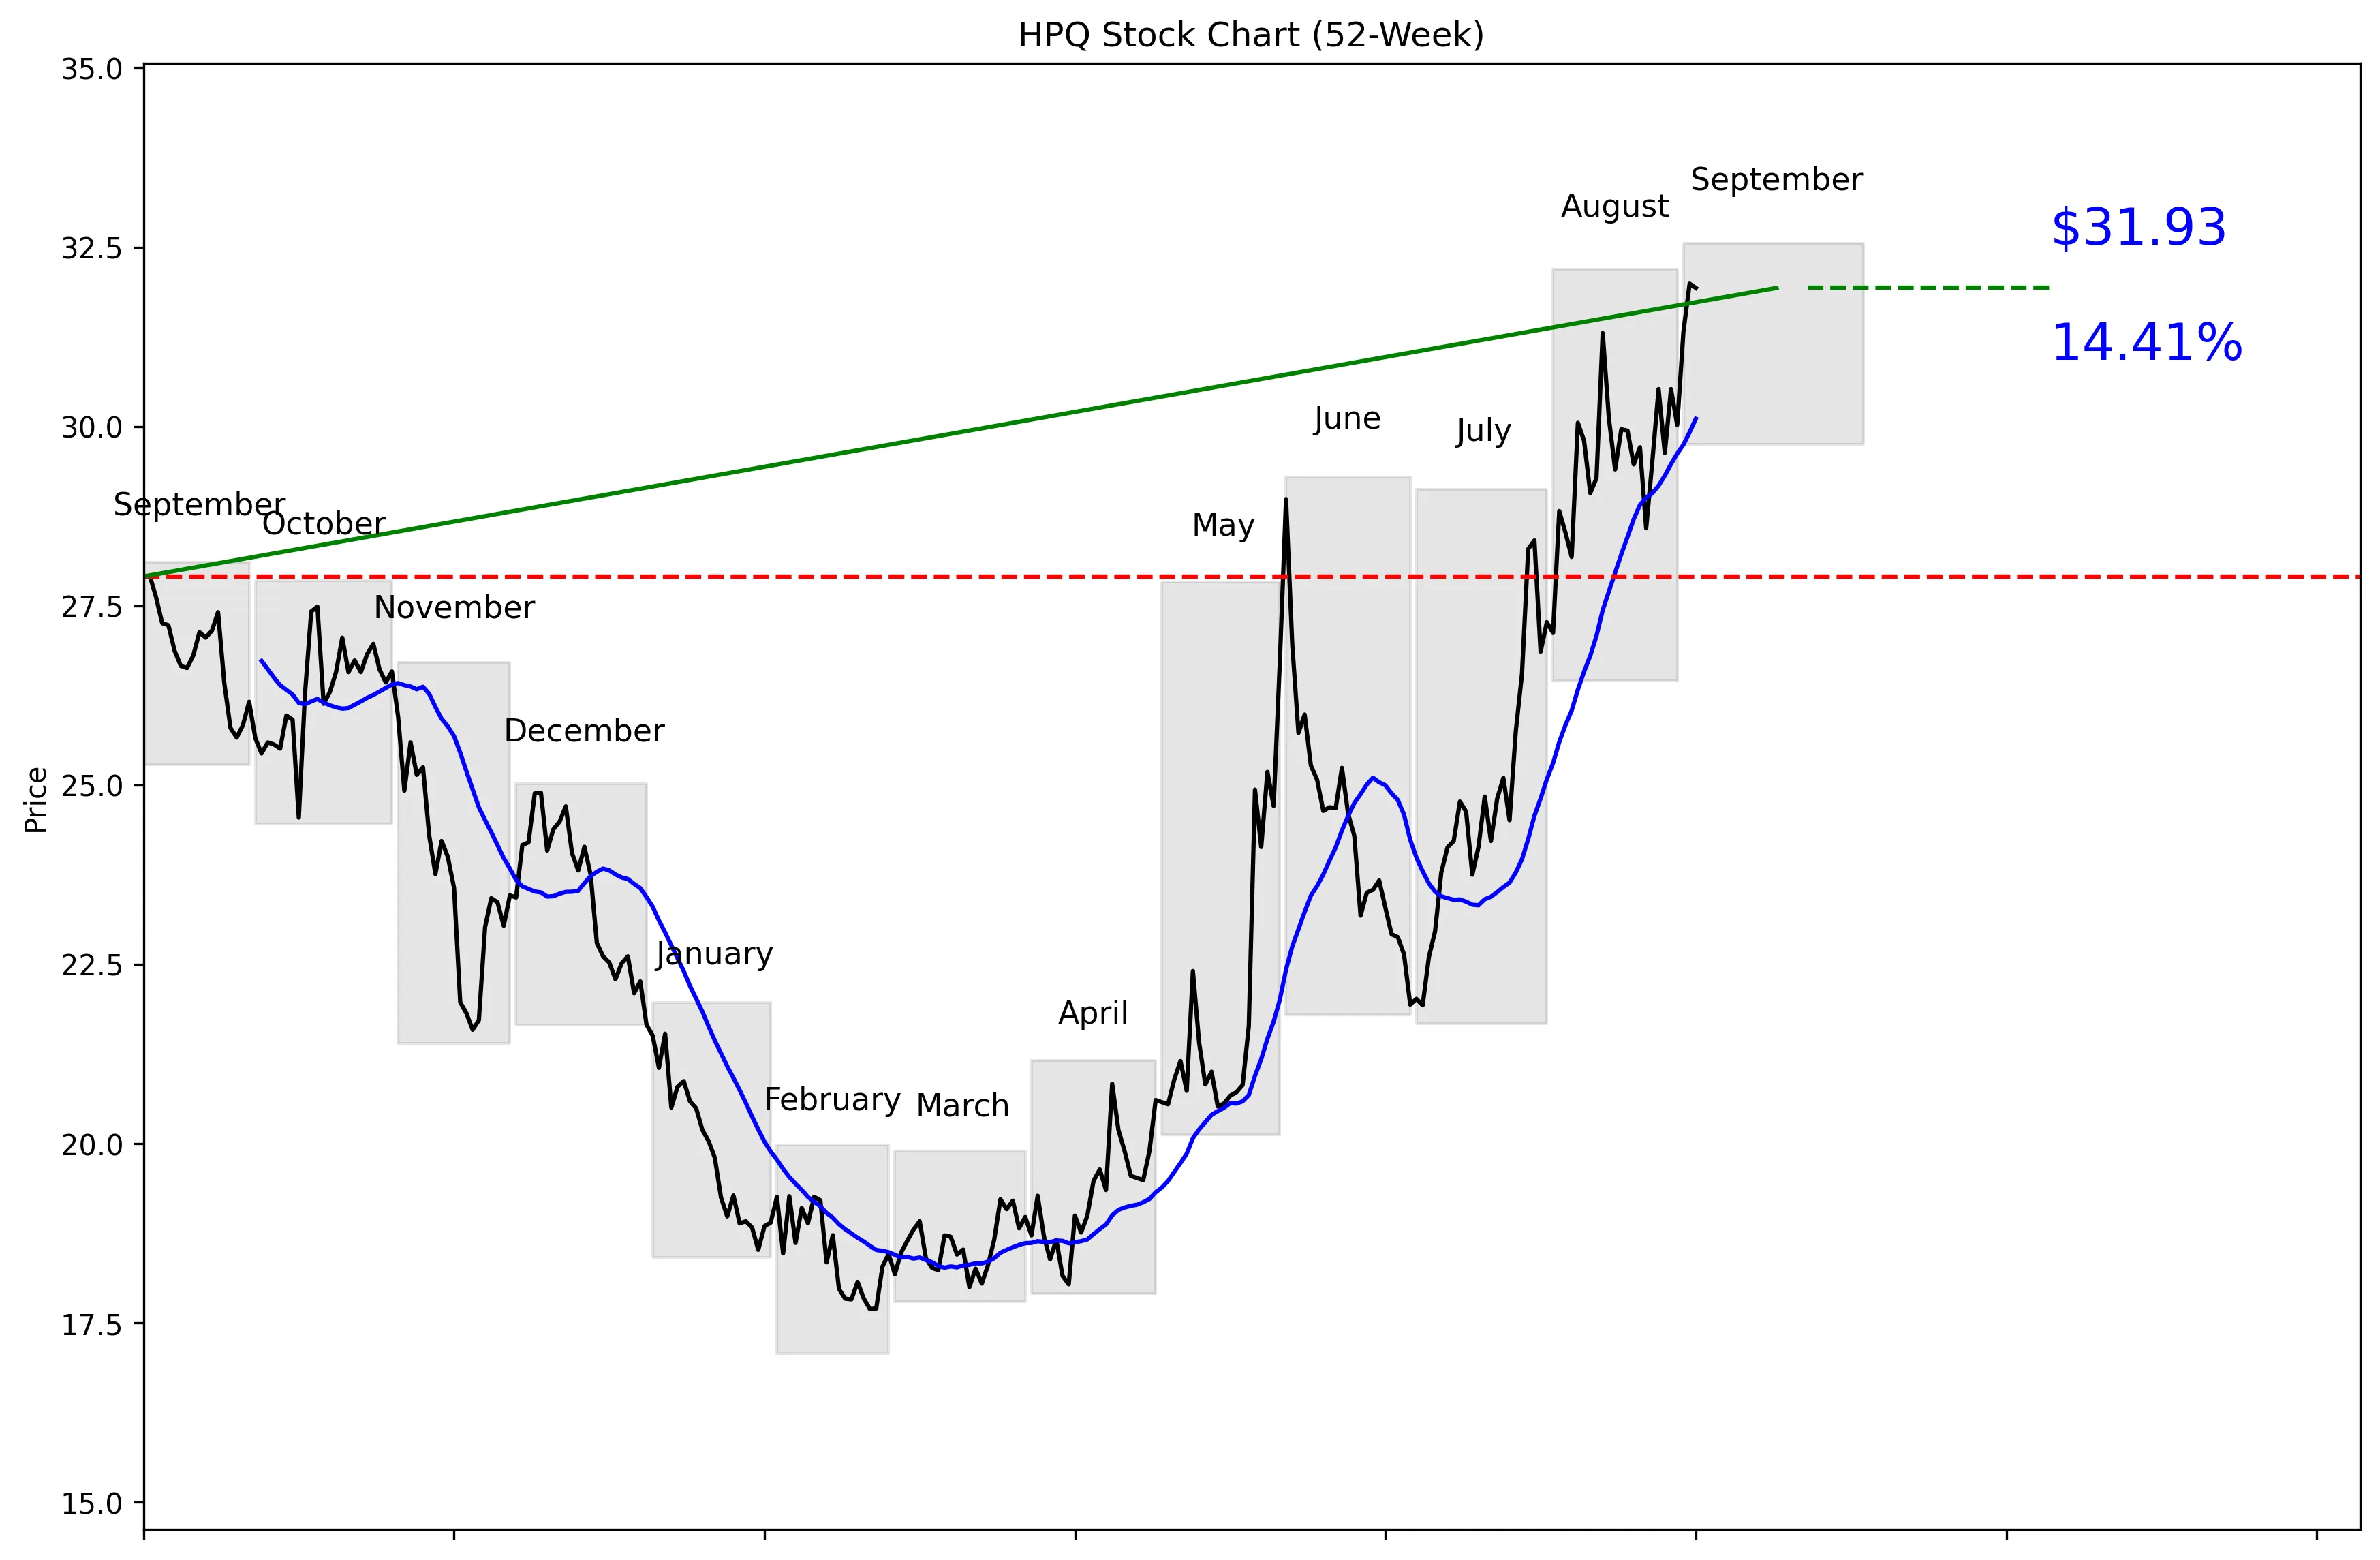
HPQ 52-Week Stock Chart
Technical Analysis
HPQ trades at $32.69, near the top of its technical 52-week range of $17.07 to $32.55. The stock sits 96% of the way from its low to its high, 1.90% below the 52-week high and 87.03% above the low. Momentum is strong, with gains of 7.76% over five trading days and 13.31% over 20 trading days. The price is 6.06% above its 20-day moving average of $30.11. Near-term support is $25.75, while the listed near-term resistance is $31.99.


Recent News and Developments

Bank of America sticks with a $21 bearish target

Bank of America analyst Wamsi Mohan maintained a Sell rating and $21 price target on September 3. The broader consensus from 17 analysts was Hold with an average target of $29.46. Source: Stock Analysis

HPQ posts three gains above 2%

HPQ rose 4.33% to $31.32 on September 1 and gained another 2.14% on September 2. After slipping 0.19% on September 3, the stock advanced 2.22% to $32.64 on September 4. Source: Stock Analysis

HP launches Build Workspace in Japan

HP introduced the Japanese version of its Build Workspace construction platform on September 2, including AI conversion of scanned drawings into editable CAD files. HP said an internal pilot involving more than 1,000 drawings showed drafting-time reductions of up to 80%; the platform is free, while CAD downloads become paid in October 2026. Source: HP Japan


Market Sentiment and Analyst Recommendations

Bull Case
Revenue growth of 12.5% is the clearest reason to own HPQ. The company generates $59.16 billion in revenue against a $29.48 billion market cap and trades at 12.48 times earnings. Price momentum is also strong, with the shares up 13.31% over the last 20 trading days. HP’s Build Workspace adds an AI-driven construction tool that converted scanned drawings into editable CAD files and reduced drafting time by up to 80% in an internal pilot involving more than 1,000 drawings. Paid CAD downloads begin in October 2026, creating a specific commercialization milestone. HP also launched the Smart Tank 7605 in Japan at ¥58,300, with included ink supporting approximately 6,000 monochrome or 8,000 color pages. The bull case is straightforward: solid revenue growth, a modest P/E, strong momentum and new products provide multiple ways for the business to deliver.
Bear Case
The stock price of $32.69 is already above the average analyst target of $29.46. Bank of America is more bearish, maintaining a Sell rating and a $21 target on September 3. HPQ also sits 96% of the way through its technical 52-week range, leaving little room before the listed high. The balance sheet carries $10.34 billion in debt against $4.17 billion in cash. Momentum can reverse sharply when a stock is 6.06% above its 20-day moving average and has gained 13.31% in 20 trading days. The new Japanese products are real launches, but the provided data does not show their expected revenue or profit contribution. At this price, investors are buying strength while both the consensus target and Bank of America’s target sit below the stock.
What to Watch
The first threshold is whether HPQ can hold above the listed near-term resistance of $31.99. A move back toward the $30.11 20-day moving average would test whether the recent 7.76% five-day and 13.31% 20-day momentum can persist. The key downside level is the 30-day low of $25.75. Investors should track whether revenue growth remains near the reported 12.5%. October 2026 is a concrete catalyst because HP plans to begin charging for CAD downloads from Build Workspace. Adoption of the Smart Tank 7605 after its September 3 Japan launch also matters, although no sales forecast was provided. The thesis improves if growth and product adoption support the rally; it weakens if price retreats while the $29.46 consensus target remains below the shares.
Analyst Consensus
HOLD

Based on 16 analyst opinions
Low Target
$19.00
Mean Target
$29.46
High Target
$72.00


Earnings and Financial Data

Sector
Technology
Industry
Computer Hardware
Employees
55,000
Earnings & Dividends
Next Earnings
Nov 24, 2026
EPS (Trailing)
$2.62
Dividend Yield
376.0%
Payout Ratio
45.4%

Frequently Asked Questions

Is HPQ a good stock to buy?
HPQ has 12.5% revenue growth and trades at a P/E of 12.48, but the analyst recommendation is Hold based on 16 analysts. The takeaway is that the fundamentals offer support, while the current consensus does not signal a clear buy.
What is HPQ’s price target?
The average analyst target is $29.46, with estimates ranging from $19.00 to $72.00. The takeaway is that analyst expectations vary widely and the average target is below the current $32.69 price.
How much cash and debt does HP have?
HP has $4.17 billion in total cash and $10.34 billion in total debt. The takeaway is that total debt materially exceeds available cash.
Is HPQ near its 52-week high?
HPQ is 1.90% below its technical 52-week high and sits 96% of the way from the $17.07 low to the $32.55 high. The takeaway is that the stock is trading near the top of its annual range.
What are HPQ’s support and resistance levels?
Near-term support is the 30-day low of $25.75, while near-term resistance is the 30-day high of $31.99. The takeaway is that these are the key supplied levels for tracking a pullback or continued strength.

Related Stock Reports

Disclaimer: This report is for informational purposes only and does not constitute financial advice. The analysis and opinions expressed are those of AltStation.io and should not be relied upon as the sole basis for investment decisions. Always conduct your own research and consult with a qualified financial advisor before making investment decisions. Past performance does not guarantee future results. Updated September 06, 2026.