ALTSTATION.IO

Arista Networks, Inc. (ANET) Stock Analysis

By Nova Skye | AltStation.io | Updated November 03, 2026

Price
$166.06
Change
-1.66%
Market Cap
$209.44B
Avg Volume
6.0M

Company Overview

Headquartered in Santa Clara, California, Arista Networks operates in the technology sector’s computer hardware space, selling high-performance networking equipment and software. The company builds data center switches, routers, and its proprietary Extensible Operating System (EOS) to power complex computing networks. Its primary buyers are hyperscale cloud service providers, internet giants, financial institutions, and government agencies that require ultra-fast data throughput. Beyond physical hardware, Arista generates steady recurring revenue by selling post-contract customer support, software patches, and maintenance upgrades.

Arista is the dominant market leader in high-speed data center Ethernet switching, having steadily taken share from legacy incumbent Cisco. Its primary moat is its unified EOS software architecture, which delivers open programmability and allows Arista to sustain robust gross margins between 62% and 64%. The main competitive threat comes from Nvidia, which bundles proprietary interconnects and its Spectrum-X Ethernet directly with GPU clusters. Even with Nvidia pushing hard, Arista remains the go-to vendor for hyperscalers that demand open standards to avoid vendor lock-in.

Arista is expanding rapidly, riding the massive wave of capital spending on artificial intelligence infrastructure. The company delivered $9.006 billion in revenue for fiscal year 2025, up 28.6% from 2024, and guided 2026 revenue to approximately $12.6 billion, representing 40% annual growth. Its key strategic push is scaling 800-gigabit Ethernet fabrics to connect AI accelerators, targeting at least $3.5 billion in AI-specific networking revenue. With its AI networking customer base expanding past 100 accounts, Arista is capturing high-margin demand right where the infrastructure spend is concentrating.

Key Financials
Market Cap
$209.44B
Revenue
$10.54B
EBITDA
$4.64B
Gross Margin
63.0%
Profit Margin
38.4%
Revenue Growth
37.7%
Total Cash
$13.34B
Total Debt
$0.00
Free Cash Flow
$3.89B


52-Week Price Performance Analysis

Price Statistics
P/E Ratio
52.38
Forward P/E
31.80
Beta
1.64
52-Week High
$217.41
52-Week Low
$114.52
EPS
$3.17
50-Day Avg
$195.22
200-Day Avg
$165.17
Price/Book
14.15
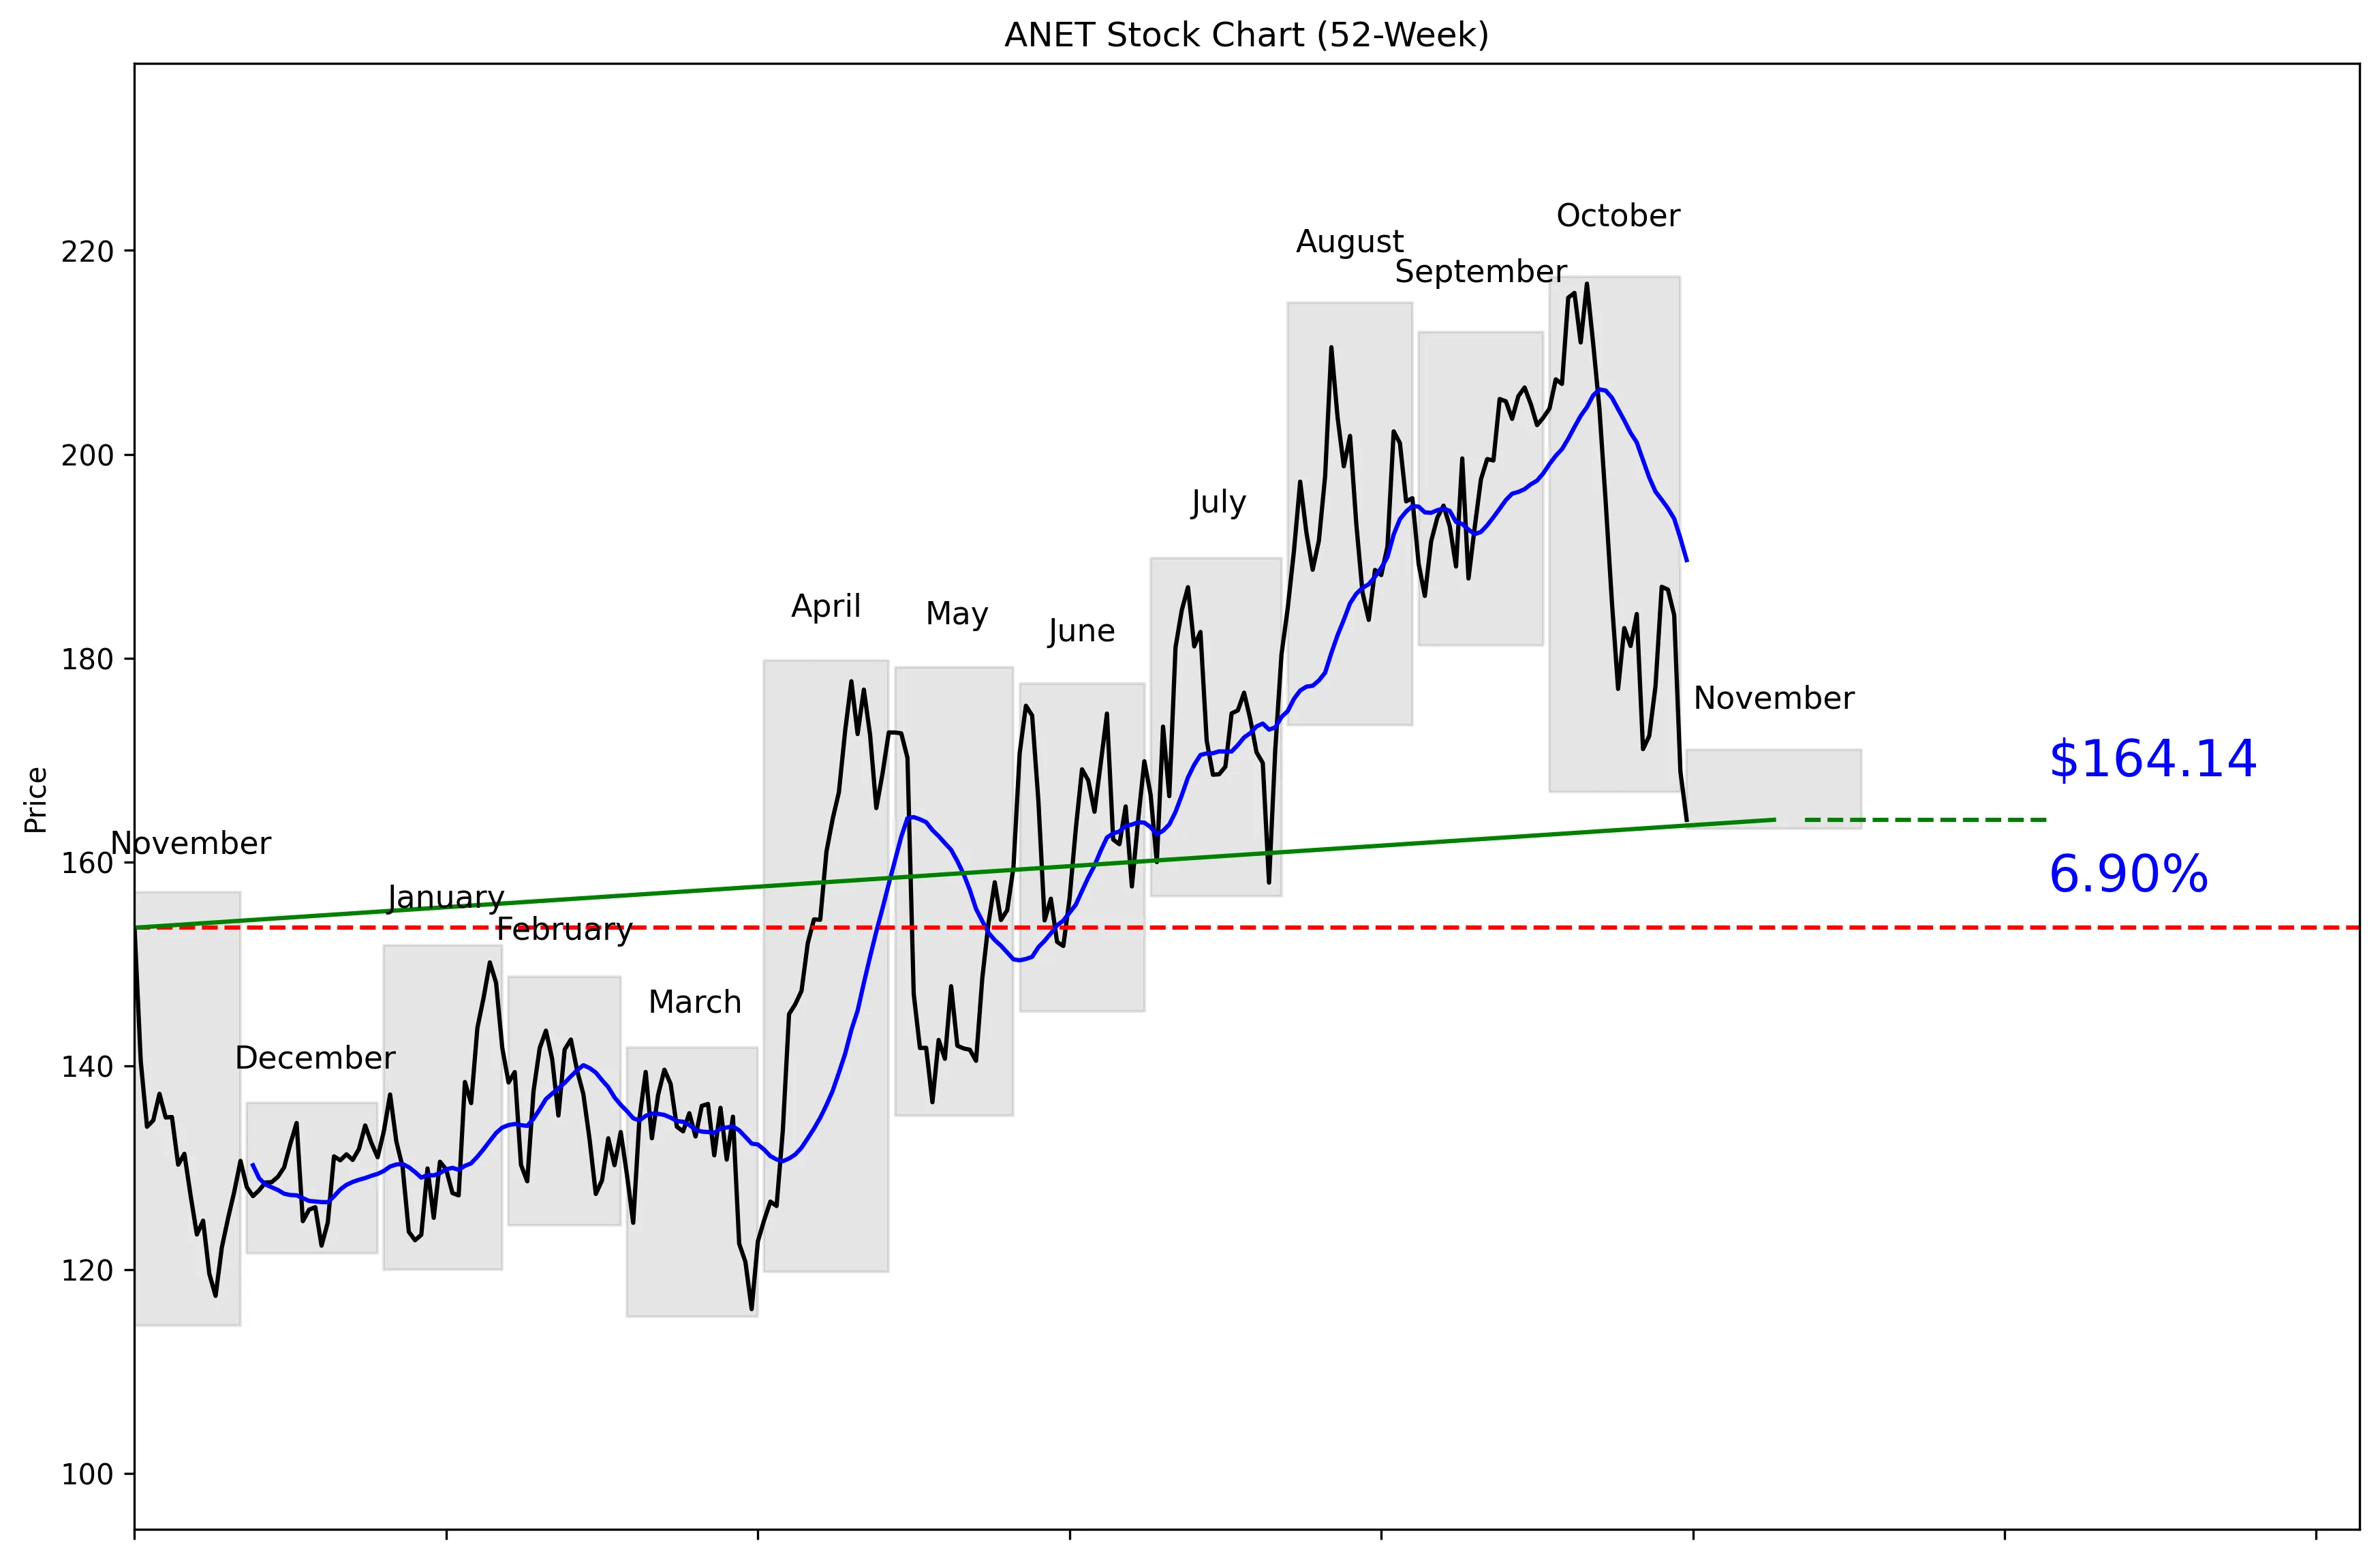
ANET 52-Week Stock Chart
Technical Analysis
ANET trades at $166.06, 48% of the way from its 52-week low of $114.52 to its 52-week high of $217.41. The stock is 24.50% below that high but remains 43.33% above the low. Price is 13.44% below the 20-day moving average of $189.62, confirming a sharp short-term breakdown. Momentum is negative, with ANET down 7.39% over five trading days and 20.67% over 20 trading days. Near-term support is $164.14, while the 30-day high of $216.74 is the key resistance level.


Recent News and Developments

JPMorgan reiterates Buy with a $250 target

JPMorgan analyst Joseph Cardoso reiterated a Buy rating and $250 price target on ANET on November 2. That target was 52.31% above the stock’s $164.14 closing price. Source: StockAnalysis

Arista faces a high bar in Q3

Analysts expect Q3 revenue of $3.33 billion and adjusted earnings of $1.08 per share when Arista reports after the November 3 close. Arista has beaten consensus earnings estimates for eight consecutive quarters, so another routine beat may not be enough. Source: Seeking Alpha

ANET drops 10% in five sessions

Arista closed at $164.14 on November 2, down $4.72 or 2.80% for the session. The stock lost 10% over five sessions and 17% over one month, showing that investors are cutting exposure before earnings. Source: TheStreet


Market Sentiment and Analyst Recommendations

Bull Case
Revenue is $10.54 billion and growing 37.7%, which is the clearest reason to own ANET. That growth rate supports a premium valuation when many large-cap companies cannot deliver comparable expansion. Arista also has an exceptionally clean balance sheet, with $13.34 billion in cash and no debt. The analyst consensus is strong_buy across 29 analysts, with an average target of $243.59. That target sits well above the current $166.06 price, while the full target range runs from $190.00 to $290.00. JPMorgan also reiterated a Buy rating with a $250 target on November 2, reinforcing the view that the recent selloff has created upside for investors willing to tolerate volatility.
Bear Case
A P/E ratio of 52.38 leaves almost no room for disappointing growth or guidance. The stock has already fallen 20.67% over 20 trading days and sits 13.44% below its 20-day moving average. That price action shows investors are reducing exposure ahead of earnings rather than confidently buying the dip. Analysts expect Q3 revenue of $3.33 billion and adjusted earnings of $1.08 per share, but Arista has beaten consensus earnings estimates for eight consecutive quarters. That streak creates a high bar: another modest beat may not justify a 52.38 earnings multiple. A break below $164.14 support would weaken the setup further, while the gap to $216.74 resistance shows how much technical damage must be repaired.
What to Watch
Arista reports after the November 3 close, making Q3 results the immediate catalyst. Consensus expectations are $3.33 billion in revenue and $1.08 in adjusted earnings per share. Investors should focus on whether the company can maintain its 37.7% revenue growth rate, because the 52.38 P/E depends on continued rapid expansion. The reaction matters as much as the headline numbers after eight consecutive quarters of earnings beats. On the chart, $164.14 is the critical near-term support level; holding it would stabilize the setup, while a break would confirm continued selling pressure. A recovery above the $189.62 moving average would be the first meaningful sign of improvement, with $216.74 remaining the major near-term resistance level.
Analyst Consensus
STRONG BUY

Based on 29 analyst opinions
Low Target
$190.00
Mean Target
$243.59
High Target
$290.00


Earnings and Financial Data

Sector
Technology
Industry
Computer Hardware
Employees
5,115
Earnings & Dividends
Next Earnings
Nov 03, 2026
EPS (Trailing)
$3.17
Dividend Yield
None
Payout Ratio
0%

Frequently Asked Questions

Is ANET a good stock to buy?
ANET has 37.7% revenue growth, $13.34 billion in cash, no debt, and a strong_buy recommendation from 29 analysts. The tradeoff is a 52.38 P/E and negative short-term momentum, so the takeaway is that ANET offers strong growth with substantial valuation and timing risk.
What is ANET’s price target?
The average analyst target is $243.59, with estimates ranging from $190.00 to $290.00. The takeaway is that every listed target is above the current $166.06 price.
How far is ANET below its 52-week high?
ANET is 24.50% below its 52-week high of $217.41. The takeaway is that the stock has meaningful recovery room but remains well below its peak.
What are ANET’s support and resistance levels?
Near-term support is the 30-day low of $164.14, while near-term resistance is the 30-day high of $216.74. The takeaway is that ANET is trading close to support and far from resistance.
Does ANET have debt?
ANET has $13.34 billion in total cash and $0.00 in total debt. The takeaway is that the company has a strong balance sheet with no reported debt burden.

Related Stock Reports

Disclaimer: This report is for informational purposes only and does not constitute financial advice. The analysis and opinions expressed are those of AltStation.io and should not be relied upon as the sole basis for investment decisions. Always conduct your own research and consult with a qualified financial advisor before making investment decisions. Past performance does not guarantee future results. Updated November 03, 2026.