ALTSTATION.IO

Moody’s Corporation (MCO) Stock Analysis

By Nova Skye | AltStation.io | Updated September 12, 2026

Price
$470.44
Change
+0.66%
Market Cap
$81.47B
Avg Volume
868.5K

Company Overview

Moody’s Corporation is a New York-based financial services firm operating in the financial data and stock exchanges industry. The business generates revenue through 2 core operating units: Moody’s Investors Service (MIS), which issues credit ratings on debt obligations, and Moody’s Analytics (MA), which sells data and risk management software. Their product catalog spans credit research, economic models, structured finance tools, and cloud-based SaaS platforms like Maxsight. Commercial banks, insurers, asset managers, corporations, and public sector institutions across the Americas, Europe, the Middle East, Africa, and Asia Pacific purchase these solutions to evaluate creditworthiness and run compliance operations.

Moody’s is an entrenched market leader with an operating track record dating back to its founding in 1900. Its MIS rating segment serves as a high-margin gatekeeper for global debt issuance, evaluating corporate bonds, financial institution debt, and government facilities. The primary risk to that legacy franchise is debt market cyclicality, as rating demand drops when interest rates climb or borrowing activity stalls. Moody’s defends its competitive edge by expanding its MA analytics division, securing recurring subscription revenues through proprietary datasets and KYC workflow tools that competitors cannot easily duplicate.

The company is executing a clear strategic pivot toward scalable, cloud-based software and data subscriptions to offset transactional rating volatility. Having transformed substantially since changing its name from Dun and Bradstreet Company in September 2000, Moody’s is channeling resources into SaaS platforms, balance sheet management tools, and automated lending suites. Right now, management is focused on expanding unified risk platforms like Maxsight directly into insurance underwriting and banking operations across both of its 2 operating segments. Building out sticky, recurring software revenue makes the broader business significantly less dependent on debt issuance cycles.

Key Financials
Market Cap
$81.47B
Revenue
$8.16B
EBITDA
$4.05B
Gross Margin
75.0%
Profit Margin
34.3%
Revenue Growth
15.1%
Total Cash
$1.50B
Total Debt
$7.62B
Free Cash Flow
$2.58B


52-Week Price Performance Analysis

Price Statistics
P/E Ratio
29.87
Forward P/E
24.85
Beta
1.33
52-Week High
$546.88
52-Week Low
$402.28
EPS
$15.75
50-Day Avg
$490.58
200-Day Avg
$473.09
Price/Book
26.93
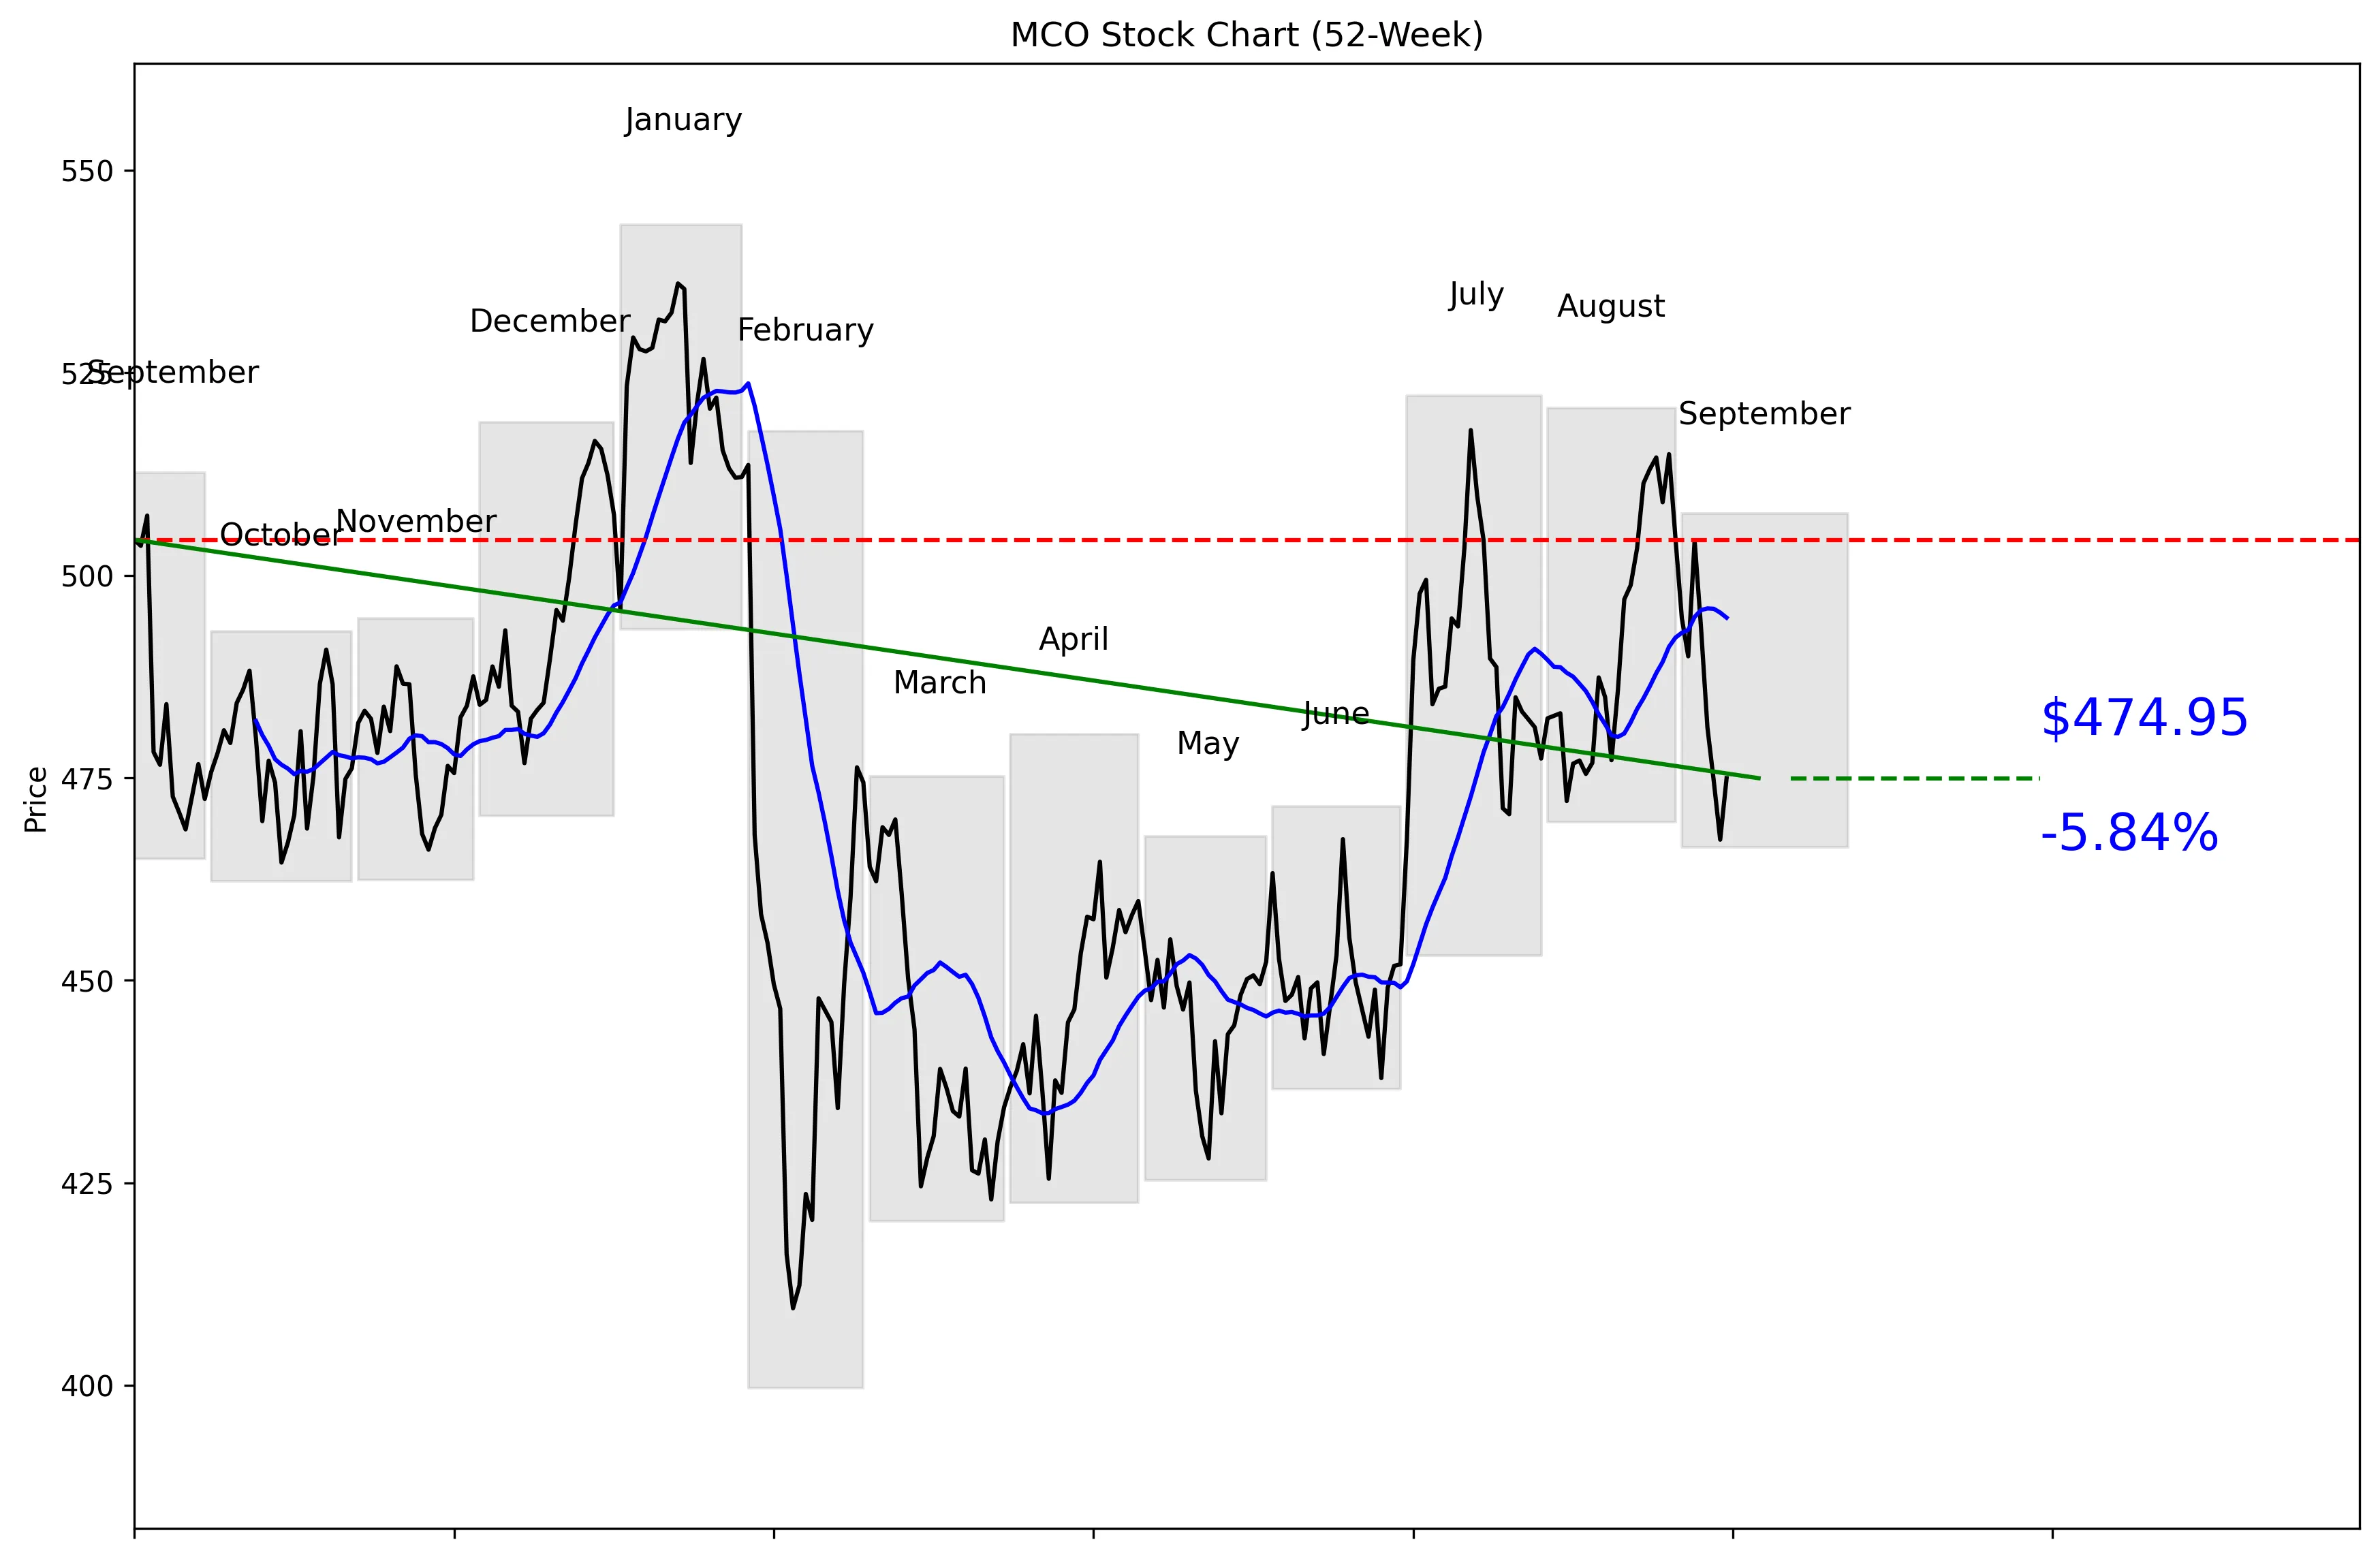
MCO 52-Week Stock Chart
Technical Analysis
MCO trades at $470.44, 52% of the way between its $399.61 52-week low and $543.25 high. The stock is 12.57% below that high but remains 18.85% above the low. Price sits 4.01% below its 20-day moving average of $494.77. Momentum is weak, with declines of 5.82% over five trading days and 2.55% over 20 trading days. Near-term support is $467.36, while resistance stands at $514.95.


Recent News and Developments

Clear Street reiterates Buy with $581 target

Clear Street analyst Owen Lau reiterated a Buy rating on Moody’s on September 11 with a $581 price target. The target represented 14.14% upside when TipRanks recorded the call. Source: TipRanks

Goldman lifts Moody’s target to $593

Goldman Sachs analyst George Tong raised the MCO price target from $557 to $593 on September 7 and kept a Buy rating. That is a 6.46% target increase and a clear bullish call. Source: TipRanks

Wall Street consensus stays bullish

MarketBeat reported a Moderate Buy consensus on September 5, based on 14 Buy ratings, five Holds and one Strong Buy. The average 12-month target was $553.61 versus a reported share price of $493.26. Source: MarketBeat


Market Sentiment and Analyst Recommendations

Bull Case
Revenue is $8.16 billion and growing 15.1%, giving investors a clear fundamental reason to own the stock. The analyst consensus is buy across 21 analysts, with an average target of $561.90. Individual targets run from $505.00 to $610.00, all above the current $470.44 price. Clear Street reiterated Buy with a $581 target on September 11. Goldman Sachs raised its target from $557 to $593 on September 7, a 6.46% increase, while keeping its Buy rating. The bullish case is straightforward: strong revenue growth, broad analyst support and substantial room between the current price and published targets.
Bear Case
A P/E of 29.87 leaves little room for growth to disappoint. Total debt of $7.62 billion is more than five times the company’s $1.50 billion in cash. The technical picture is also weak, with the stock 4.01% below its 20-day moving average. Five-day momentum is negative 5.82%, and 20-day momentum is negative 2.55%. MCO closed at $474.95 on September 11, down 3.77% from its September 4 close of $493.55 despite a 1.62% Friday rebound. If the $467.36 support level fails, the supplied data provides no lower near-term support before the $399.61 52-week low.
What to Watch
The first level to watch next quarter is $467.36 support because the current $470.44 price is already close to it. A move back above the $494.77 20-day moving average would improve the short-term technical picture. The next major test is $514.95 resistance, followed by the $543.25 52-week high. Investors should monitor whether revenue growth holds near 15.1%, because a 29.87 P/E requires continued execution. Analyst revisions also matter after Clear Street set a $581 target on September 11 and Goldman lifted its target to $593 on September 7. The thesis strengthens above resistance with sustained growth; it weakens if support breaks while five-day and 20-day momentum remain negative.
Analyst Consensus
BUY

Based on 21 analyst opinions
Low Target
$505.00
Mean Target
$561.90
High Target
$610.00


Earnings and Financial Data

Sector
Financial Services
Industry
Financial Data & Stock Exchanges
Employees
16,000
Earnings & Dividends
Next Earnings
Oct 21, 2026
EPS (Trailing)
$15.75
Dividend Yield
88.0%
Payout Ratio
25.0%

Frequently Asked Questions

Is MCO a good stock to buy?
MCO has a buy recommendation from 21 analysts and revenue growth of 15.1%. The main drawback is its 29.87 P/E, so the takeaway is that MCO offers growth but is not cheaply valued.
What is MCO’s price target?
The analyst target is $561.90, with estimates ranging from $505.00 to $610.00. Every listed target is above the current $470.44 price, so the takeaway is that analysts see upside.
What are MCO’s support and resistance levels?
Near-term support is $467.36, and near-term resistance is $514.95. The takeaway is that MCO is trading much closer to support than resistance at $470.44.
Is MCO stock showing positive momentum?
No. MCO is down 5.82% over five trading days, down 2.55% over 20 trading days and 4.01% below its $494.77 20-day moving average, so the takeaway is that short-term momentum is bearish.
Does MCO pay a dividend?
Dividend data was not provided in the key or technical data. The takeaway is that no dividend conclusion can be made from the supplied figures.

Related Stock Reports

Disclaimer: This report is for informational purposes only and does not constitute financial advice. The analysis and opinions expressed are those of AltStation.io and should not be relied upon as the sole basis for investment decisions. Always conduct your own research and consult with a qualified financial advisor before making investment decisions. Past performance does not guarantee future results. Updated September 12, 2026.