ALTSTATION.IO

FactSet Research Systems Inc. (FDS) Stock Analysis

By Nova Skye | AltStation.io | Updated October 20, 2026

Price
$300.52
Change
-0.38%
Market Cap
$10.69B
Avg Volume
844.4K

Company Overview

FactSet Research Systems operates in the Financial Services sector under the Financial Data & Stock Exchanges industry, headquartered in Norwalk, Connecticut. Founded in 1978, the company sells subscription-based financial data, configurable analytical workstations, and enterprise data feeds via APIs and cloud tools. Their software supports the entire investment lifecycle, handling everything from fundamental research and trade execution to risk management and portfolio reporting. They sell directly to institutional finance, serving asset managers, investment bankers, hedge funds, wealth managers, and private equity professionals worldwide.

FactSet sits as a top-tier challenger in the institutional data market, going head-to-head with Bloomberg, LSEG Workspace, and S&P Capital IQ. Their competitive moat comes from deep portfolio analytics, customizable desktop interfaces, and flexible enterprise data integration that makes their software sticky once installed. They are not the default choice on trading desks where Bloomberg’s messaging monopoly rules, but they punch above their weight in buy-side research and portfolio construction. That reliance on core buy-side seats leaves them exposed when financial institutions trim headcounts or consolidate vendors, but their high customer retention keeps them defensible.

Right now, FactSet is delivering steady, predictable expansion. In the third quarter of fiscal 2026, revenue climbed 6.4% year-over-year to $622.9 million, while organic Annual Subscription Value reached $2.48 billion on 7.1% growth. To accelerate product differentiation, the company entered a strategic partnership with Google Cloud to build AI-powered solutions across its platform. This is a disciplined compounder modernizing its tech stack to protect high-margin subscription cash flow rather than chasing unproven pivots.

Key Financials
Market Cap
$10.69B
Revenue
$2.48B
EBITDA
$880.79M
Gross Margin
50.6%
Profit Margin
21.5%
Revenue Growth
6.3%
Total Cash
$265.33M
Total Debt
$1.54B
Free Cash Flow
$641.53M


52-Week Price Performance Analysis

Price Statistics
P/E Ratio
20.63
Forward P/E
13.85
Beta
0.77
52-Week High
$320.48
52-Week Low
$185.00
EPS
$14.57
50-Day Avg
$285.78
200-Day Avg
$248.93
Price/Book
5.31
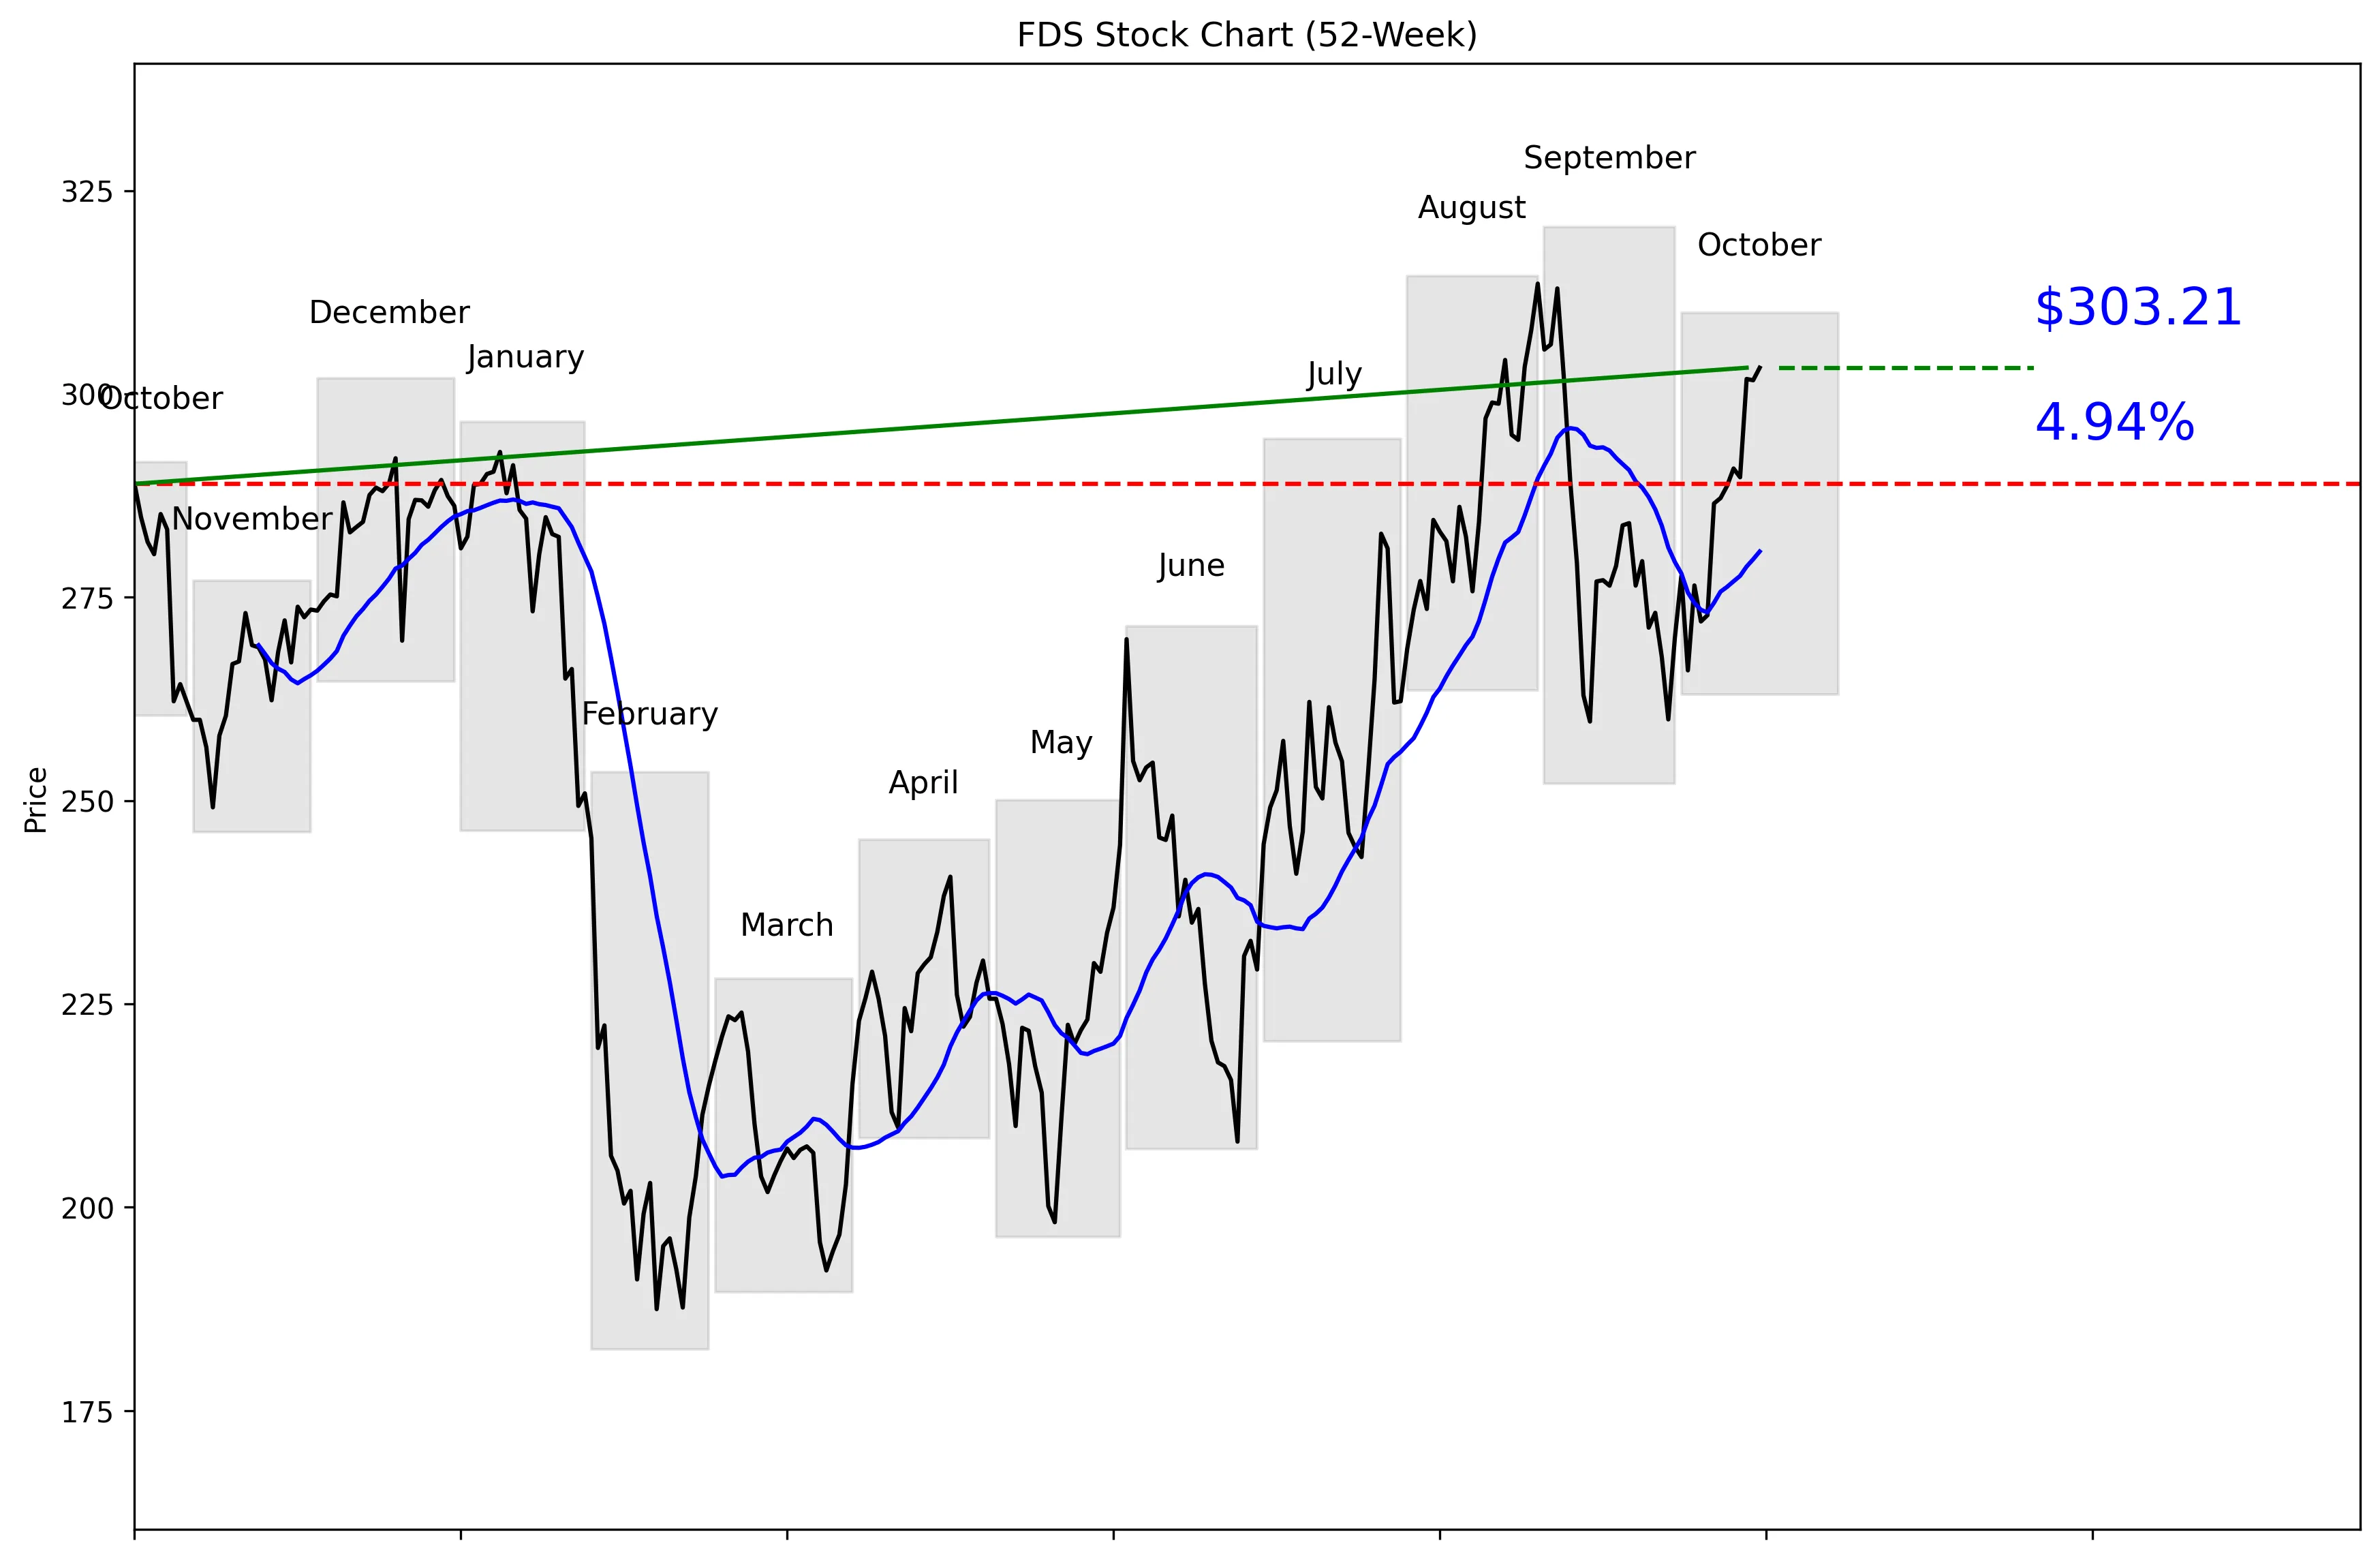
FDS 52-Week Stock Chart
Technical Analysis
FDS trades at $300.52, 87% of the way from its $182.47 52-week low to its $320.48 high. The stock is 5.39% below that high and 66.17% above the low. Price sits 8.05% above the 20-day moving average of $280.61, while five-day and 20-day momentum stand at 5.04% and 6.73%, respectively. Near-term support is $259.71, and resistance is $303.21. The trend is bullish, but the stock is already pressing directly against resistance.


Recent News and Developments

FactSet adds Nasdaq Private Market cap-table data

FactSet announced an October 20 partnership with Nasdaq Private Market to integrate capitalization-table data into FactSet Workstation. The source-backed ownership data will support private-company due diligence, valuation analysis and deal sourcing. Source: GlobeNewswire

BMO lifts FactSet price target to $314

BMO Capital raised its FDS price target from $300 to $314 on October 13 but kept its Market Perform rating. The firm saw little evidence of AI disruption while flagging unresolved questions about growth durability, renewal pricing and AI monetization. Source: The Fly via TipRanks

FDS jumps 4.17% in one session

FactSet shares rallied 4.17% to $301.83 on October 15, while the S&P 500 gained 0.33% and the Dow rose 1.08%. FDS finished 5.82% below its $320.48 52-week high. Source: MarketWatch


Market Sentiment and Analyst Recommendations

Bull Case
Revenue is $2.48 billion and growing 6.3%, giving FactSet a positive growth base. The October 20 Nasdaq Private Market partnership expands FactSet Workstation with capitalization-table data for private-company due diligence, valuation analysis and deal sourcing. That makes the platform more useful without requiring customers to leave FactSet for source-backed ownership data. BMO Capital raised its price target from $300 to $314 on October 13 and reported little evidence of AI disruption. The stock’s 5.04% five-day momentum and 6.73% 20-day momentum show that buyers currently control the tape. The bullish reason to buy is continued product expansion plus potential upside toward the analyst-range high of $340.
Bear Case
The consensus analyst target is $280, below the current $300.52 price, and the recommendation is hold across 16 analysts. FDS also trades at 20.63 times earnings while revenue is growing 6.3%, so the valuation demands continued execution. Total debt of $1.54 billion substantially exceeds total cash of $265.33 million. BMO’s higher $314 target still came with a Market Perform rating and unresolved concerns about growth durability, renewal pricing and AI monetization. Technically, the stock is only 5.39% below its 52-week high and is testing $303.21 resistance after gaining 6.73% over 20 trading days. The bear case is simple: expectations have risen faster than the consensus outlook, leaving limited room for disappointment.
What to Watch
Watch how FactSet turns the October 20 Nasdaq Private Market partnership into adoption and revenue. Revenue growth needs to hold above or improve from the reported 6.3% rate to support a 20.63 P/E. Renewal pricing and AI monetization are the core operating questions identified by BMO, and better evidence on either would strengthen the bull case. Analysts currently recommend holding the stock, with a $280 target and a range of $212 to $340, so revisions to those figures will show whether expectations are improving. On the chart, a sustained move above $303.21 would clear the stated 30-day resistance and put the $320.48 high back in focus. A drop below the $280.61 moving average would weaken momentum, while $259.71 is the key near-term support level.
Analyst Consensus
HOLD

Based on 16 analyst opinions
Low Target
$212.00
Mean Target
$280.00
High Target
$340.00


Earnings and Financial Data

Sector
Financial Services
Industry
Financial Data & Stock Exchanges
Employees
N/A
Earnings & Dividends
Next Earnings
Dec 17, 2026
EPS (Trailing)
$14.57
Dividend Yield
154.0%
Payout Ratio
29.4%

Frequently Asked Questions

Is FDS a good stock to buy?
FDS trades at $300.52, while 16 analysts rate it hold and assign a $280 consensus target. The takeaway is that current momentum is strong, but the consensus data does not show an obvious bargain.
What is the analyst price target for FDS?
The consensus target is $280, with estimates ranging from $212 to $340. The takeaway is that the average target is below the current price, although the top estimate leaves room for upside.
Is FDS stock overvalued?
FDS has a P/E of 20.63 and revenue growth of 6.3%. The takeaway is that investors are paying a meaningful earnings multiple for moderate revenue growth.
How much cash and debt does FactSet have?
FactSet has $265.33 million in total cash and $1.54 billion in total debt. The takeaway is that debt exceeds cash by $1.27 billion.
What are the support and resistance levels for FDS?
Near-term support is $259.71, while near-term resistance is $303.21. The takeaway is that the $300.52 share price is currently much closer to resistance than support.

Related Stock Reports

Disclaimer: This report is for informational purposes only and does not constitute financial advice. The analysis and opinions expressed are those of AltStation.io and should not be relied upon as the sole basis for investment decisions. Always conduct your own research and consult with a qualified financial advisor before making investment decisions. Past performance does not guarantee future results. Updated October 20, 2026.