ALTSTATION.IO

Regeneron Pharmaceuticals, Inc. (REGN) Stock Analysis

By Nova Skye | AltStation.io | Updated September 19, 2026

Price
$805.56
Change
-0.59%
Market Cap
$82.94B
Avg Volume
829.6K

Company Overview

Regeneron Pharmaceuticals is a commercial-stage biotechnology company founded in 1988 and headquartered in Tarrytown, New York. They develop and manufacture prescription medicines targeting major eye disorders, severe inflammatory conditions, cancer, and cardiovascular diseases. Their primary commercial lineup includes Dupixent for asthma and eczema, EYLEA injections for macular degeneration and diabetic eye conditions, Libtayo for skin cancer, Kevzara for rheumatoid arthritis, and Praluent for severe cholesterol disorders. These treatments are distributed worldwide to healthcare systems, specialty clinics, and retail pharmacies.

Regeneron operates as an established market leader in ophthalmology and immunology, driven by the massive adoption of EYLEA and Dupixent. Their competitive edge comes from proven antibody discovery capabilities and global commercial alliances, including a key partnership with Bayer to commercialize EYLEA and EYLEA 8 mg. The biggest threat to their position is revenue concentration in legacy blockbusters, making them vulnerable to competing therapies in the crowded retinal disease and oncology spaces. To defend their territory, they focus on upgrading standard treatments with higher-dose formulations while scaling proven immunology indications.

Right now, the company is pivoting toward next-generation therapeutic modalities through aggressive pipeline dealmaking. Regeneron has locked down strategic collaborations in CRISPR and gene editing with Intellia and Tessera, RNAi therapeutics with Alnylam, and radiopharmaceuticals and bispecifics with Telix and CytomX. They have also entered the high-demand metabolic category by licensing HS-20094, a dual GLP-1/GIP receptor candidate from Hansoh Pharmaceuticals. This external development push is crucial for establishing their next wave of clinical growth.

Key Financials
Market Cap
$82.94B
Revenue
$15.53B
EBITDA
$4.70B
Gross Margin
44.5%
Profit Margin
27.9%
Revenue Growth
16.7%
Total Cash
$7.99B
Total Debt
$2.71B
Free Cash Flow
$3.07B


52-Week Price Performance Analysis

Price Statistics
P/E Ratio
19.92
Forward P/E
13.36
Beta
0.19
52-Week High
$859.34
52-Week Low
$541.00
EPS
$40.43
50-Day Avg
$741.41
200-Day Avg
$732.60
Price/Book
2.55
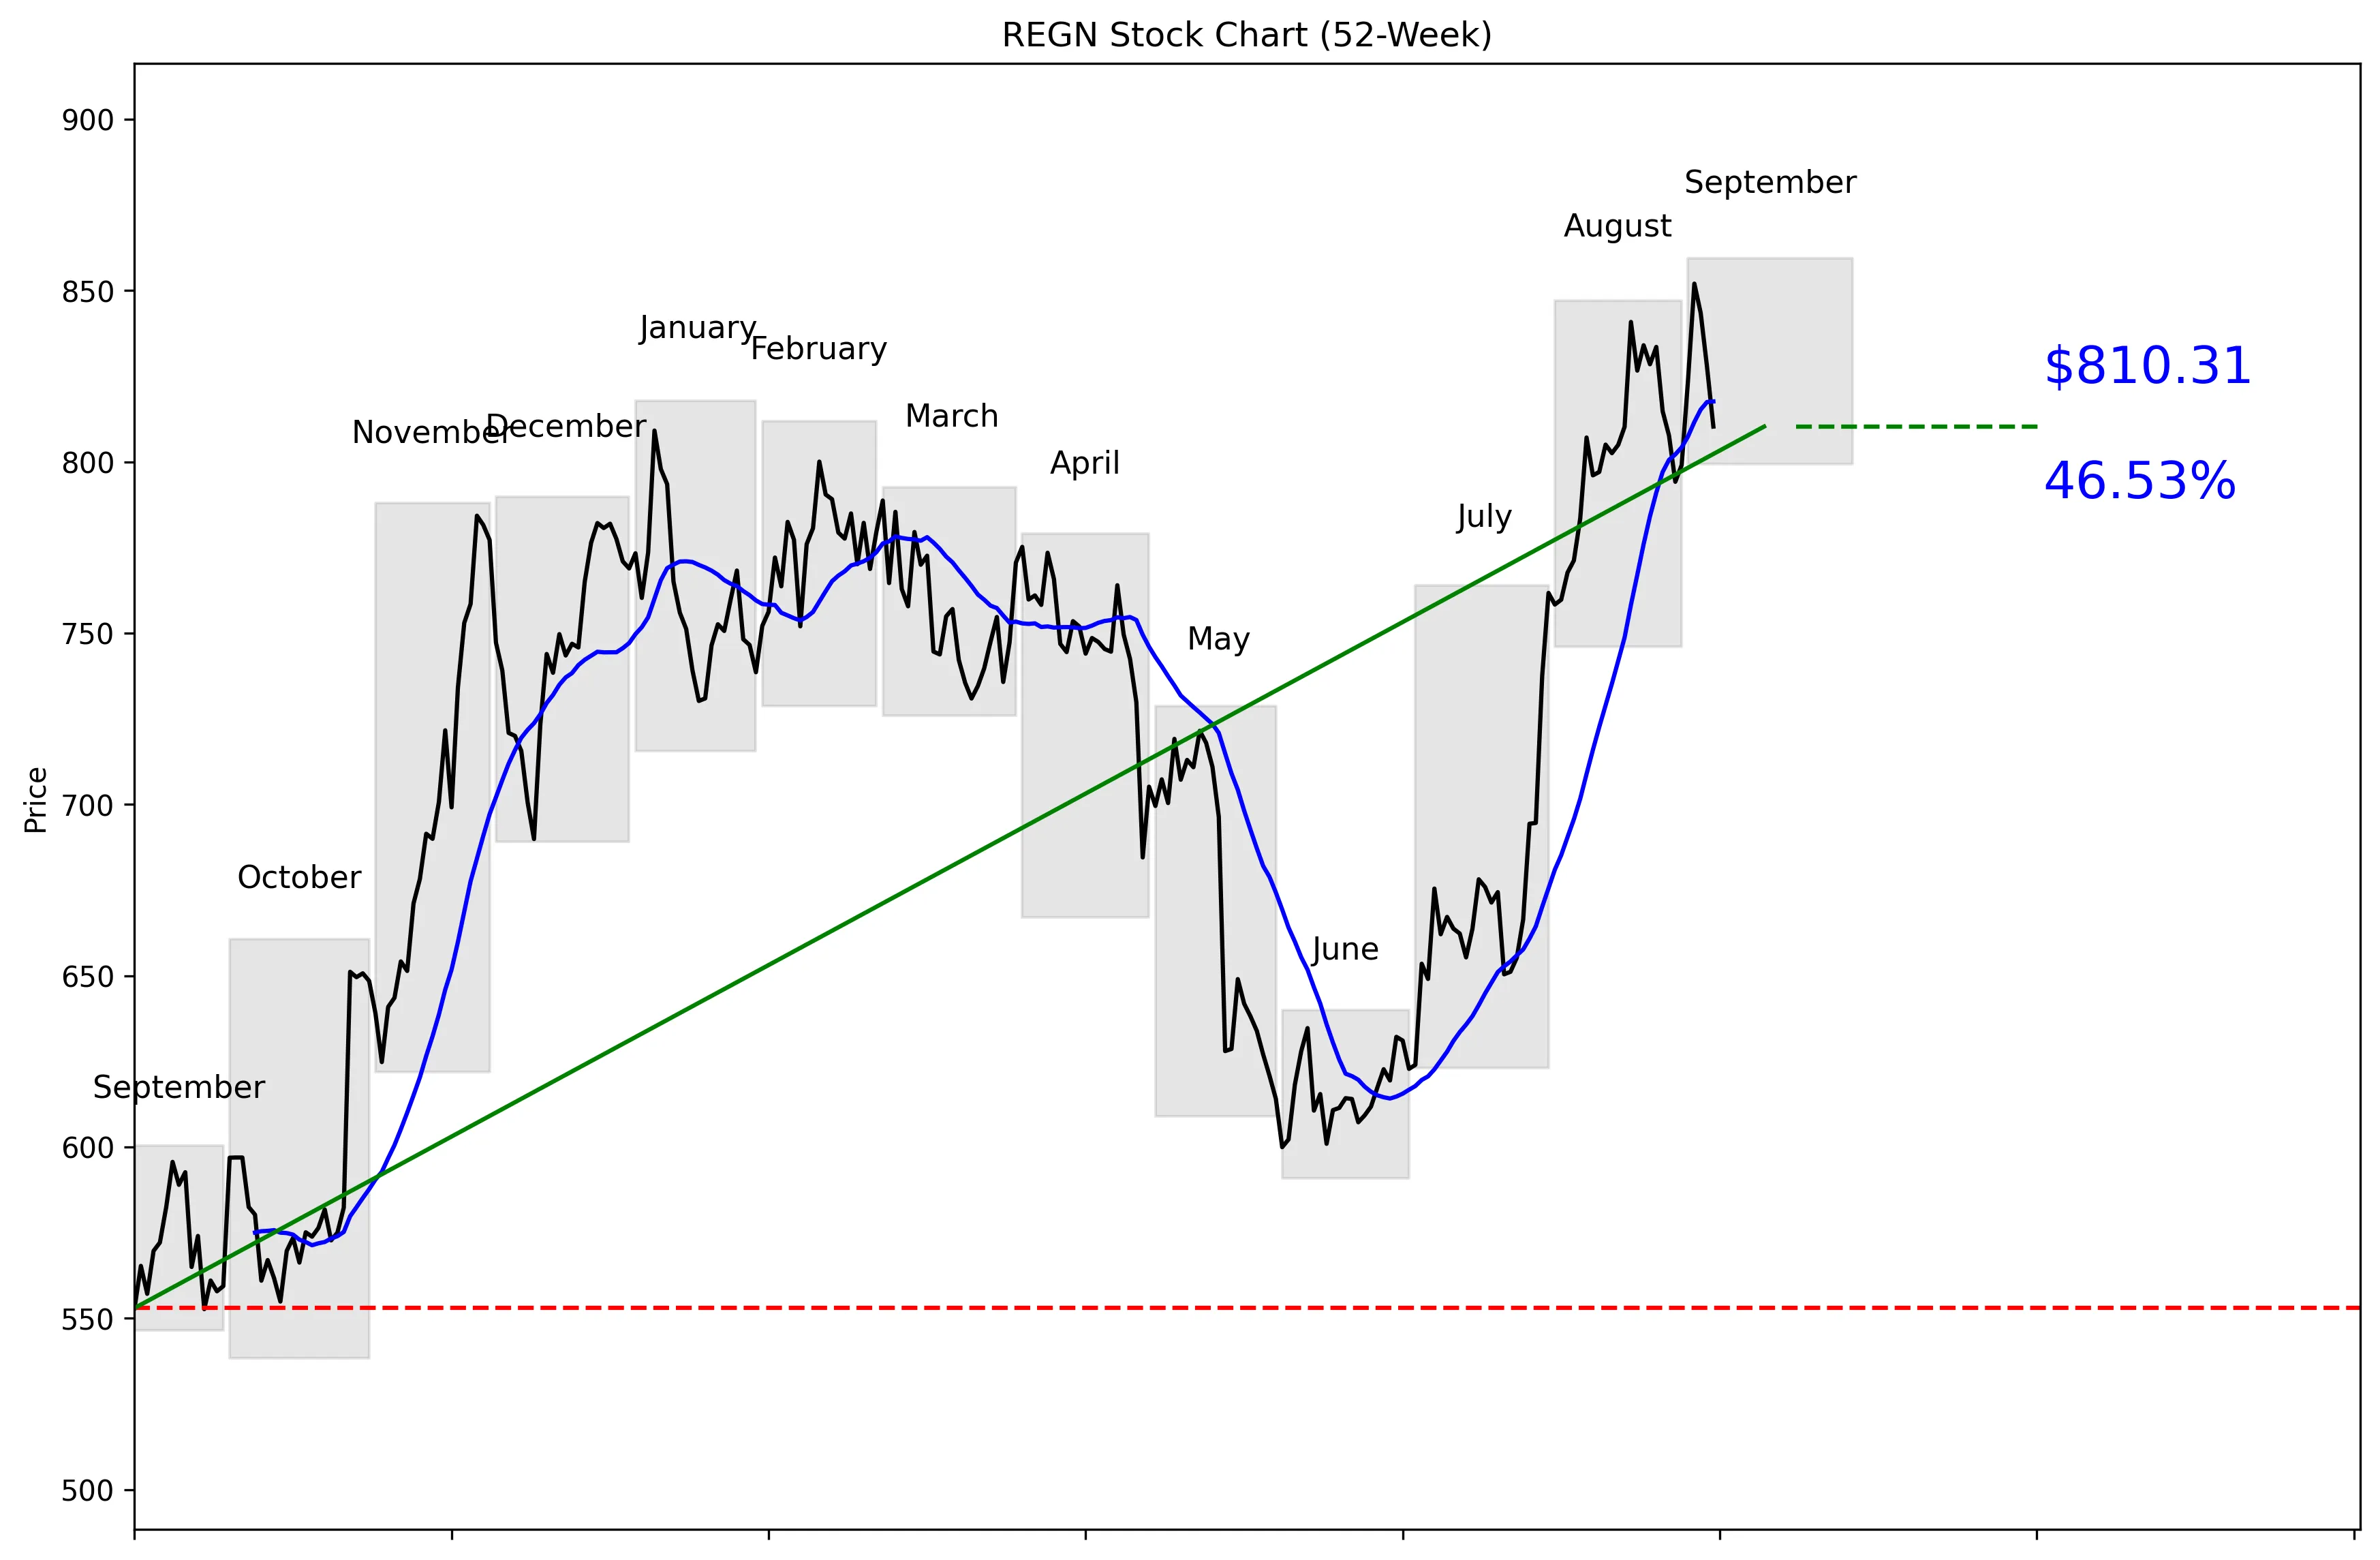
REGN 52-Week Stock Chart
Technical Analysis
REGN trades at $805.56, placing it 85% of the way from its $538.24 52-week low to its $859.34 high. The stock is 5.71% below that high and 50.55% above the low, so the broader trend remains strong. Near-term momentum is positive at 1.41% over five trading days and 0.40% over 20 days. Price is 0.90% below its 20-day moving average of $817.63, showing that the latest move has not fully regained short-term trend strength. Near-term support sits at $694.37, while resistance is $852.03.


Recent News and Developments

REGN hits a new 52-week high

Regeneron shares rose 3.2% intraday on September 2, reaching $849.93 after closing at $823.82. The rally confirms strong momentum, but the stock has since pulled back from that high. Source: MarketBeat

Cemiplimab and SNS-101 trial reaches completion

A Phase 1/2 study testing SNS-101 alone and with Regeneron’s cemiplimab in advanced solid tumors is now listed as completed. The trial record was updated on August 31, but no final results or Phase 2 plans were posted, so this is a pipeline milestone rather than evidence of efficacy. Source: TipRanks

Wall Street maintains a Moderate Buy consensus

Twenty-four analysts covering Regeneron currently break down to 14 Buy ratings and 10 Holds. Their average 12-month target is $800.36, below the stock’s reported Friday opening price of $827.72. Source: MarketBeat


Market Sentiment and Analyst Recommendations

Bull Case
Regeneron combines 16.7% revenue growth with $15.53 billion in revenue, which is a strong fundamental base. The company has $7.99 billion in cash against $2.71 billion in debt, leaving it with $5.28 billion more cash than debt. REGN trades at 19.92 times earnings, a reasonable valuation for a profitable company growing revenue at a double-digit rate. The $844.87 analyst target is $39.31 above the current $805.56 price. The top analyst target of $1,030 points to a much stronger upside scenario, although the low target of $730 shows that conviction is not universal. The completed Phase 1/2 study of SNS-101 with Regeneron’s cemiplimab adds a pipeline milestone, but final results have not been posted. The bull case is straightforward: strong growth, a cash-heavy balance sheet, and a valuation that does not look excessive.
Bear Case
REGN is already 85% of the way through its 52-week range, so buyers are entering after a major advance from the $538.24 low. The stock is only 5.71% below its $859.34 high, limiting the margin for disappointment. Its $844.87 analyst target offers just $39.31 above the current price, while the $730 low target sits below it. A separate group of 24 analysts has an $800.36 average target, below both the current $805.56 price and the reported $827.72 Friday opening price. Price is also 0.90% below the $817.63 20-day moving average, showing some near-term hesitation after the recent rally. The SNS-101 and cemiplimab study is complete, but there are no final results or Phase 2 plans, so investors cannot treat completion as evidence of success. REGN remains attractive, but the current price leaves less room for weak clinical news or slower growth.
What to Watch
The first technical test is whether REGN can reclaim its $817.63 20-day moving average. A move through the $852.03 near-term resistance level would put the $859.34 52-week high back in focus. If the stock weakens, $694.37 is the stated near-term support level to monitor. Investors should watch whether revenue growth holds near the reported 16.7% rate. The completed SNS-101 and cemiplimab trial needs final results or a Phase 2 plan before it becomes a meaningful catalyst; the trial record was updated on August 31. Marion McCourt’s September 2 and September 3 sales totaled $2,002,458.09, but both occurred under a Rule 10b5-1 plan adopted February 17, making follow-up activity more relevant than these scheduled transactions alone. The next quarter should clarify whether REGN can break above resistance or whether the limited upside to the $844.87 analyst target becomes the dominant concern.
Analyst Consensus
BUY

Based on 27 analyst opinions
Low Target
$730.00
Mean Target
$844.87
High Target
$1030.00


Earnings and Financial Data

Sector
Healthcare
Industry
Biotechnology
Employees
15,410
Earnings & Dividends
Next Earnings
Oct 28, 2026
EPS (Trailing)
$40.43
Dividend Yield
46.0%
Payout Ratio
9.0%

Frequently Asked Questions

Is REGN a good stock to buy?
The stated recommendation is buy based on 27 analysts, while revenue is growing 16.7%. The clear takeaway is that the fundamentals support buying, but the stock is already near the top of its 52-week range.
What is REGN’s price target?
The analyst target is $844.87, with estimates ranging from $730 to $1,030. The clear takeaway is that the average target sits above the current $805.56 price, but analyst outcomes vary widely.
Is REGN stock overvalued?
REGN trades at a P/E ratio of 19.92 and has reported revenue growth of 16.7%. The clear takeaway is that the supplied data does not show an extreme valuation, though the stock’s position near its 52-week high reduces the margin for error.
What are REGN’s support and resistance levels?
Near-term support is $694.37, based on the 30-day low, and near-term resistance is $852.03, based on the 30-day high. The clear takeaway is that $852.03 is the immediate breakout level, while $694.37 is the key downside threshold.
How strong is REGN’s balance sheet?
Regeneron has $7.99 billion in cash and $2.71 billion in debt. The clear takeaway is that cash exceeds debt by $5.28 billion, giving the company a strong net cash position.

Related Stock Reports

Disclaimer: This report is for informational purposes only and does not constitute financial advice. The analysis and opinions expressed are those of AltStation.io and should not be relied upon as the sole basis for investment decisions. Always conduct your own research and consult with a qualified financial advisor before making investment decisions. Past performance does not guarantee future results. Updated September 19, 2026.