ALTSTATION.IO

Bio-Techne Corporation (TECH) Stock Analysis

By Nova Skye | AltStation.io | Updated October 17, 2026

Price
$72.50
Change
-0.03%
Market Cap
$11.37B
Avg Volume
3.0M

Company Overview

Bio-Techne Corporation is a Minneapolis-based biotechnology company in the healthcare sector that sells essential lab tools, reagents, and instruments. Incorporated in 1976 and rebranded from Techne Corporation in November 2014, the business operates through two main divisions: Protein Sciences and Diagnostics and Spatial Biology. They produce specialized biological reagents like cytokines, growth factors, and antibodies, alongside automated protein analysis tools and clinical diagnostic kits. Their customer base spans academic researchers, clinical laboratories, and biopharma companies developing cell and gene therapies worldwide.

Bio-Techne is a specialized market leader in protein research tools and spatial biology rather than a generic hardware supplier. Their primary moat lies in proprietary consumable reagents, which build sticky, recurring revenue once labs embed them into standard testing protocols. Heavyweight rivals like Thermo Fisher Scientific, Danaher, and Bio-Rad Laboratories bring massive distribution networks, but Bio-Techne defends its turf with high-precision catalog depth. The main operational threat remains aggressive bundling from these larger diversified peers.

Right now, Bio-Techne is navigating a plateau in top-line demand while keeping profitability intact. Annual net sales finished at approximately $1.22 billion, essentially flat year-over-year, though quarterly sales reached $321.2 million on 3% organic growth. Net income rebounded to $181.86 million, producing diluted earnings per share of $1.16. Stagnant top-line growth is a drag in the short term, but strong margins and core spatial genomics assets give them a solid defensive floor.

Key Financials
Market Cap
$11.37B
Revenue
$1.22B
EBITDA
$334.11M
Gross Margin
66.2%
Profit Margin
15.0%
Revenue Growth
1.3%
Total Cash
$265.48M
Total Debt
$289.09M
Free Cash Flow
$229.65M


52-Week Price Performance Analysis

Price Statistics
P/E Ratio
62.50
Forward P/E
31.35
Beta
1.29
52-Week High
$72.69
52-Week Low
$43.20
EPS
$1.16
50-Day Avg
$72.37
200-Day Avg
$62.67
Price/Book
5.37
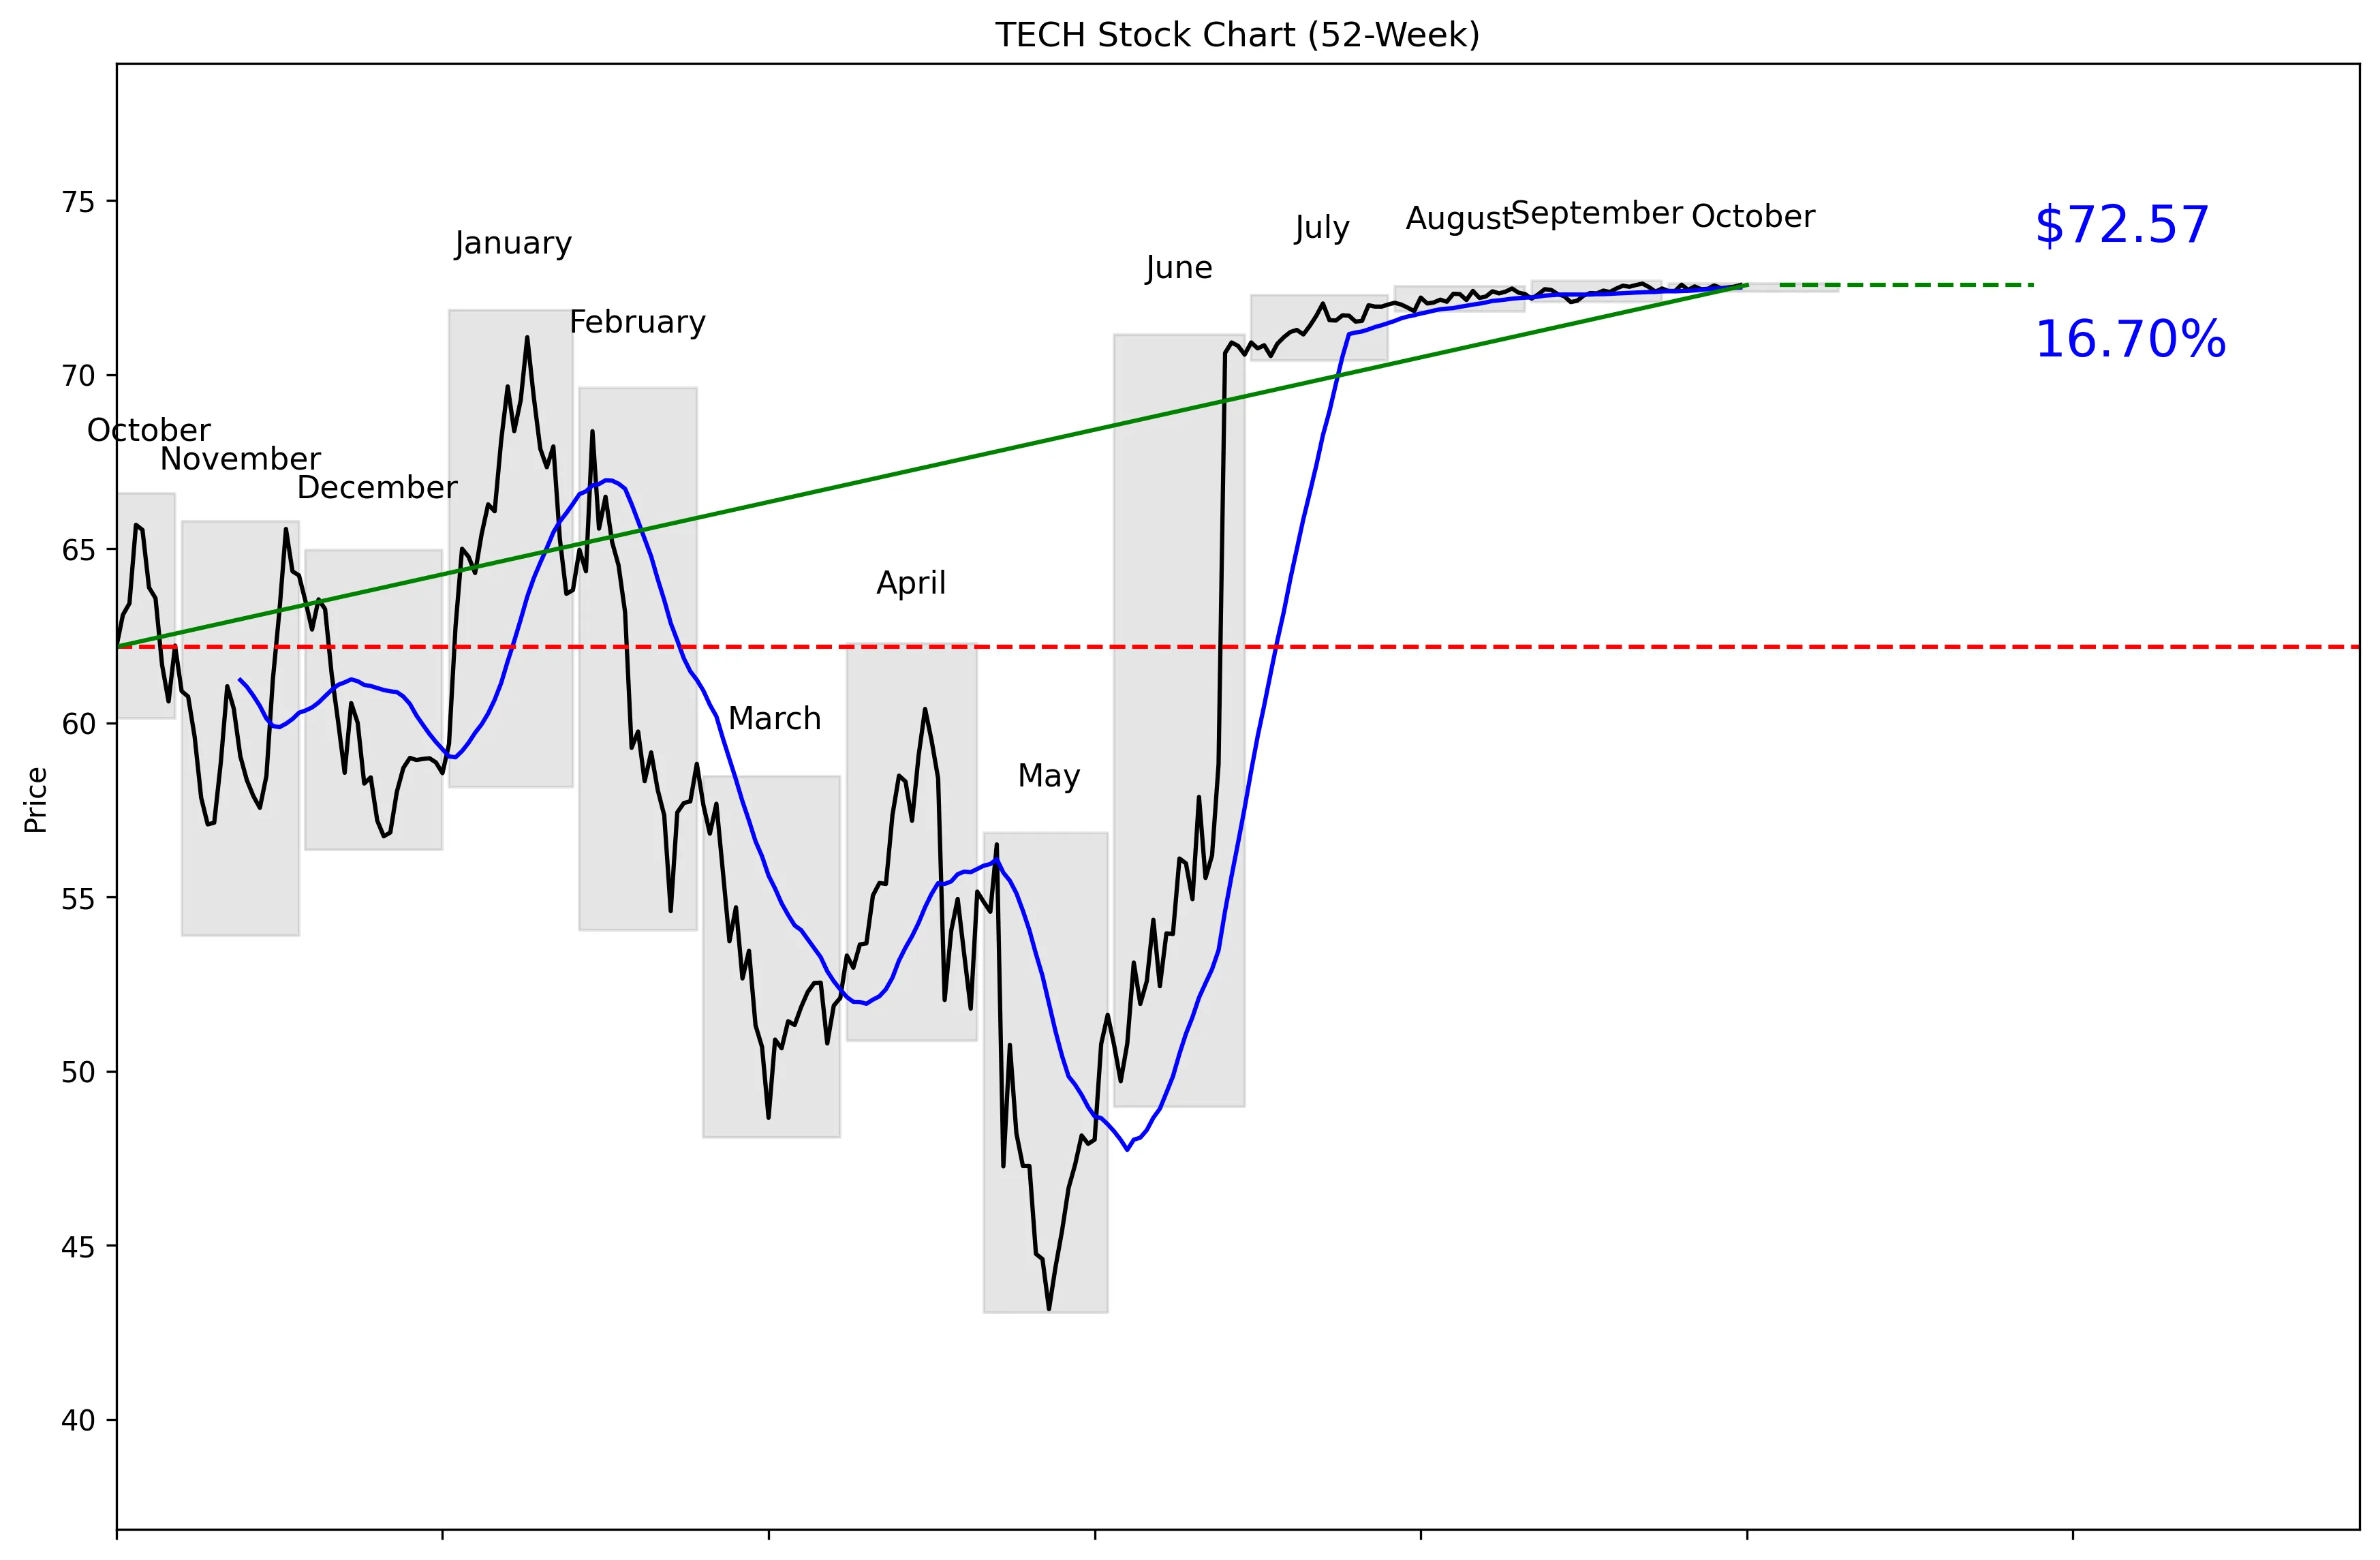
TECH 52-Week Stock Chart
Technical Analysis
TECH trades at $72.50, just $0.19 below its $72.69 52-week high and 68.48% above its $43.07 52-week low. The stock sits 100% of the way through its 52-week range and is only 0.17% off the high. Price is 0.10% above its 20-day moving average of $72.50, showing a tight, nearly flat short-term trend. Momentum is positive but weak at 0.15% over five trading days and 0.28% over 20 trading days. Near-term support is $72.08, while resistance is $72.61.


Recent News and Developments

No notable company-specific news this week

No Bio-Techne earnings, analyst actions, product launches, regulatory developments, or other company-specific announcements were found from October 10 through October 17, 2026. The latest company release was dated October 8, outside the requested one-week window.

Latest Developments

Check back for the latest news and updates.

Latest Developments

Check back for the latest news and updates.


Market Sentiment and Analyst Recommendations

Bull Case
TECH has climbed 68.48% from its 52-week low and now trades near its yearly high. The stock remains above its 20-day moving average, with positive five-day and 20-day momentum. Revenue is $1.22 billion, supported by 1.3% revenue growth. The company also holds $265.48 million in cash, giving it meaningful financial flexibility. The highest analyst target is $73.00, slightly above the current $72.50 price. A buyer here is betting that the strong price trend continues and revenue growth improves enough to justify the premium valuation.
Bear Case
The valuation is the main problem: TECH trades at 62.50 times earnings despite revenue growth of only 1.3%. The $70.50 consensus analyst target is below the current $72.50 share price. Even the highest target of $73.00 offers little room above the current price, while the low target is $50.00. Total debt of $289.09 million exceeds total cash of $265.48 million. The stock is already 100% of the way through its 52-week range, leaving little technical room before the $72.69 high. With momentum at just 0.15% over five days and 0.28% over 20 days, the recent price action does not show strong acceleration.
What to Watch
The first test is whether TECH can break above the $72.61 near-term resistance level and then clear the $72.69 52-week high. A move below $72.08 would break near-term support. Investors should also track whether the stock stays above its $72.50 20-day moving average. Revenue growth needs to improve from 1.3% to support a P/E ratio of 62.50. Cash of $265.48 million and debt of $289.09 million should be monitored for any widening imbalance. No company-specific announcements were found from October 10 through October 17, 2026, so the next earnings release, analyst action, product launch, or regulatory development could become the next catalyst, but no date was provided.
Analyst Consensus
HOLD

Based on 10 analyst opinions
Low Target
$50.00
Mean Target
$70.50
High Target
$73.00


Earnings and Financial Data

Sector
Healthcare
Industry
Biotechnology
Employees
3,000
Earnings & Dividends
Next Earnings
Nov 09, 2026
EPS (Trailing)
$1.16
Dividend Yield
44.0%
Payout Ratio
27.6%

Frequently Asked Questions

Is TECH a good stock to buy?
TECH has strong price positioning, trading at $72.50 and only 0.17% below its 52-week high. Its 62.50 P/E and 1.3% revenue growth make the current valuation difficult to justify, so the clear takeaway is that TECH looks more like a hold than a fresh buy.
What is TECH’s analyst price target?
The consensus analyst target is $70.50, with estimates ranging from $50.00 to $73.00. Since TECH trades at $72.50, the clear takeaway is that analysts see limited upside at the current price.
What is TECH’s 52-week trading range?
The stated 52-week range is $43.20 to $72.69, while the technical price series shows a low of $43.07 and a high of $72.69. At $72.50, the clear takeaway is that TECH is trading near the top of its annual range.
Is TECH stock showing positive momentum?
TECH gained 0.15% over the last five trading days and 0.28% over the last 20 trading days. The clear takeaway is that momentum is positive but modest.
Does TECH pay a dividend?
The provided data does not include dividend information, so no dividend claim can be made. The clear takeaway is that investors should verify TECH’s current dividend status separately.

Related Stock Reports

Disclaimer: This report is for informational purposes only and does not constitute financial advice. The analysis and opinions expressed are those of AltStation.io and should not be relied upon as the sole basis for investment decisions. Always conduct your own research and consult with a qualified financial advisor before making investment decisions. Past performance does not guarantee future results. Updated October 17, 2026.