ALTSTATION.IO

SBA Communications Corporation (SBAC) Stock Analysis

By Nova Skye | AltStation.io | Updated October 19, 2026

Price
$182.41
Change
-2.48%
Market Cap
$19.35B
Avg Volume
996.1K

Company Overview

SBA Communications Corporation is a specialty real estate investment trust headquartered in Boca Raton, Florida. Established in 1989, the company operates in the Real Estate sector by owning, developing, and operating wireless communications infrastructure. Their primary business is site leasing, renting out antenna space on cell towers, rooftops, and other structures directly to wireless service providers. They also generate revenue by managing rooftop and tower locations for third-party property owners under contractual arrangements.

SBA is a dominant independent tower operator built on a multi-tenant colocation model. The operating leverage is the real edge here, since stacking additional antennas onto existing towers costs very little while generating high-margin recurring rent. As of December 31, 2025, SBA averaged 1.8 tenants per tower, which leaves plenty of capacity to lease out. The trade-off is customer concentration risk, as the business is tightly tied to the spending budgets and network expansion cycles of major wireless carriers.

Right now, SBA is sitting on a mature, heavy asset footprint rather than executing risky pivots. As of December 31, 2025, the company owned 46,328 towers, a substantial portion of which were built in-house or purchased from other operators to support multiple carriers. The strategy is straightforward: squeeze more revenue out of those 46,328 sites by pushing tenancy higher. With an established physical footprint, their focus is translating steady carrier lease renewals into predictable cash flow.

Key Financials
Market Cap
$19.35B
Revenue
$2.87B
EBITDA
$1.83B
Gross Margin
74.2%
Profit Margin
34.5%
Revenue Growth
2.3%
Total Cash
$327.05M
Total Debt
$15.21B
Free Cash Flow
$752.06M


52-Week Price Performance Analysis

Price Statistics
P/E Ratio
19.68
Forward P/E
22.49
Beta
0.99
52-Week High
$224.46
52-Week Low
$156.60
EPS
$9.27
50-Day Avg
$179.42
200-Day Avg
$190.53
Price/Book
-4.18
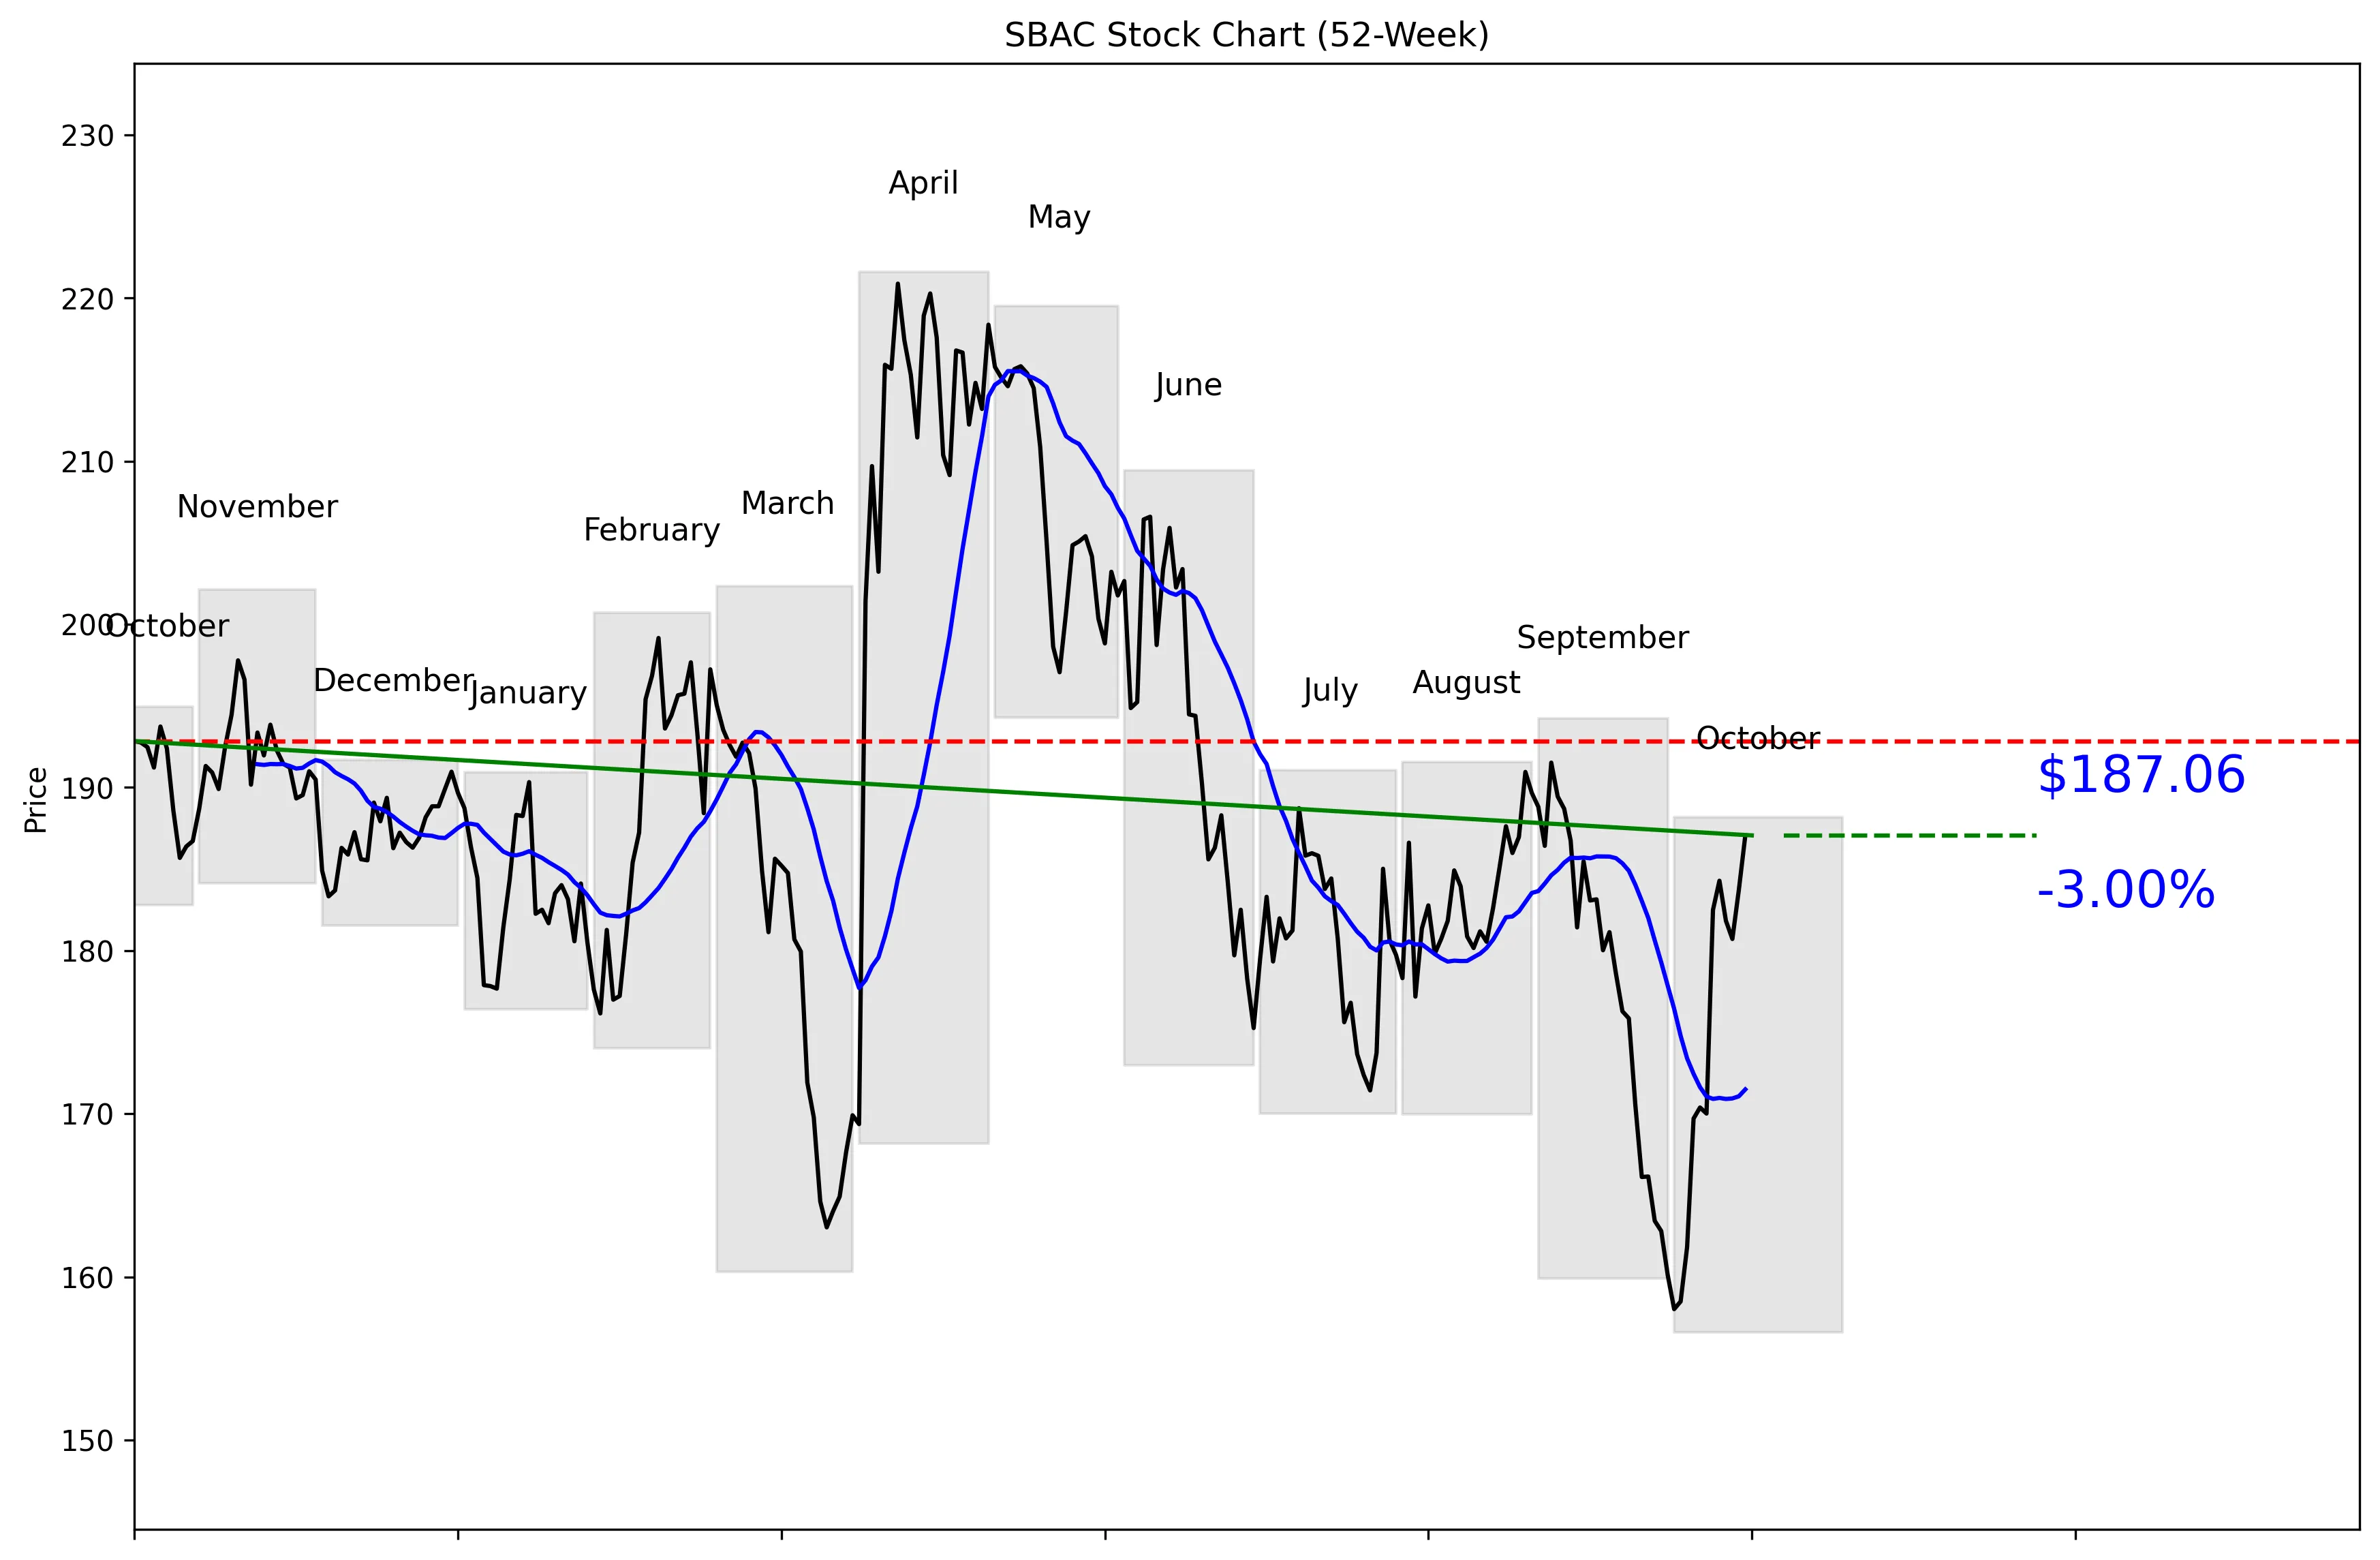
SBAC 52-Week Stock Chart
Technical Analysis
SBAC trades at $182.41, 15.58% below its $221.58 52-week high and 19.45% above its $156.60 low. The stock sits 47% of the way from the low to the high, placing it near the middle of its 52-week range. Price is 9.08% above the 20-day moving average of $171.49. Momentum is positive, with gains of 2.50% over five trading days and 4.74% over 20 trading days. Near-term support is $158.02, while resistance sits at $189.44.


Recent News and Developments

Jefferies upgrades SBAC to Hold

Jefferies Financial Group upgraded SBA Communications to Hold on October 16. The stock opened that day at $183.72, with a 52-week range of $156.60 to $224.46. Source: Ticker Report

Wells Fargo maintains Buy rating and $205 target

Wells Fargo analyst Eric Luebchow maintained a Buy rating on SBAC with a $205 price target. The analyst consensus target was $221.62, implying 20.3% upside from the cited $183.72 closing price. Source: Fooshya

Analysts expect a double-digit FFO decline

Analysts expect third-quarter diluted FFO of $2.92, down 11.5% from $3.30 a year earlier. SBAC has beaten Wall Street’s FFO estimate in each of the past four quarters, but the expected decline makes the November report a real test. Source: Barchart via Yahoo Finance


Market Sentiment and Analyst Recommendations

Bull Case
SBAC has positive momentum and currently trades 9.08% above its 20-day moving average. The stock has gained 4.74% over 20 trading days, showing buyers are taking control near term. The consensus recommendation is buy based on 20 analysts, with a $225.80 target compared with the current $182.41 price. Wells Fargo maintained a Buy rating and set a $205 target. SBAC has also beaten Wall Street’s FFO estimate in each of the past four quarters. The strongest speculative catalyst is a potential SpaceX network build involving 30,000 to 120,000 macro sites, although SpaceX has not committed to leasing SBA sites.
Bear Case
SBAC carries $15.21 billion in total debt against just $327.05 million in cash. That balance-sheet gap leaves little room for operational disappointment. Revenue growth is only 2.3%, which is not especially strong for a stock trading at 19.68 times earnings. Analysts expect third-quarter diluted FFO to fall 11.5%, from $3.30 to $2.92. Jefferies upgraded the stock only to Hold, while Bernstein kept a Market-Perform rating despite setting a $219 target. The stock is also approaching near-term resistance at $189.44, so weak earnings could quickly challenge the $171.49 moving average or the $158.02 support level.
What to Watch
The main event is the third-quarter 2026 earnings release after the market closes on November 2. Investors should compare diluted FFO with the expected $2.92 and the prior-year figure of $3.30. Another earnings beat would extend SBAC’s four-quarter streak, while a miss would weaken the bull case. Watch whether the stock can break above its $189.44 30-day high or falls back below the $171.49 moving average. The $158.02 30-day low is the key downside threshold if momentum reverses. Investors should also watch for evidence that SpaceX will lease tower sites, because the current 30,000-to-120,000-site scenario is still only a potential catalyst.
Analyst Consensus
BUY

Based on 20 analyst opinions
Low Target
$164.00
Mean Target
$225.80
High Target
$280.00


Earnings and Financial Data

Sector
Real Estate
Industry
REIT – Specialty
Employees
1,844
Earnings & Dividends
Next Earnings
Nov 02, 2026
EPS (Trailing)
$9.27
Dividend Yield
267.0%
Payout Ratio
50.9%

Frequently Asked Questions

Is SBAC a good stock to buy?
The consensus recommendation is buy based on 20 analysts, and the stock is 9.08% above its 20-day moving average. The clear takeaway is that analyst sentiment and near-term momentum are positive.
What is SBAC’s price target?
The analyst target is $225.80, with estimates ranging from $164.00 to $280.00. The clear takeaway is that analyst expectations vary widely.
What is SBAC’s 52-week range?
The supplied key-data range is $156.60 to $224.46, while the price-series technical high is $221.58 and the technical low is $156.60. The clear takeaway is that the current $182.41 price remains well below both reported high figures.
What are SBAC’s support and resistance levels?
Near-term support is the 30-day low of $158.02, and near-term resistance is the 30-day high of $189.44. The clear takeaway is that these are the main technical levels to monitor.
How much debt does SBA Communications have?
SBA Communications has $15.21 billion in total debt and $327.05 million in total cash. The clear takeaway is that debt substantially exceeds available cash.

Related Stock Reports

Disclaimer: This report is for informational purposes only and does not constitute financial advice. The analysis and opinions expressed are those of AltStation.io and should not be relied upon as the sole basis for investment decisions. Always conduct your own research and consult with a qualified financial advisor before making investment decisions. Past performance does not guarantee future results. Updated October 19, 2026.