ALTSTATION.IO

State Street Corporation (STT) Stock Analysis

By Nova Skye | AltStation.io | Updated October 07, 2026

Price
$173.17
Change
-1.47%
Market Cap
$47.57B
Avg Volume
1.9M

Company Overview

State Street Corporation is a Boston-based financial services powerhouse founded in 1792 that operates at the core of global asset management. The firm handles essential back-office operations for institutions, selling custody, fund administration, trade execution, and investment strategies. Its client base consists exclusively of heavyweights like mutual funds, public retirement plans, insurance companies, foundations, and wealth managers. In simple terms, when massive institutions need someone to safe-keep assets, settle trades, or run ETF mandates, State Street gets the call.

State Street is an entrenched market leader in global custody alongside direct rivals like BNY, JPMorgan Chase, and Northern Trust. Its primary competitive moat is massive scale, which creates sticky institutional relationships and painful switching costs for clients. The real threat is relentless fee compression across commoditized custody and fund administration, which squeezes baseline servicing revenue. To stay ahead, the firm relies on proprietary data analytics and specialized securities financing that competitors cannot easily undercut.

Right now, the company is expanding beyond basic custody into an integrated technology and data provider. As of year-end 2024, State Street oversaw 46.6 trillion dollars in assets under custody and administration alongside 4.7 trillion dollars in assets under management. Its primary growth engine is the State Street Alpha platform, which integrates portfolio management, risk analytics, and trade settlement into a unified workflow. This front-to-back software strategy locks in institutional clients and turns commoditized recordkeeping into higher-margin recurring fee revenue.

Key Financials
Market Cap
$47.57B
Revenue
$15.02B
EBITDA
N/A
Gross Margin
0.0%
Profit Margin
23.0%
Revenue Growth
18.4%
Total Cash
$168.21B
Total Debt
$57.44B
Free Cash Flow
N/A


52-Week Price Performance Analysis

Price Statistics
P/E Ratio
15.27
Forward P/E
11.23
Beta
1.42
52-Week High
$195.93
52-Week Low
$104.64
EPS
$11.34
50-Day Avg
$185.83
200-Day Avg
$155.41
Price/Book
1.99
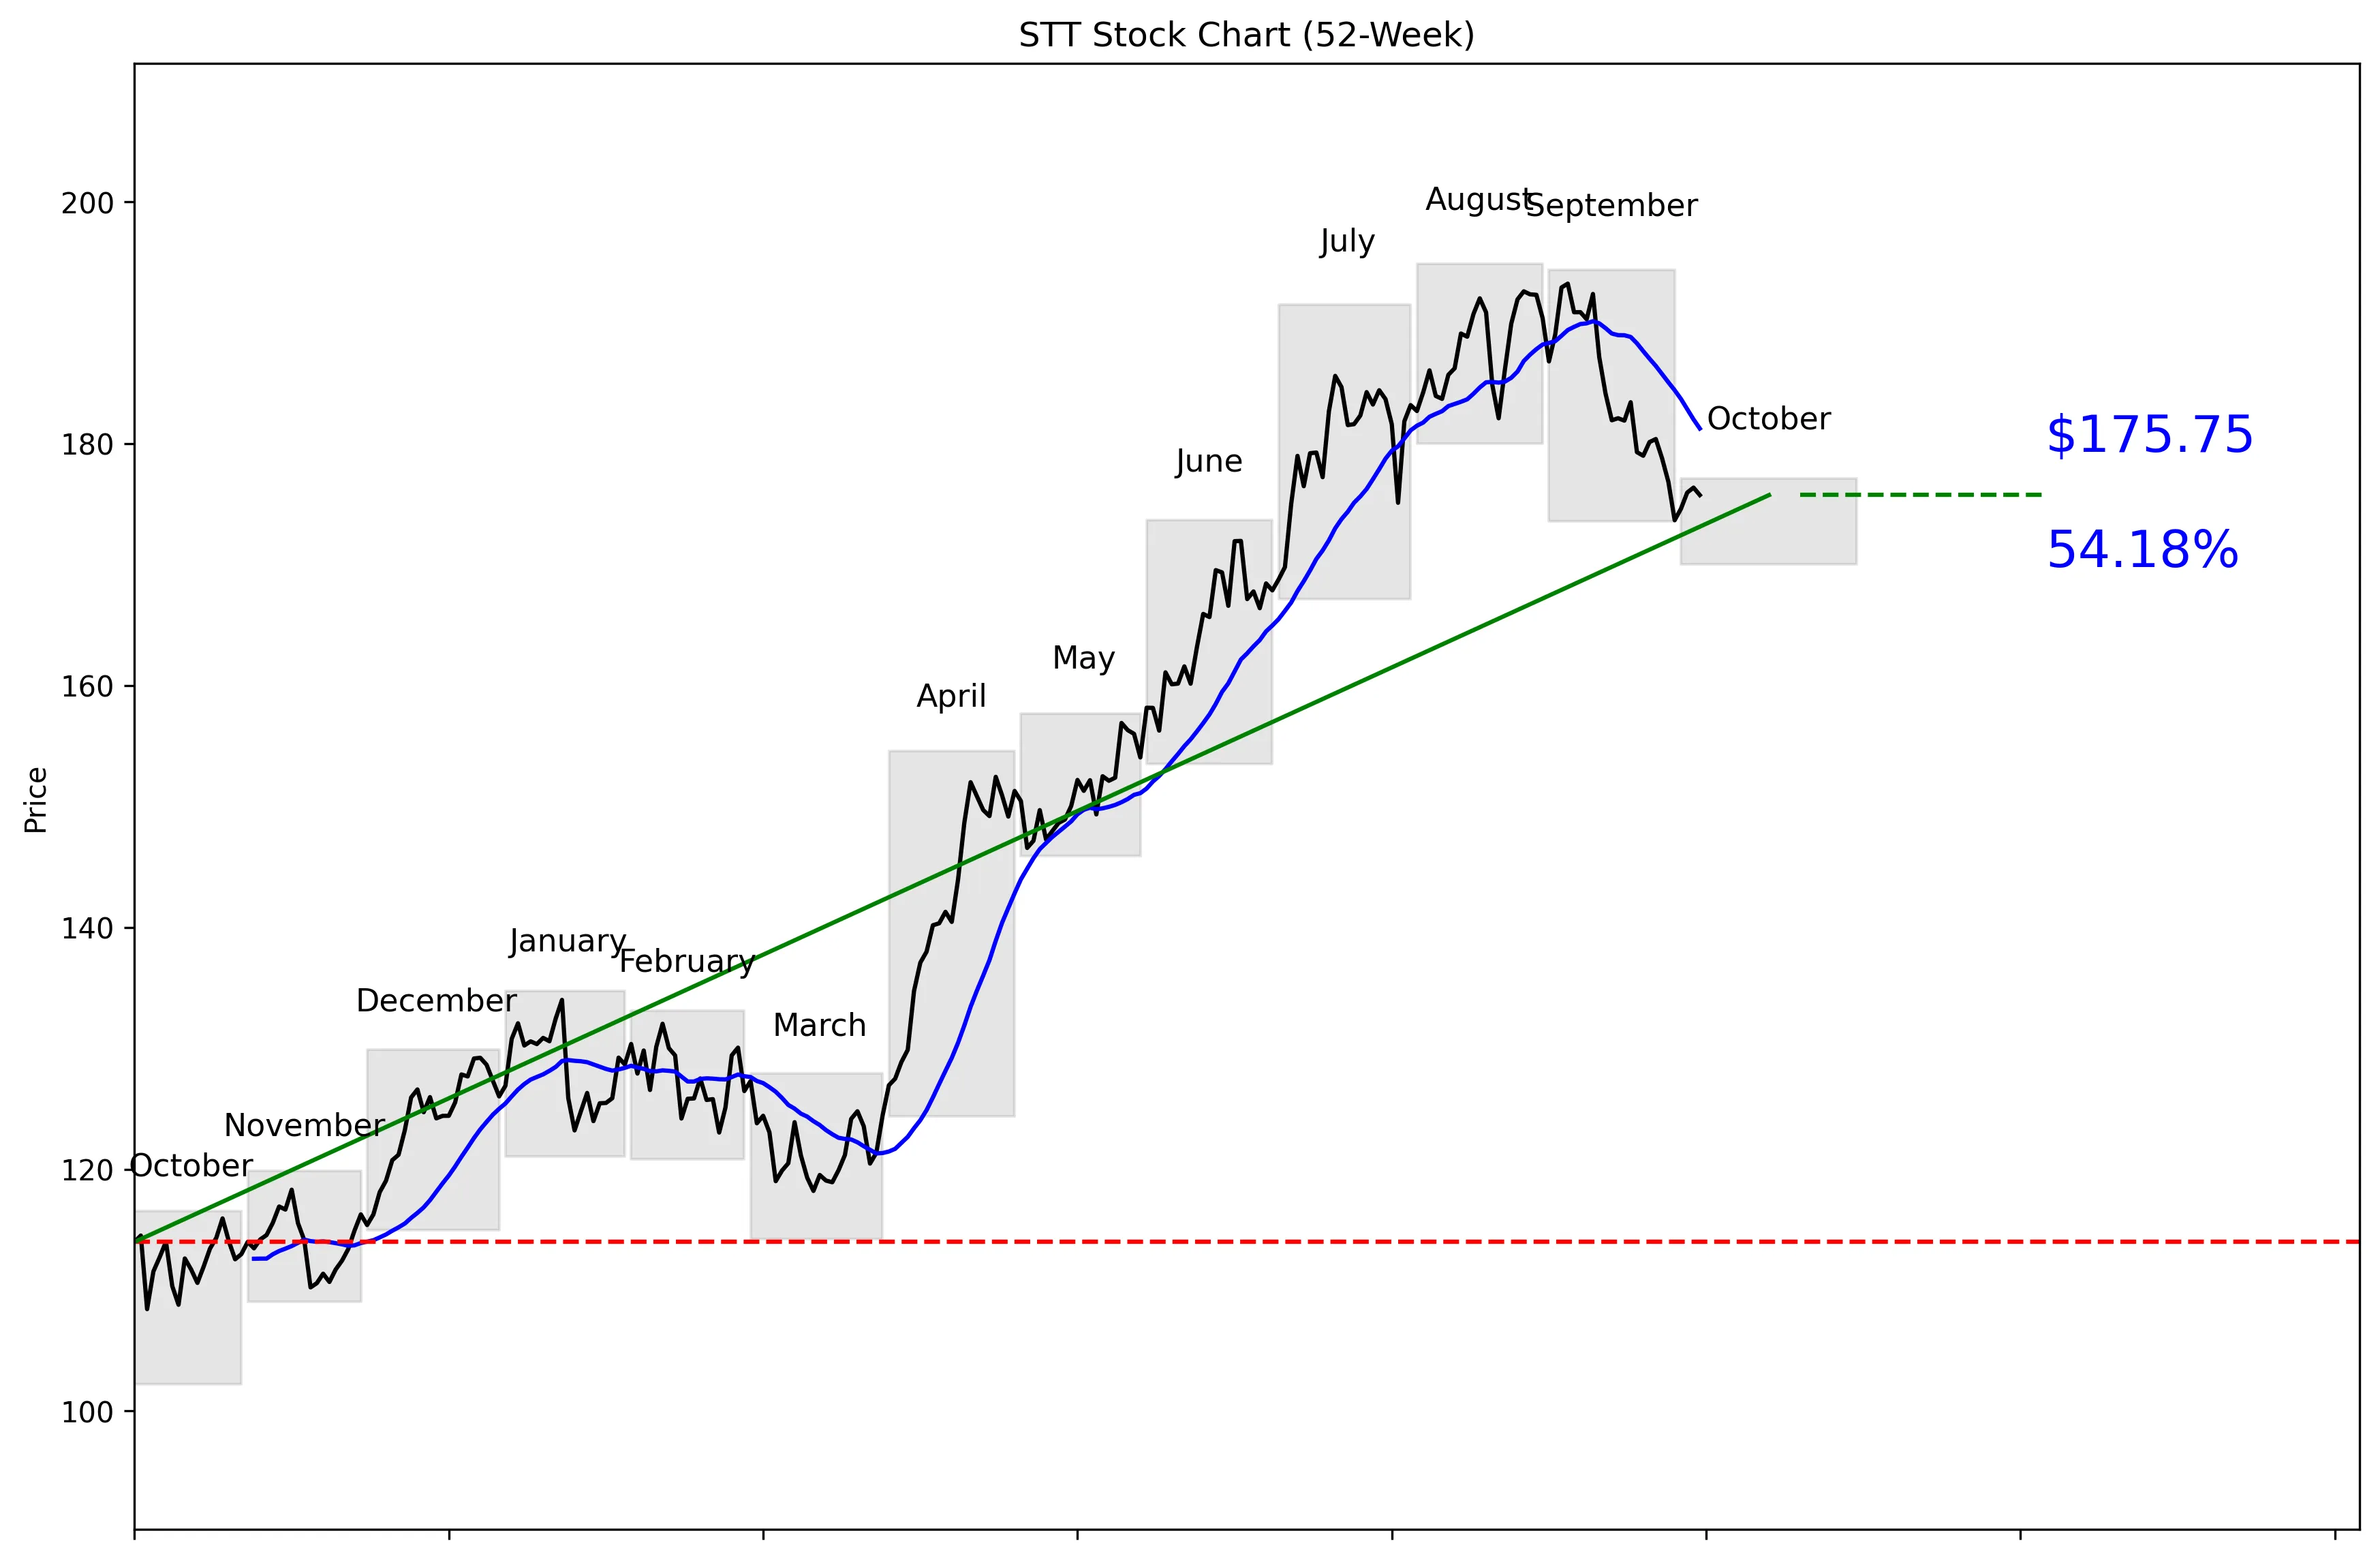
STT 52-Week Stock Chart
Technical Analysis
STT trades at $173.17, placing it 79% of the way from its $102.22 52-week low to its $194.90 high. The stock remains 9.82% below that high but 71.94% above the low. Price is 3.04% below the 20-day moving average of $181.25. Momentum is negative, with a 0.62% decline over five trading days and a 7.92% decline over 20 trading days. STT is already below the stated near-term support of $173.67, while resistance sits at $193.24.


Recent News and Developments

BMO and Truist trim State Street targets

BMO Capital lowered its STT price target from $212 to $200 while keeping an Outperform rating. Truist cut its target from $191 to $190 and maintained a Hold rating. Source: Benzinga

Citi raises State Street target to $212

Citi raised its STT price target from $210 to $212 and maintained a Buy rating. The adjustment came as part of the firm’s third-quarter earnings preview. Source: TipRanks

JPMorgan nudges State Street target higher

JPMorgan increased its STT price target from $187 to $187.50 on October 2. The firm kept its Neutral rating, so this is a minor estimate revision rather than a stronger call on the stock. Source: MarketBeat


Market Sentiment and Analyst Recommendations

Bull Case
Revenue is $15.02 billion, with growth running at 18.4%. That is the strongest reason to own STT here. The stock trades at 15.27 times earnings, which is reasonable if that growth holds. The $198.25 analyst target implies 14.48% upside from $173.17, while the highest target of $215 implies 24.16% upside. Analysts currently rate STT a buy based on 14 opinions. State Street also reports that 63% of institutional investors already manage digital assets or have provider relationships ready, giving the company exposure to broader institutional adoption.
Bear Case
The technical picture is weak despite the strong 52-week advance. STT is below its $181.25 moving average, has lost 7.92% over 20 trading days and has slipped beneath the stated $173.67 near-term support. The stock is still 71.94% above its 52-week low, so investors buying now are not entering near the bottom of the range. Analyst conviction is mixed: BMO cut its target from $212 to $200, Truist reduced its target from $191 to $190 and JPMorgan remains Neutral at $187.50. The analyst range runs from $150 to $215, showing substantial disagreement about fair value. Total debt of $57.44 billion is also meaningful, even with total cash of $168.21 billion.
What to Watch
The first technical test is whether STT can recover above $173.67 and then reclaim its $181.25 20-day moving average. A move through $193.24 would break the stated 30-day resistance and put the $194.90 52-week high back in focus. Continued trading below $173.67 would confirm that the recent 7.92% 20-day decline has not stabilized. Investors should watch whether revenue growth remains near 18.4%, because that growth supports the current 15.27 P/E. Analyst revisions are another key signal: Citi raised its target to $212, while BMO and Truist reduced theirs to $200 and $190. Digital-asset adoption could become a larger catalyst if State Street converts the reported 51% mainstream-adoption expectation and 63% institutional readiness into measurable business growth.
Analyst Consensus
BUY

Based on 14 analyst opinions
Low Target
$150.00
Mean Target
$198.25
High Target
$215.00


Earnings and Financial Data

Sector
Financial Services
Industry
Asset Management
Employees
50,596
Earnings & Dividends
Next Earnings
Oct 14, 2026
EPS (Trailing)
$11.34
Dividend Yield
209.0%
Payout Ratio
29.6%

Frequently Asked Questions

Is STT a good stock to buy?
The current recommendation is buy based on 14 analysts, and revenue growth is 18.4%. The takeaway is that the fundamental rating is positive, but the short-term price trend is weak.
What is STT’s price target?
The analyst target is $198.25, with estimates ranging from $150 to $215. The takeaway is that the consensus target sits above the current $173.17 price, but analyst outcomes vary widely.
Is STT stock overvalued?
STT trades at a P/E of 15.27 and sits 79% of the way from its $102.22 low to its $194.90 high. The takeaway is that the stock is near the upper portion of its 52-week range, although the supplied data does not establish that it is overvalued.
What are STT’s support and resistance levels?
Near-term support is $173.67, while near-term resistance is $193.24. The takeaway is that the current $173.17 price is already below the stated support level.
What is the momentum outlook for STT?
STT is down 0.62% over five trading days and 7.92% over 20 trading days, with the price 3.04% below its $181.25 moving average. The takeaway is that near-term momentum is bearish.

Related Stock Reports

Disclaimer: This report is for informational purposes only and does not constitute financial advice. The analysis and opinions expressed are those of AltStation.io and should not be relied upon as the sole basis for investment decisions. Always conduct your own research and consult with a qualified financial advisor before making investment decisions. Past performance does not guarantee future results. Updated October 07, 2026.