ALTSTATION.IO

Tyson Foods, Inc. (TSN) Stock Analysis

By Nova Skye | AltStation.io | Updated September 07, 2026

Price
$51.42
Change
-0.66%
Market Cap
$18.09B
Avg Volume
3.3M

Company Overview

Tyson Foods is a global protein producer operating in the Consumer Defensive sector under Farm Products. Founded in 1935 and headquartered in Springdale, Arkansas, the company divides its operations into 4 core segments: Beef, Pork, Chicken, and Prepared Foods. It processes live cattle and hogs, raises chickens, and manufactures packaged meats under 9 major retail brands, including Tyson, Jimmy Dean, Hillshire Farm, and Ball Park. Its buyer network spans grocery retailers, warehouse clubs, chain restaurants, industrial food processors, and military commissaries worldwide.

Tyson holds a dominant scale advantage as an established market leader across the multi-protein space. Its primary competitive edge is extensive vertical reach, controlling everything from poultry breeding stock to value-added cooked items and case-ready cuts. The main risk to the model is direct exposure to live livestock procurement cycles across cattle, hogs, and poultry. Owning recognized consumer labels like Wright, Aidells, and State Fair gives the company significant shelf-space leverage over pure commodity meat packers.

The company focuses its operational profile on balancing high-volume primal carcass fabrication with higher-margin prepared foods. Its product portfolio spans raw meat cuts, bacon, frozen appetizers, tortillas, and ready-to-eat sandwiches for domestic and export markets. Tyson relies on its 4 distinct operating segments to smooth out volatility in any single animal protein category. Broad distribution across institutional cafeterias, convenience stores, and wholesale grocers provides consistent baseline volume for its production facilities.

Key Financials
Market Cap
$18.09B
Revenue
$55.69B
EBITDA
$2.77B
Gross Margin
6.6%
Profit Margin
1.0%
Revenue Growth
-0.1%
Total Cash
$740.00M
Total Debt
$8.01B
Free Cash Flow
$1.19B


52-Week Price Performance Analysis

Price Statistics
P/E Ratio
31.74
Forward P/E
12.06
Beta
0.37
52-Week High
$69.48
52-Week Low
$50.56
EPS
$1.62
50-Day Avg
$57.60
200-Day Avg
$60.47
Price/Book
1.00
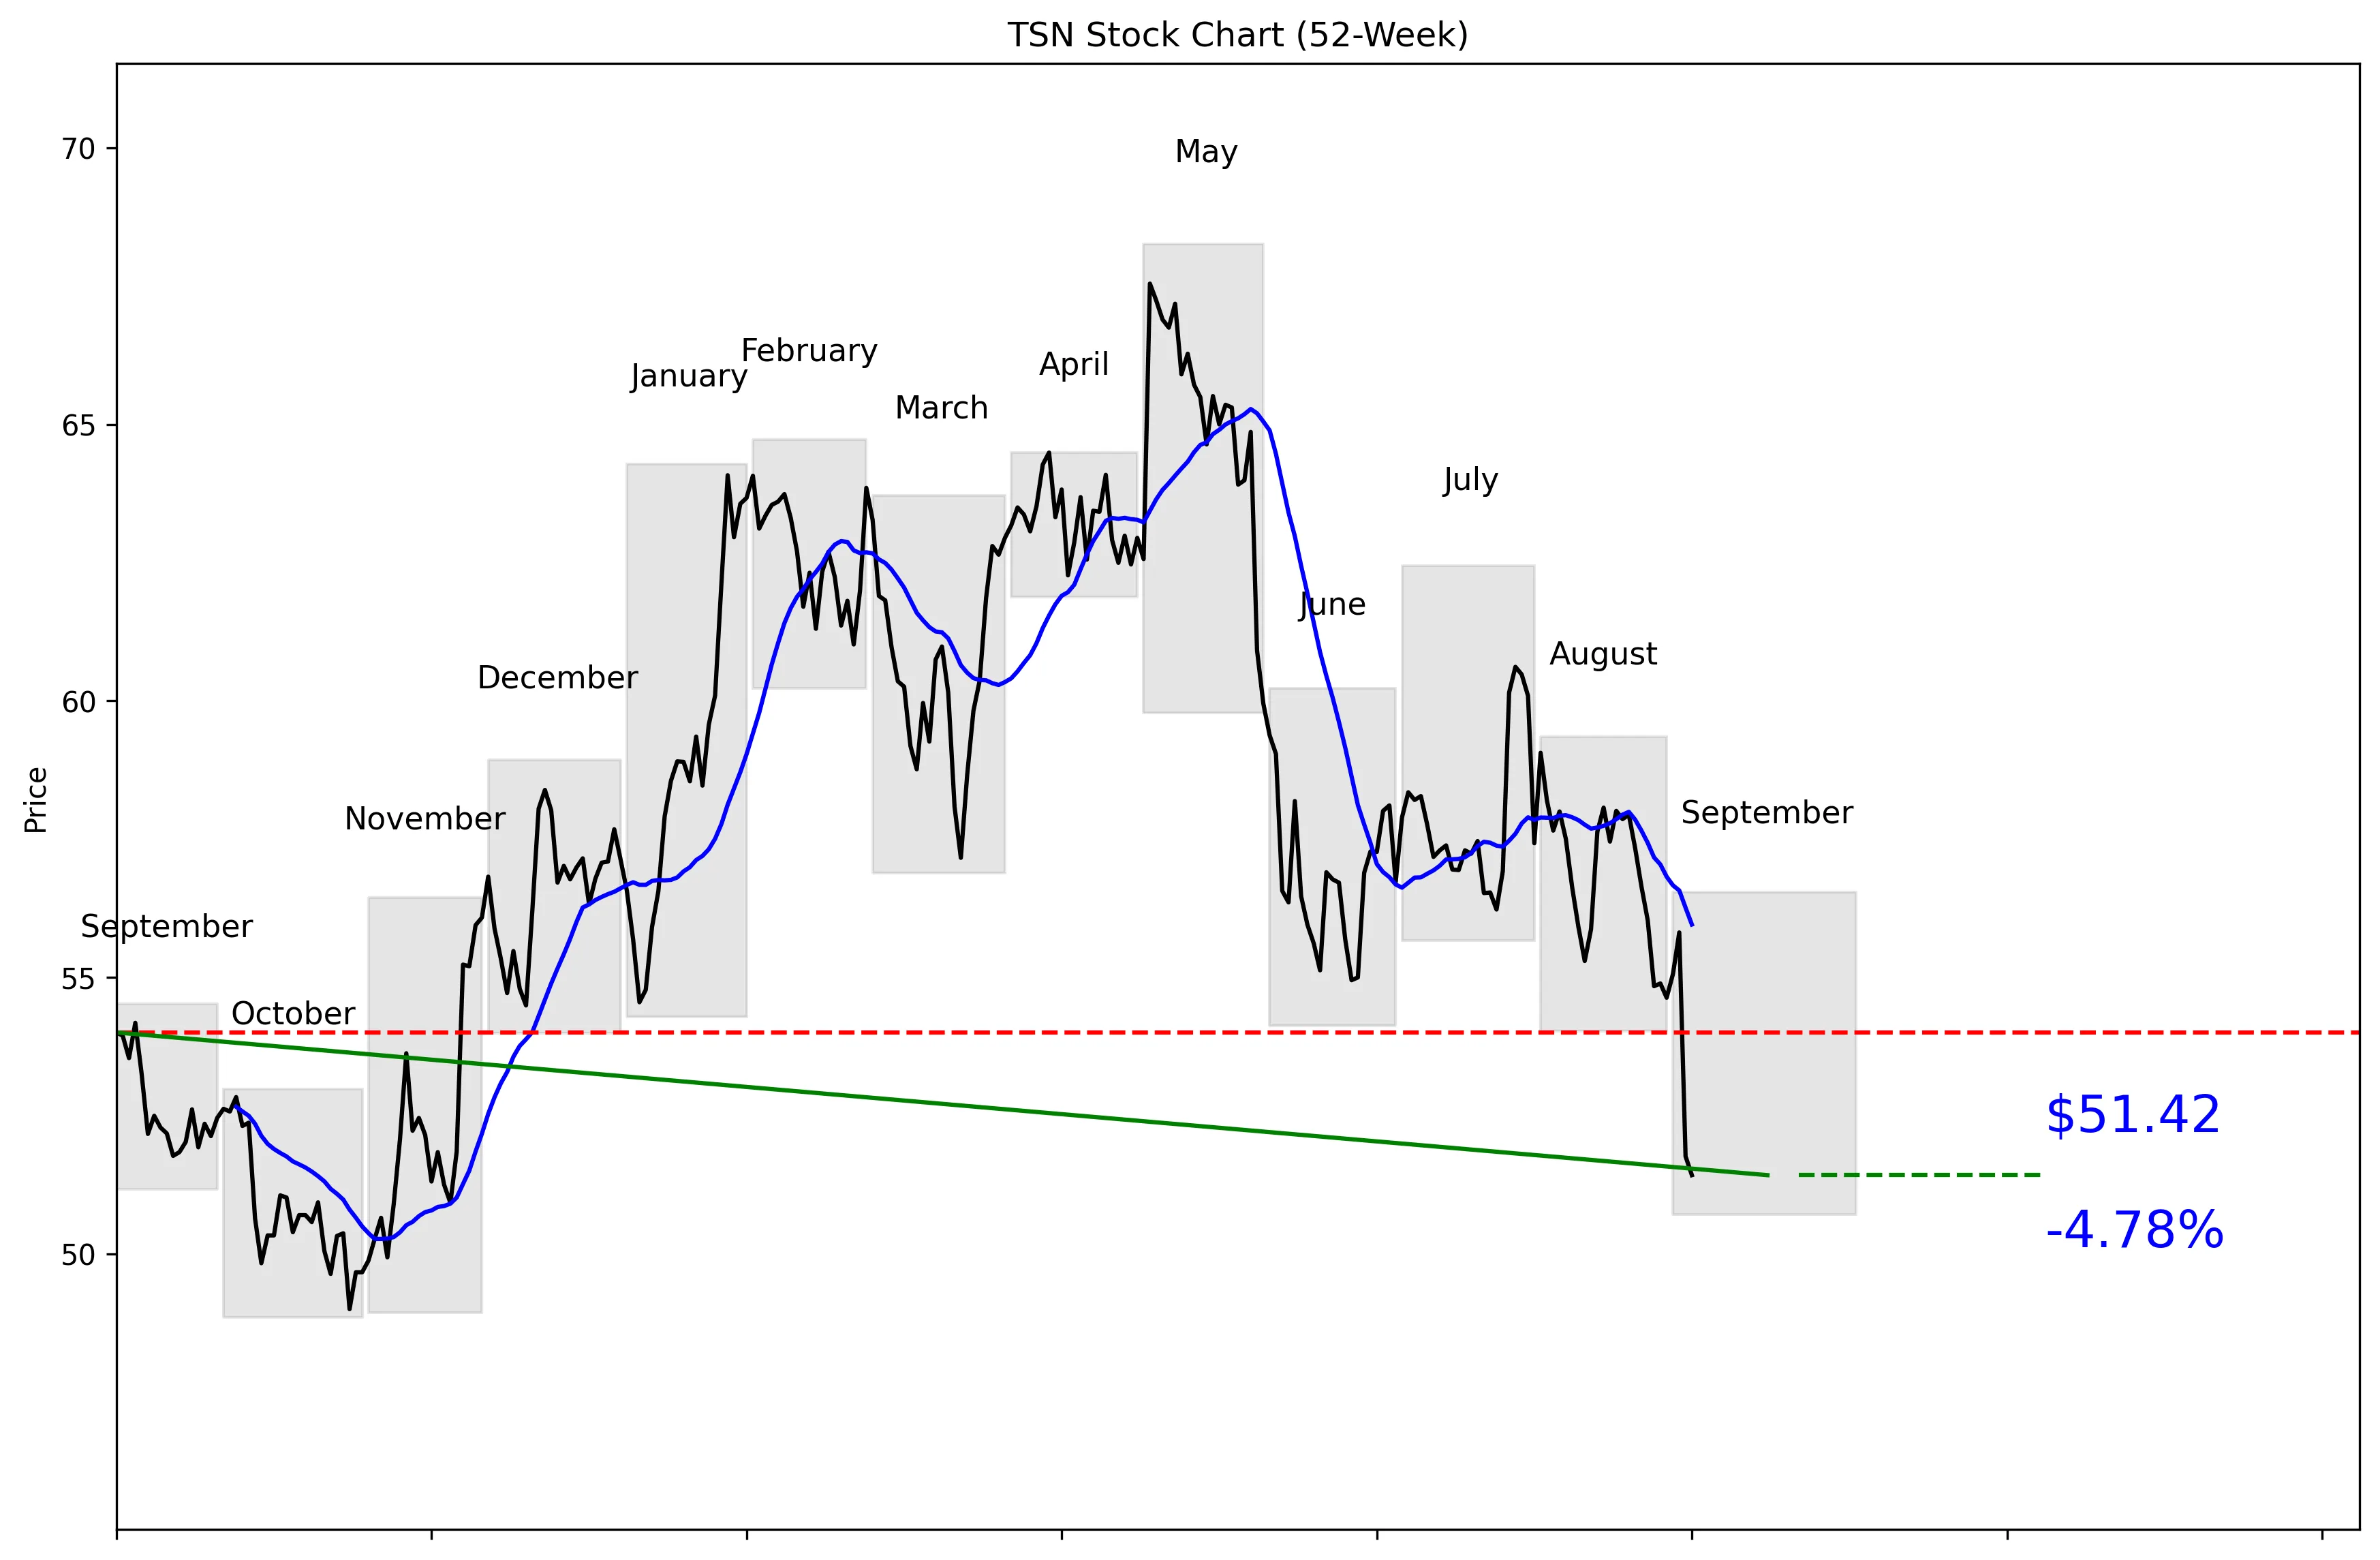
TSN 52-Week Stock Chart
Technical Analysis
TSN trades at $51.42, just 13% of the way from its $48.84 52-week low to its $68.26 high. The stock is 24.67% below that high and only 5.28% above the low, confirming a weak 52-week trend. Price sits 8.10% below the $55.95 20-day moving average, while five-day and 20-day momentum are negative 6.32% and 10.58%, respectively. Near-term support is $51.42, and resistance is $60.61.


Recent News and Developments

Tyson cuts fiscal 2026 outlook as beef losses deepen

Tyson now expects fiscal 2026 revenue growth of 1.5% to 2.0% and adjusted operating income of $1.85 billion to $2.05 billion. The company projects a $625 million to $775 million adjusted operating loss in Beef, while Chicken is expected to generate $1.85 billion to $1.95 billion. Source: Tyson Foods

TSN plunges 7.3% after guidance cut

Tyson shares fell 7.3% on September 3 after the company lowered its fiscal-year revenue and operating-income guidance. The drop came while the S&P 500 gained 1.1%, making Tyson a clear company-specific selloff. Source: Associated Press

BofA cuts Tyson target to $56

BofA analyst Peter Galbo lowered Tyson’s price target from $65 to $56 and kept a Neutral rating. The firm cited weaker chicken results and reduced earnings visibility after Tyson cut its fiscal 2026 profit guidance. Source: TipRanks/The Fly


Market Sentiment and Analyst Recommendations

Bull Case
Tyson still generates $55.69 billion in revenue against an $18.09 billion market cap. Management expects fiscal 2026 revenue growth of 1.5% to 2.0% and adjusted operating income of $1.85 billion to $2.05 billion. Chicken is the key earnings engine, with projected adjusted operating income of $1.85 billion to $1.95 billion. The $68.75 consensus analyst target sits well above the current $51.42 price, while individual targets range from $56.00 to $78.00. Even after cutting its target, BMO maintained an Outperform rating with a $65 target. The bull case is simple: TSN is priced near its lows, and stronger chicken performance or stabilization in beef could drive a meaningful rebound.
Bear Case
The stock trades at 31.74 times earnings despite revenue growth of negative 0.1%. Tyson carries $8.01 billion in total debt against only $740 million in cash, leaving little balance-sheet flexibility. The Beef segment is expected to lose between $625 million and $775 million on an adjusted operating basis in fiscal 2026. Management has already reduced its fiscal-year revenue and operating-income guidance, and the stock fell 7.3% on September 3 while the S&P 500 gained 1.1%. BofA cut its target from $65 to $56, citing weaker chicken results and reduced earnings visibility. At $51.42, TSN is cheap relative to analyst targets but not cheap on its 31.74 P/E, so another earnings disappointment could push it through support.
What to Watch
The first test is whether TSN can hold near-term support at $51.42 and avoid revisiting the $48.84 52-week low. Investors should track whether fiscal 2026 revenue growth remains within management’s revised 1.5% to 2.0% range. Adjusted operating income must stay within the projected $1.85 billion to $2.05 billion range to prevent another reset. Beef losses need to improve from the expected $625 million to $775 million range, while Chicken needs to deliver its projected $1.85 billion to $1.95 billion. Technically, reclaiming the $55.95 20-day moving average would be the first sign that selling pressure is easing, followed by a test of $60.61 resistance. No next earnings date was provided, so the next quarterly report and any guidance update are the events to monitor.
Analyst Consensus
HOLD

Based on 12 analyst opinions
Low Target
$56.00
Mean Target
$68.75
High Target
$78.00


Earnings and Financial Data

Sector
Consumer Defensive
Industry
Farm Products
Employees
133,000
Earnings & Dividends
Next Earnings
Nov 09, 2026
EPS (Trailing)
$1.62
Dividend Yield
397.0%
Payout Ratio
125.3%

Frequently Asked Questions

Is TSN a good stock to buy?
TSN trades at $51.42, just 13% of the way from its $48.84 52-week low to its $68.26 high. The analyst recommendation is hold based on 12 analysts, so the current data supports patience rather than an aggressive buy.
What is TSN’s price target?
The analyst target is $68.75, with estimates ranging from $56.00 to $78.00. The takeaway is that every listed target is above the current $51.42 price.
Is TSN stock undervalued?
TSN has an $18.09 billion market cap and $55.69 billion in revenue, but it trades at a P/E of 31.74 while revenue growth is negative 0.1%. The takeaway is that the stock looks depressed on price but not clearly cheap on earnings.
What are TSN’s support and resistance levels?
Near-term support is the 30-day low of $51.42, while near-term resistance is the 30-day high of $60.61. The takeaway is that TSN is currently sitting directly on support.
Does TSN pay a dividend?
The provided data does not include a dividend rate or yield. The takeaway is that no dividend conclusion can be made from the available figures.

Related Stock Reports

Disclaimer: This report is for informational purposes only and does not constitute financial advice. The analysis and opinions expressed are those of AltStation.io and should not be relied upon as the sole basis for investment decisions. Always conduct your own research and consult with a qualified financial advisor before making investment decisions. Past performance does not guarantee future results. Updated September 07, 2026.