ALTSTATION.IO

Archer-Daniels-Midland Company (ADM) Stock Analysis

By Nova Skye | AltStation.io | Updated October 10, 2026

Price
$83.83
Change
-1.82%
Market Cap
$40.40B
Avg Volume
3.7M

Company Overview

Founded in 1902 and headquartered in Chicago, Illinois, Archer-Daniels-Midland operates in the Consumer Defensive sector, specifically Farm Products. The company serves as the central plumbing of global agriculture, buying, storing, transporting, and processing crops across three segments: Ag Services and Oilseeds, Carbohydrate Solutions, and Nutrition. It transforms raw materials like soybeans, corn, and wheat into animal feed, vegetable oils, sweeteners, and specialty ingredients like plant proteins and flavors. Key buyers include packaged food manufacturers, livestock producers, and industrial energy customers worldwide.

ADM is an entrenched market leader, representing the “A” in the dominant ABCD group alongside Bunge, Cargill, and Louis Dreyfus. Its sprawling global logistics network of grain elevators, crushing mills, and port terminals creates a high barrier to entry that niche players cannot touch. Despite that scale, ADM is tethered to raw commodity cycles, where thin processing margins and shifting trade routes can quickly pressure profitability. Its Ag Services and Oilseeds segment alone generates over 70% of consolidated revenue, leaving the top line exposed whenever global grain pricing softens.

The company is currently contracting from peak post-pandemic highs, with 2024 annual revenue falling about 9% to $85.53 billion from $93.94 billion in 2023. Operating profit in its core Ag Services and Oilseeds unit tumbled 40% in 2024 to $2.45 billion as crop supply normalized and crush margins narrowed. Management is countering this drag by expanding higher-margin specialty nutrition solutions and investing in carbon capture and biofuel infrastructure. My view: ADM holds an irreplaceable infrastructure moat, but you are buying a cyclical business facing clear near-term margin pressure until global agricultural spreads turn back in its favor.

Key Financials
Market Cap
$40.40B
Revenue
$82.10B
EBITDA
$3.00B
Gross Margin
6.9%
Profit Margin
2.2%
Revenue Growth
7.2%
Total Cash
$1.09B
Total Debt
$9.34B
Free Cash Flow
$1.16B


52-Week Price Performance Analysis

Price Statistics
P/E Ratio
22.90
Forward P/E
14.73
Beta
0.61
52-Week High
$88.46
52-Week Low
$55.58
EPS
$3.66
50-Day Avg
$80.62
200-Day Avg
$71.86
Price/Book
1.71
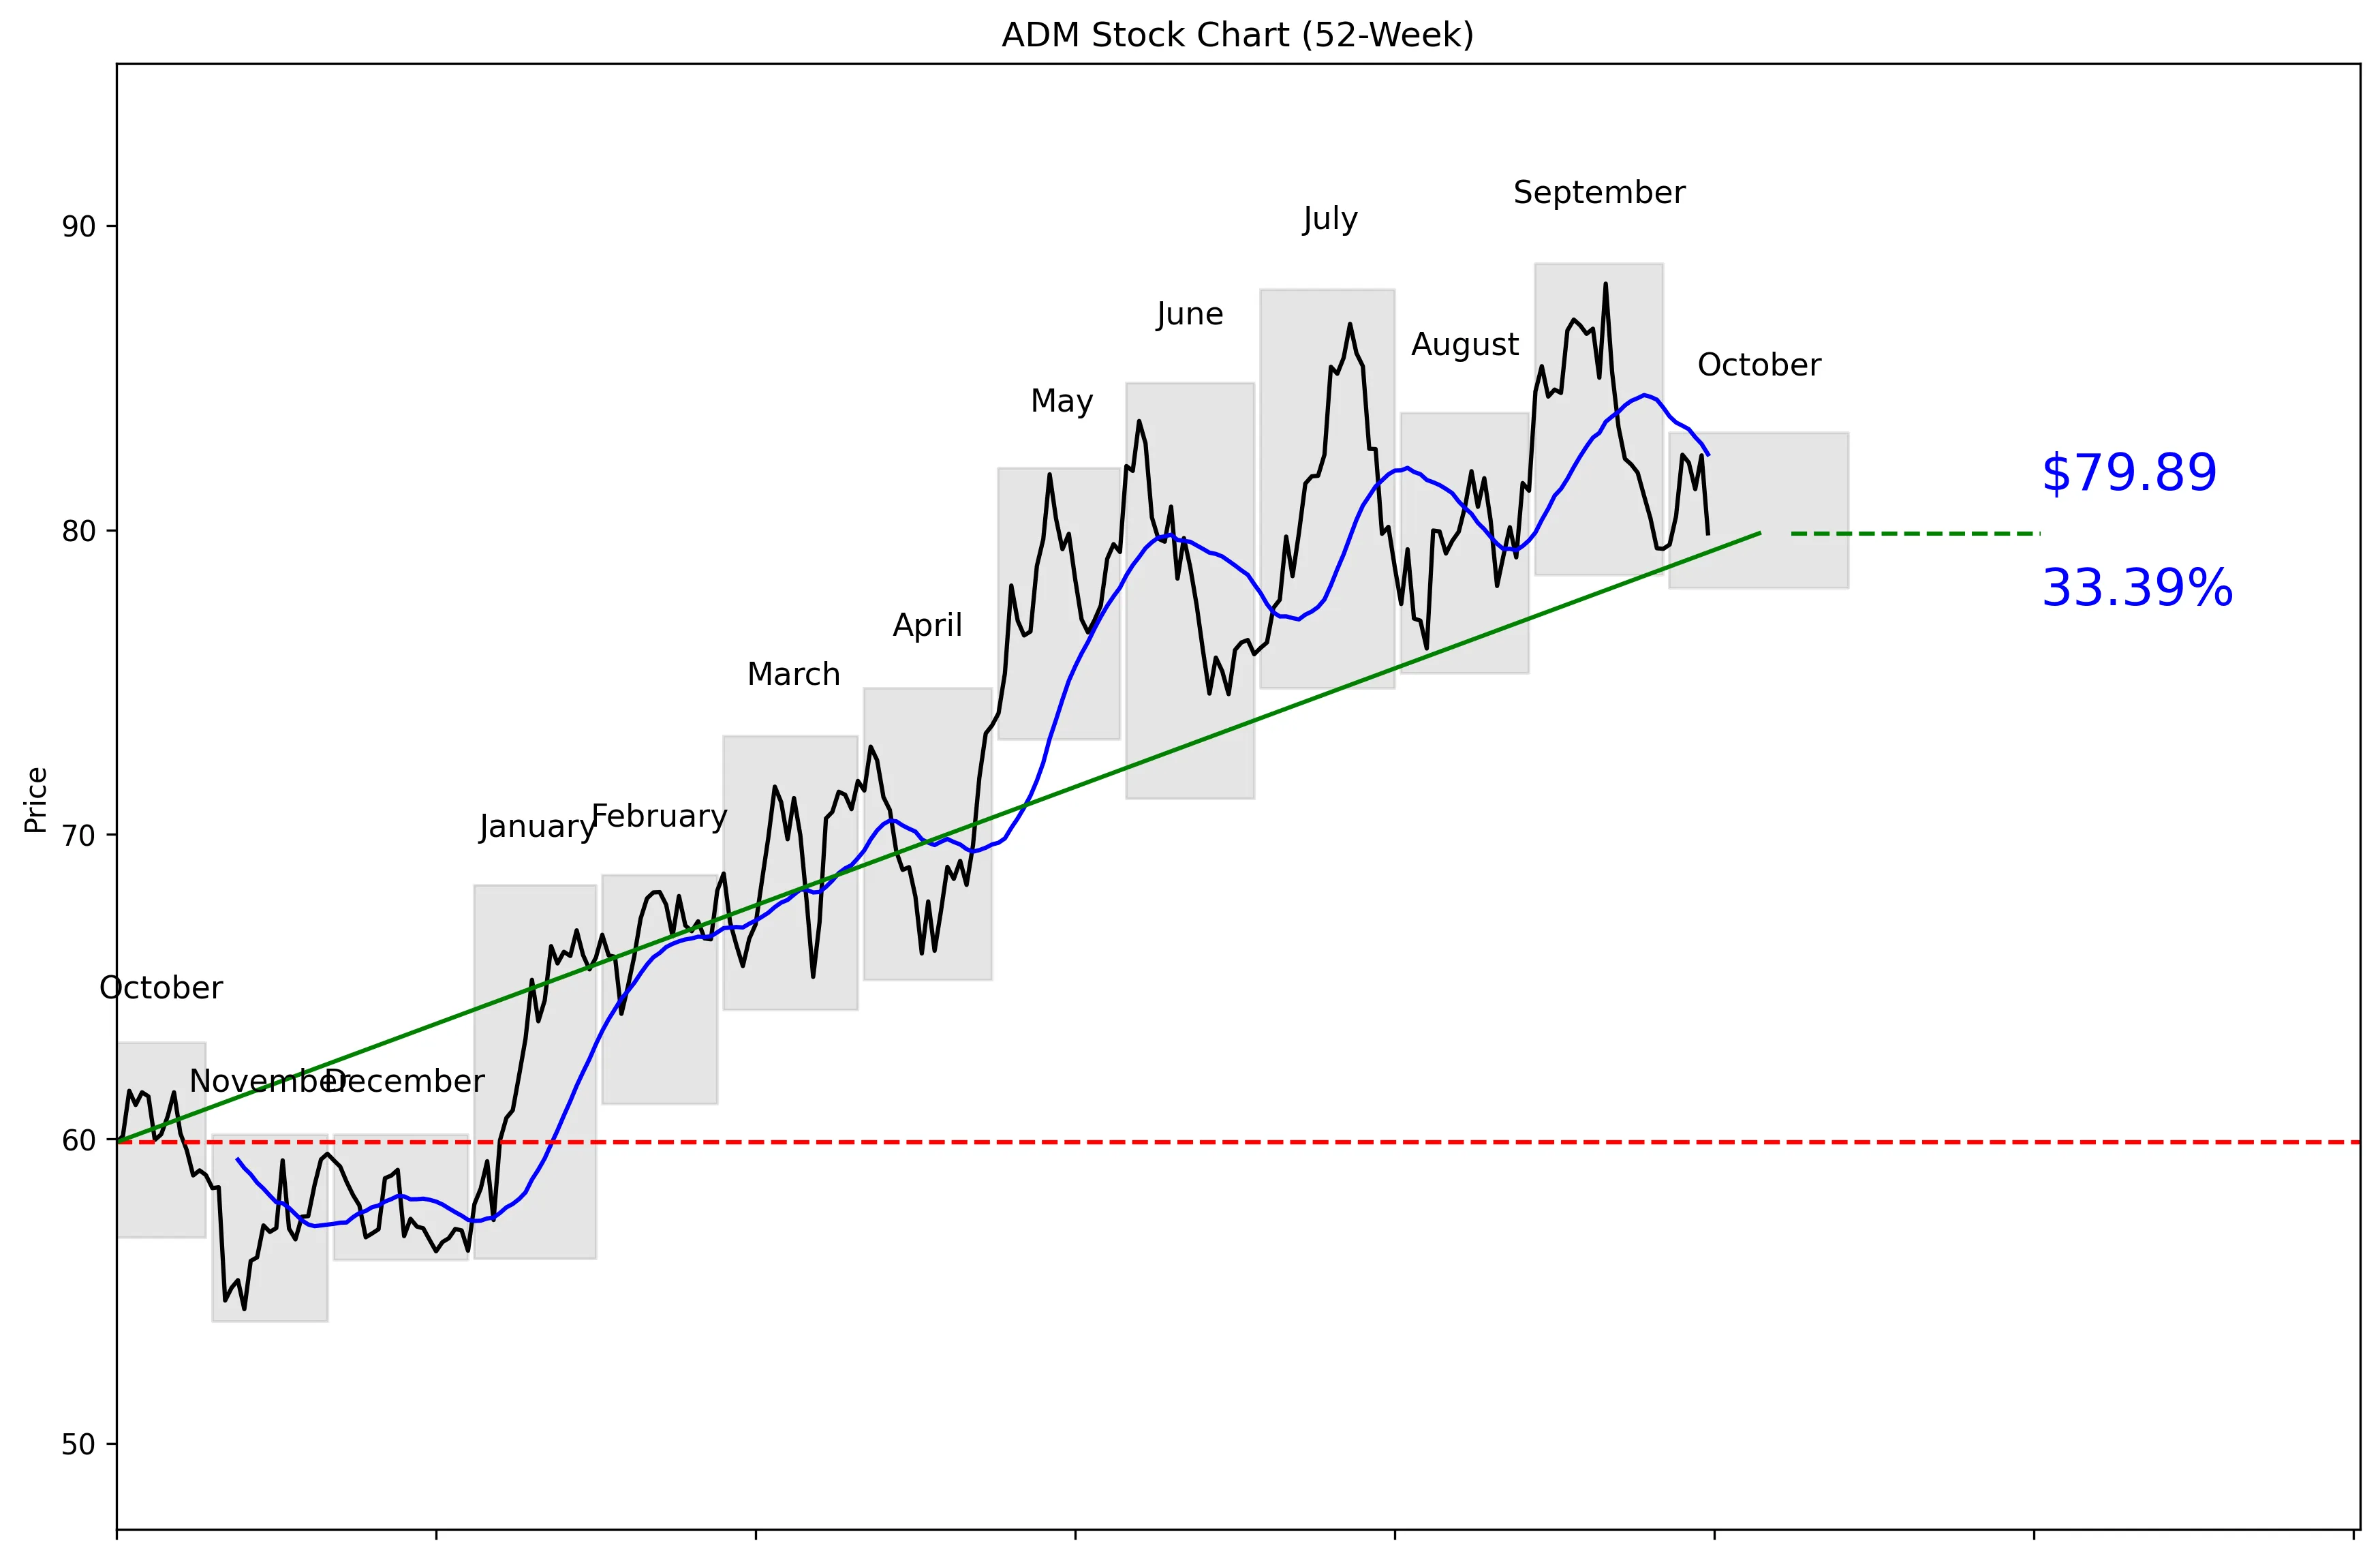
ADM 52-Week Stock Chart
Technical Analysis
ADM’s technical 52-week range runs from $54.00 to $88.75, with the stock 75% of the way from the low to the high. The technical data puts shares 9.98% below the high and 47.94% above the low. Momentum has weakened, with a 0.70% decline over five trading days and a 7.88% decline over 20 trading days. The supplied data says price is 3.14% below the $82.48 20-day moving average, although that conflicts with the stated $83.83 price, which is above that average. Near-term support is $79.38, while resistance is $88.09.


Recent News and Developments

ADM gets an A+ earnings-revision grade before Q3

GuruFocus reported on October 9 that ADM held an A+ EPS Revision Quant Grade ahead of third-quarter earnings. The stock carried a 2.7% dividend yield, while its valuation model classified shares as 34.4% overvalued. Source: GuruFocus

ADM breaks above its 50-day moving average

ADM closed at $82.21 on October 6, above its 50-day moving average of $81.63 and its 200-day average of $73.94. Zacks rated the stock Strong Buy, but the shares traded at 14.61 times forward earnings versus an 8.06 industry multiple. Source: Zacks

ADM sets November 3 date for third-quarter results

ADM said it will release third-quarter 2026 results and provide a company update on November 3. Management’s webcast is scheduled for 7:30 a.m. Central Time, with a press release and presentation due before the call. Source: SwingTradeBot


Market Sentiment and Analyst Recommendations

Bull Case
ADM generated $82.10 billion in revenue, and revenue growth stands at 7.2%. That growth gives investors a concrete reason to look past the recent 7.88% decline over 20 trading days. GuruFocus reported an A+ EPS Revision Quant Grade ahead of third-quarter earnings, signaling improving earnings expectations. ADM also closed above its $81.63 50-day and $73.94 200-day moving averages on October 6. Zacks rated the stock Strong Buy and projected quarterly earnings of $1.53 per share on $22.07 billion in revenue. The November 3 earnings release is the next clear catalyst, and a strong report could push shares back toward the $88.09 near-term resistance level.
Bear Case
ADM trades at 22.90 times earnings, while GuruFocus classified the shares as 34.4% overvalued. Zacks also reported a 14.61 forward earnings multiple versus an 8.06 industry multiple. The $78.70 analyst target sits below the current $83.83 price, so the consensus target does not support upside from here. Analysts are split across a wide $60.00 to $95.00 target range, and the overall recommendation from 10 analysts is hold. ADM carries $9.34 billion in debt against only $1.09 billion in cash, leaving a large gap between those balance-sheet figures. The stock is already 75% of the way through its technical 52-week range, while 20-day momentum is negative 7.88%, making the current setup vulnerable if earnings disappoint.
What to Watch
ADM will release third-quarter 2026 results and provide a company update on November 3. The webcast is scheduled for 7:30 a.m. Central Time, with the earnings release and presentation expected before the call. Investors should compare the report with Zacks’ projections of $1.53 in quarterly earnings per share and $22.07 billion in revenue. Revenue growth should also be watched against the current 7.2% figure. On the chart, $79.38 is the key near-term support level and $88.09 is the resistance level that bulls need to clear. A break below support would weaken the setup, while a move above resistance would put the technical $88.75 high back in focus.
Analyst Consensus
HOLD

Based on 10 analyst opinions
Low Target
$60.00
Mean Target
$78.70
High Target
$95.00


Earnings and Financial Data

Sector
Consumer Defensive
Industry
Farm Products
Employees
40,798
Earnings & Dividends
Next Earnings
Nov 03, 2026
EPS (Trailing)
$3.66
Dividend Yield
244.0%
Payout Ratio
56.3%

Frequently Asked Questions

Is ADM a good stock to buy?
ADM has 7.2% revenue growth, but the consensus recommendation from 10 analysts is hold. The $78.70 analyst target is below the current $83.83 price, so the available data does not make a strong buy case.
What is ADM’s price target?
The analyst target is $78.70, with estimates ranging from $60.00 to $95.00. The takeaway is that analysts see a wide range of possible outcomes.
Is ADM stock overvalued?
ADM trades at a P/E ratio of 22.90 and has a market capitalization of $40.40 billion. The takeaway is that investors should judge that valuation against the company’s 7.2% revenue growth and balance-sheet risk.
What are ADM’s support and resistance levels?
Near-term support is $79.38, based on the 30-day low, while resistance is $88.09, based on the 30-day high. The takeaway is that these are the key levels to monitor.
How much cash and debt does ADM have?
ADM has $1.09 billion in total cash and $9.34 billion in total debt. The takeaway is that debt is substantially higher than cash.

Related Stock Reports

Disclaimer: This report is for informational purposes only and does not constitute financial advice. The analysis and opinions expressed are those of AltStation.io and should not be relied upon as the sole basis for investment decisions. Always conduct your own research and consult with a qualified financial advisor before making investment decisions. Past performance does not guarantee future results. Updated October 10, 2026.