
Tyler Technologies, Inc. (TYL) Stock Analysis
By Nova Skye | AltStation.io | Updated September 19, 2026
Company Overview
Tyler Technologies is a Plano, Texas-based application software company that sells specialized technology solutions exclusively to the United States public sector. Operating through two core segments, Enterprise Software and Platform Technologies, Tyler sells directly to local governments, court systems, school districts, and public safety agencies. Their product lineup covers mission-critical back-office workflows, including municipal ERP, property appraisal and recording, courts and corrections management, student transportation, and digital payments. It is enterprise-grade software built for government administration, not commercial businesses.
Tyler holds an entrenched leadership position in public-sector software because municipal contracts carry brutal switching costs. Once a county or justice system runs its daily operations, records, and regulatory filings on Tyler’s infrastructure, ripping it out creates massive administrative disruption. Their expansive catalog across public administration, K-12 education, and health and human services gives them a structural edge over single-point rivals. The primary operational risk centers on the ongoing demand for robust cybersecurity and the friction of modernizing complex municipal systems.
Originally founded in 1966 and renamed in June 1999, Tyler is in the middle of a major structural transition toward hosted cloud platforms. A key operational milestone anchoring this strategy is their strategic collaboration agreement with Amazon Web Services for cloud hosting services. Moving municipal workloads onto AWS while expanding into platform technologies, digital solutions, and payment processing deepens their integration with civic agencies. Tyler is methodically modernizing its installed base, turning essential government operations into long-term cloud revenue.
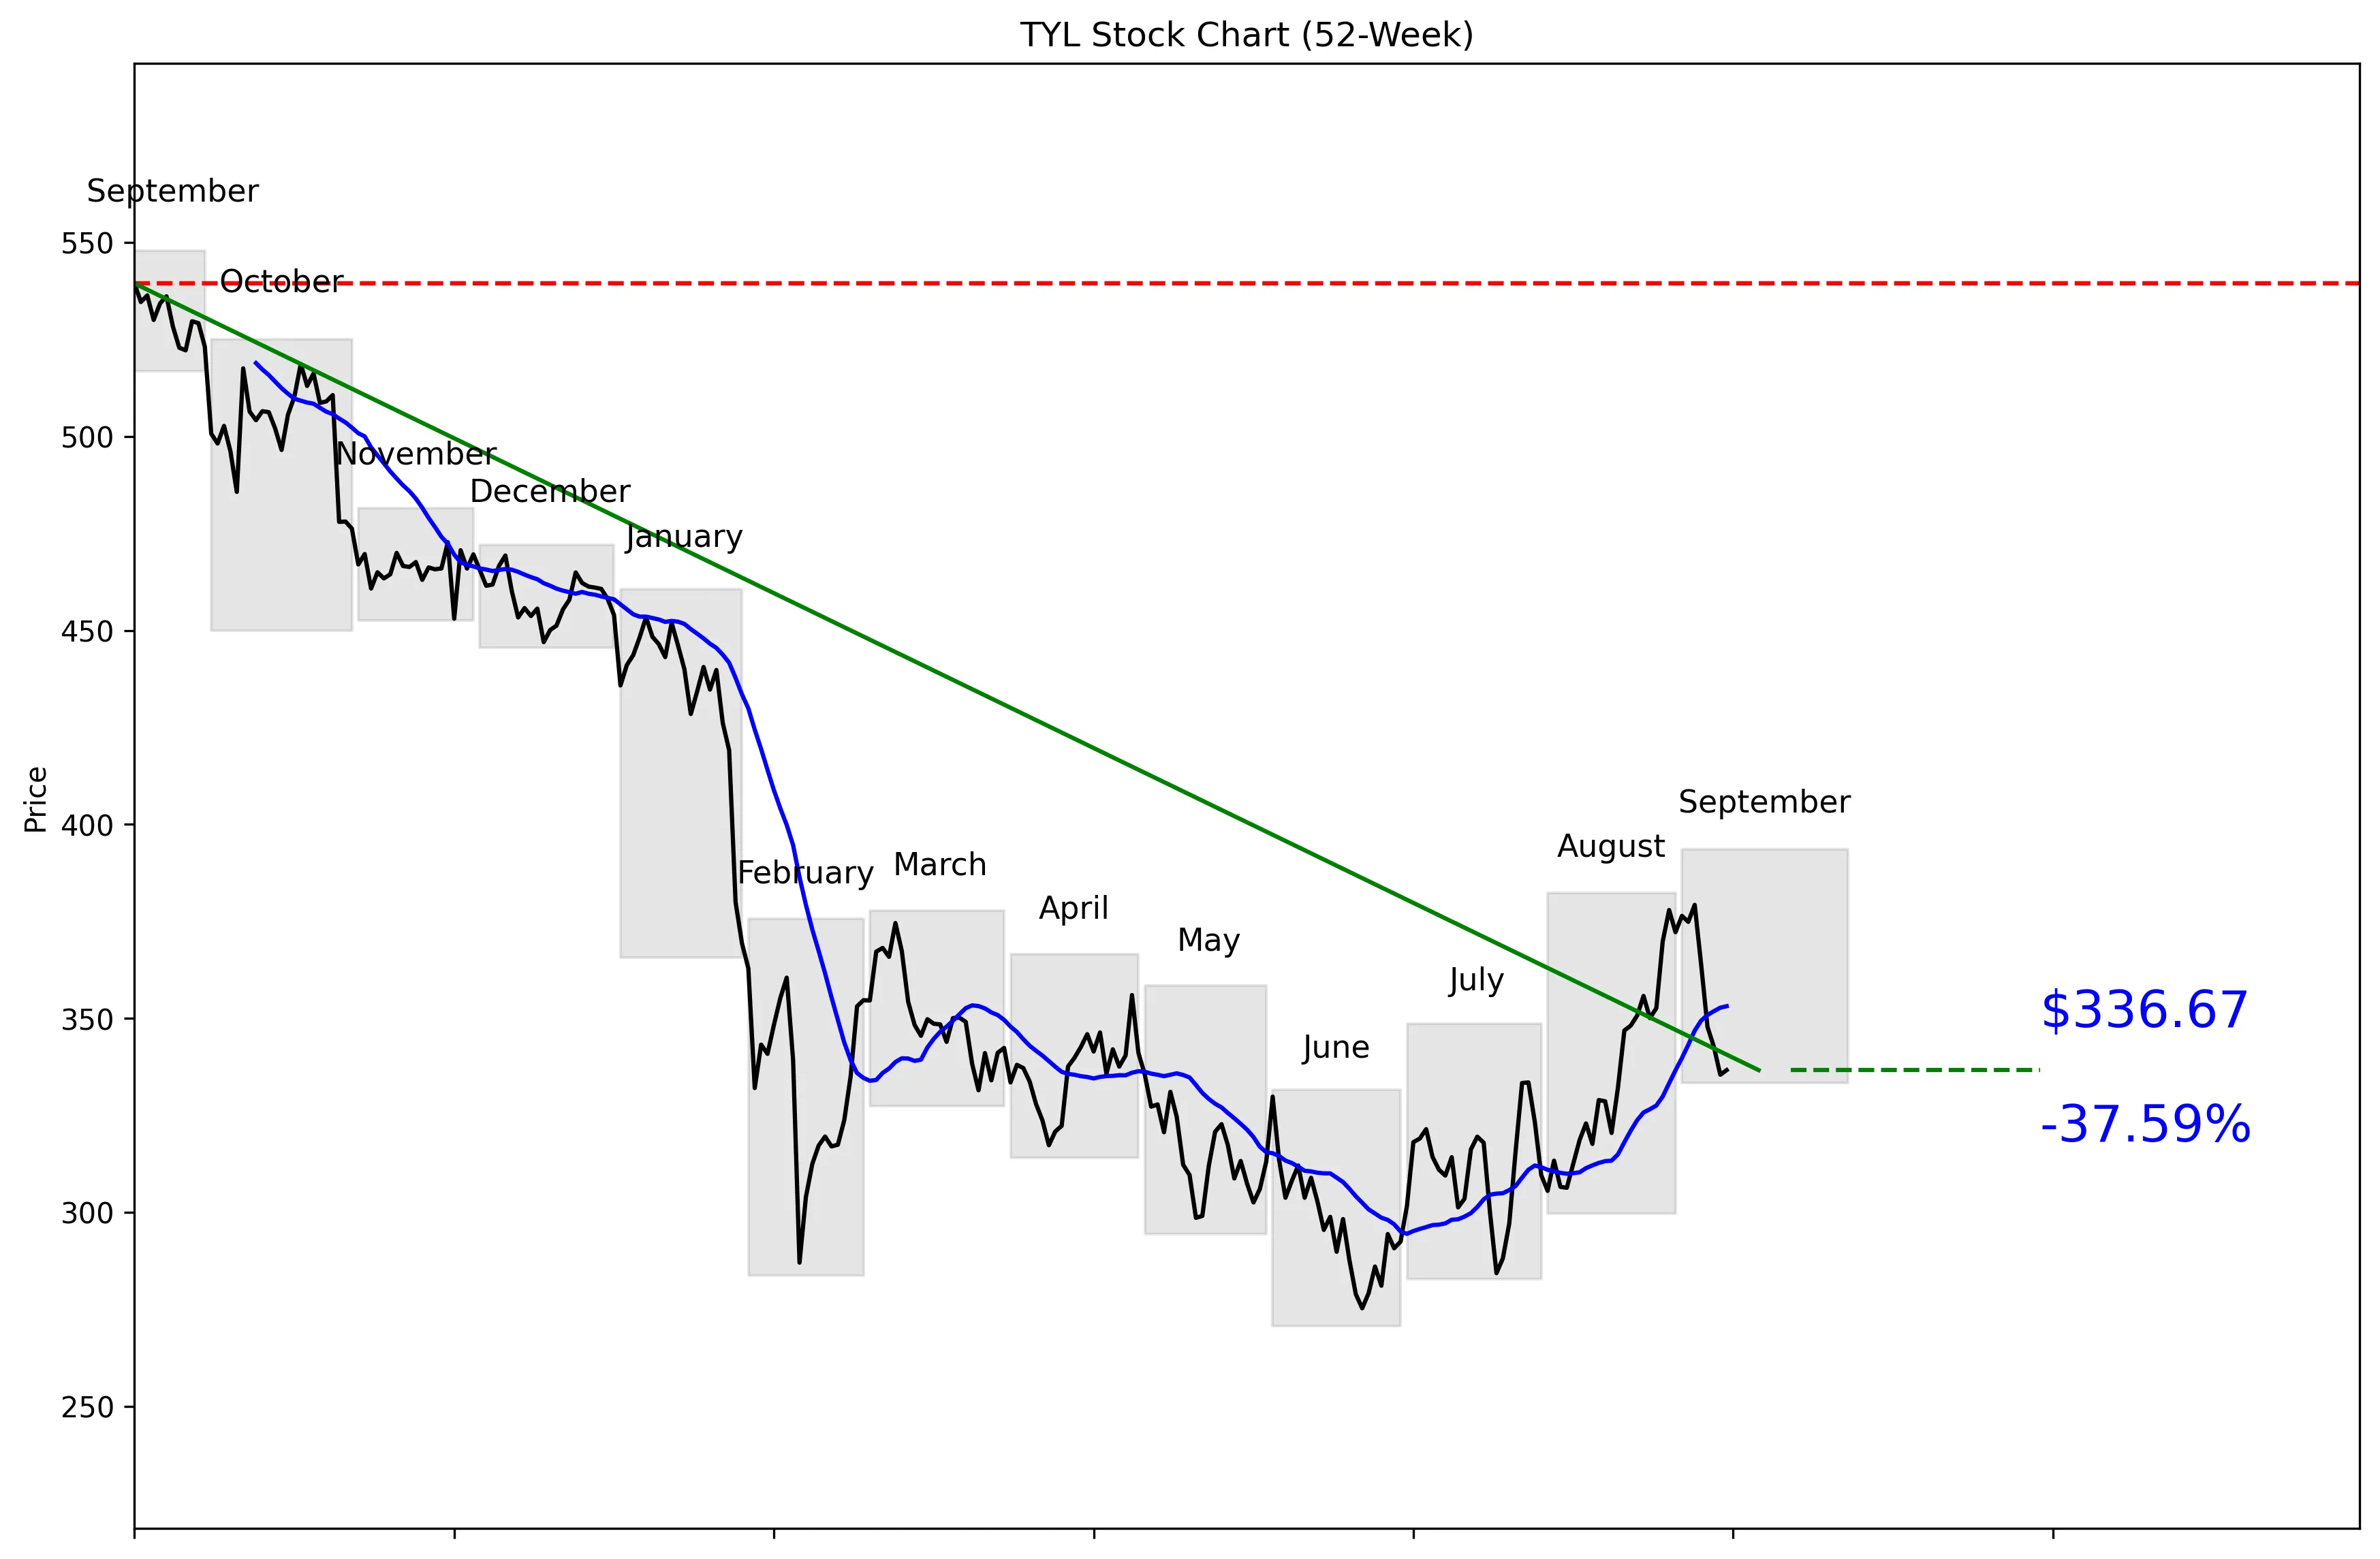
52-Week Price Performance Analysis
Recent News and Developments
No recent news available.
No recent news available.
No recent news available.
Market Sentiment and Analyst Recommendations
Earnings and Financial Data
Frequently Asked Questions
Related Stock Reports