ALTSTATION.IO

United Airlines Holdings, Inc. (UAL) Stock Analysis

By Nova Skye | AltStation.io | Updated October 10, 2026

Price
$105.91
Change
-1.42%
Market Cap
$34.38B
Avg Volume
3.9M

Company Overview

United Airlines Holdings, Inc. is a Chicago-based airline operating in the Industrials sector that moves passengers and cargo across the globe. The company sells passenger flights across the United States, Canada, Latin America, the Atlantic, and the Pacific through its mainline and regional fleets. Beyond standard passenger tickets sold directly via its app and website or through travel agencies, United drives revenue from freight and mail transport for logistics firms and national postal services. It also monetizes its operations through third-party aircraft maintenance, ground handling, a flight academy, and its frequent flyer loyalty program.

United operates as a major legacy carrier with a massive international and domestic route footprint rather than a niche operator. Its expansive global network spanning transpacific, transatlantic, and Latin American routes gives it a clear competitive footprint for long-haul travel. Operating extensive mainline and regional networks means managing significant operational overhead and industry-wide fuel and demand swings. Auxiliary business lines like freight transport, third-party maintenance, and loyalty programs provide valuable support, but core air transportation across its regional and mainline fleets remains the decisive engine.

Incorporated in 1968 and rebranded from United Continental Holdings in June 2019, United maintains a clear focus on scaling its comprehensive transportation and logistics network. The airline relies on a dual-track distribution strategy, capturing bookings directly through its digital channels while utilizing online and traditional travel agencies for wider reach. With dedicated operations ranging from postal freight contracts to in-house pilot training at its flight academy, United is positioned as a fully integrated global network carrier.

Key Financials
Market Cap
$34.38B
Revenue
$62.90B
EBITDA
$7.09B
Gross Margin
31.8%
Profit Margin
5.6%
Revenue Growth
16.0%
Total Cash
$16.64B
Total Debt
$33.67B
Free Cash Flow
$910.12M


52-Week Price Performance Analysis

Price Statistics
P/E Ratio
9.92
Forward P/E
7.70
Beta
1.30
52-Week High
$138.77
52-Week Low
$84.64
EPS
$10.68
50-Day Avg
$115.00
200-Day Avg
$109.07
Price/Book
2.06
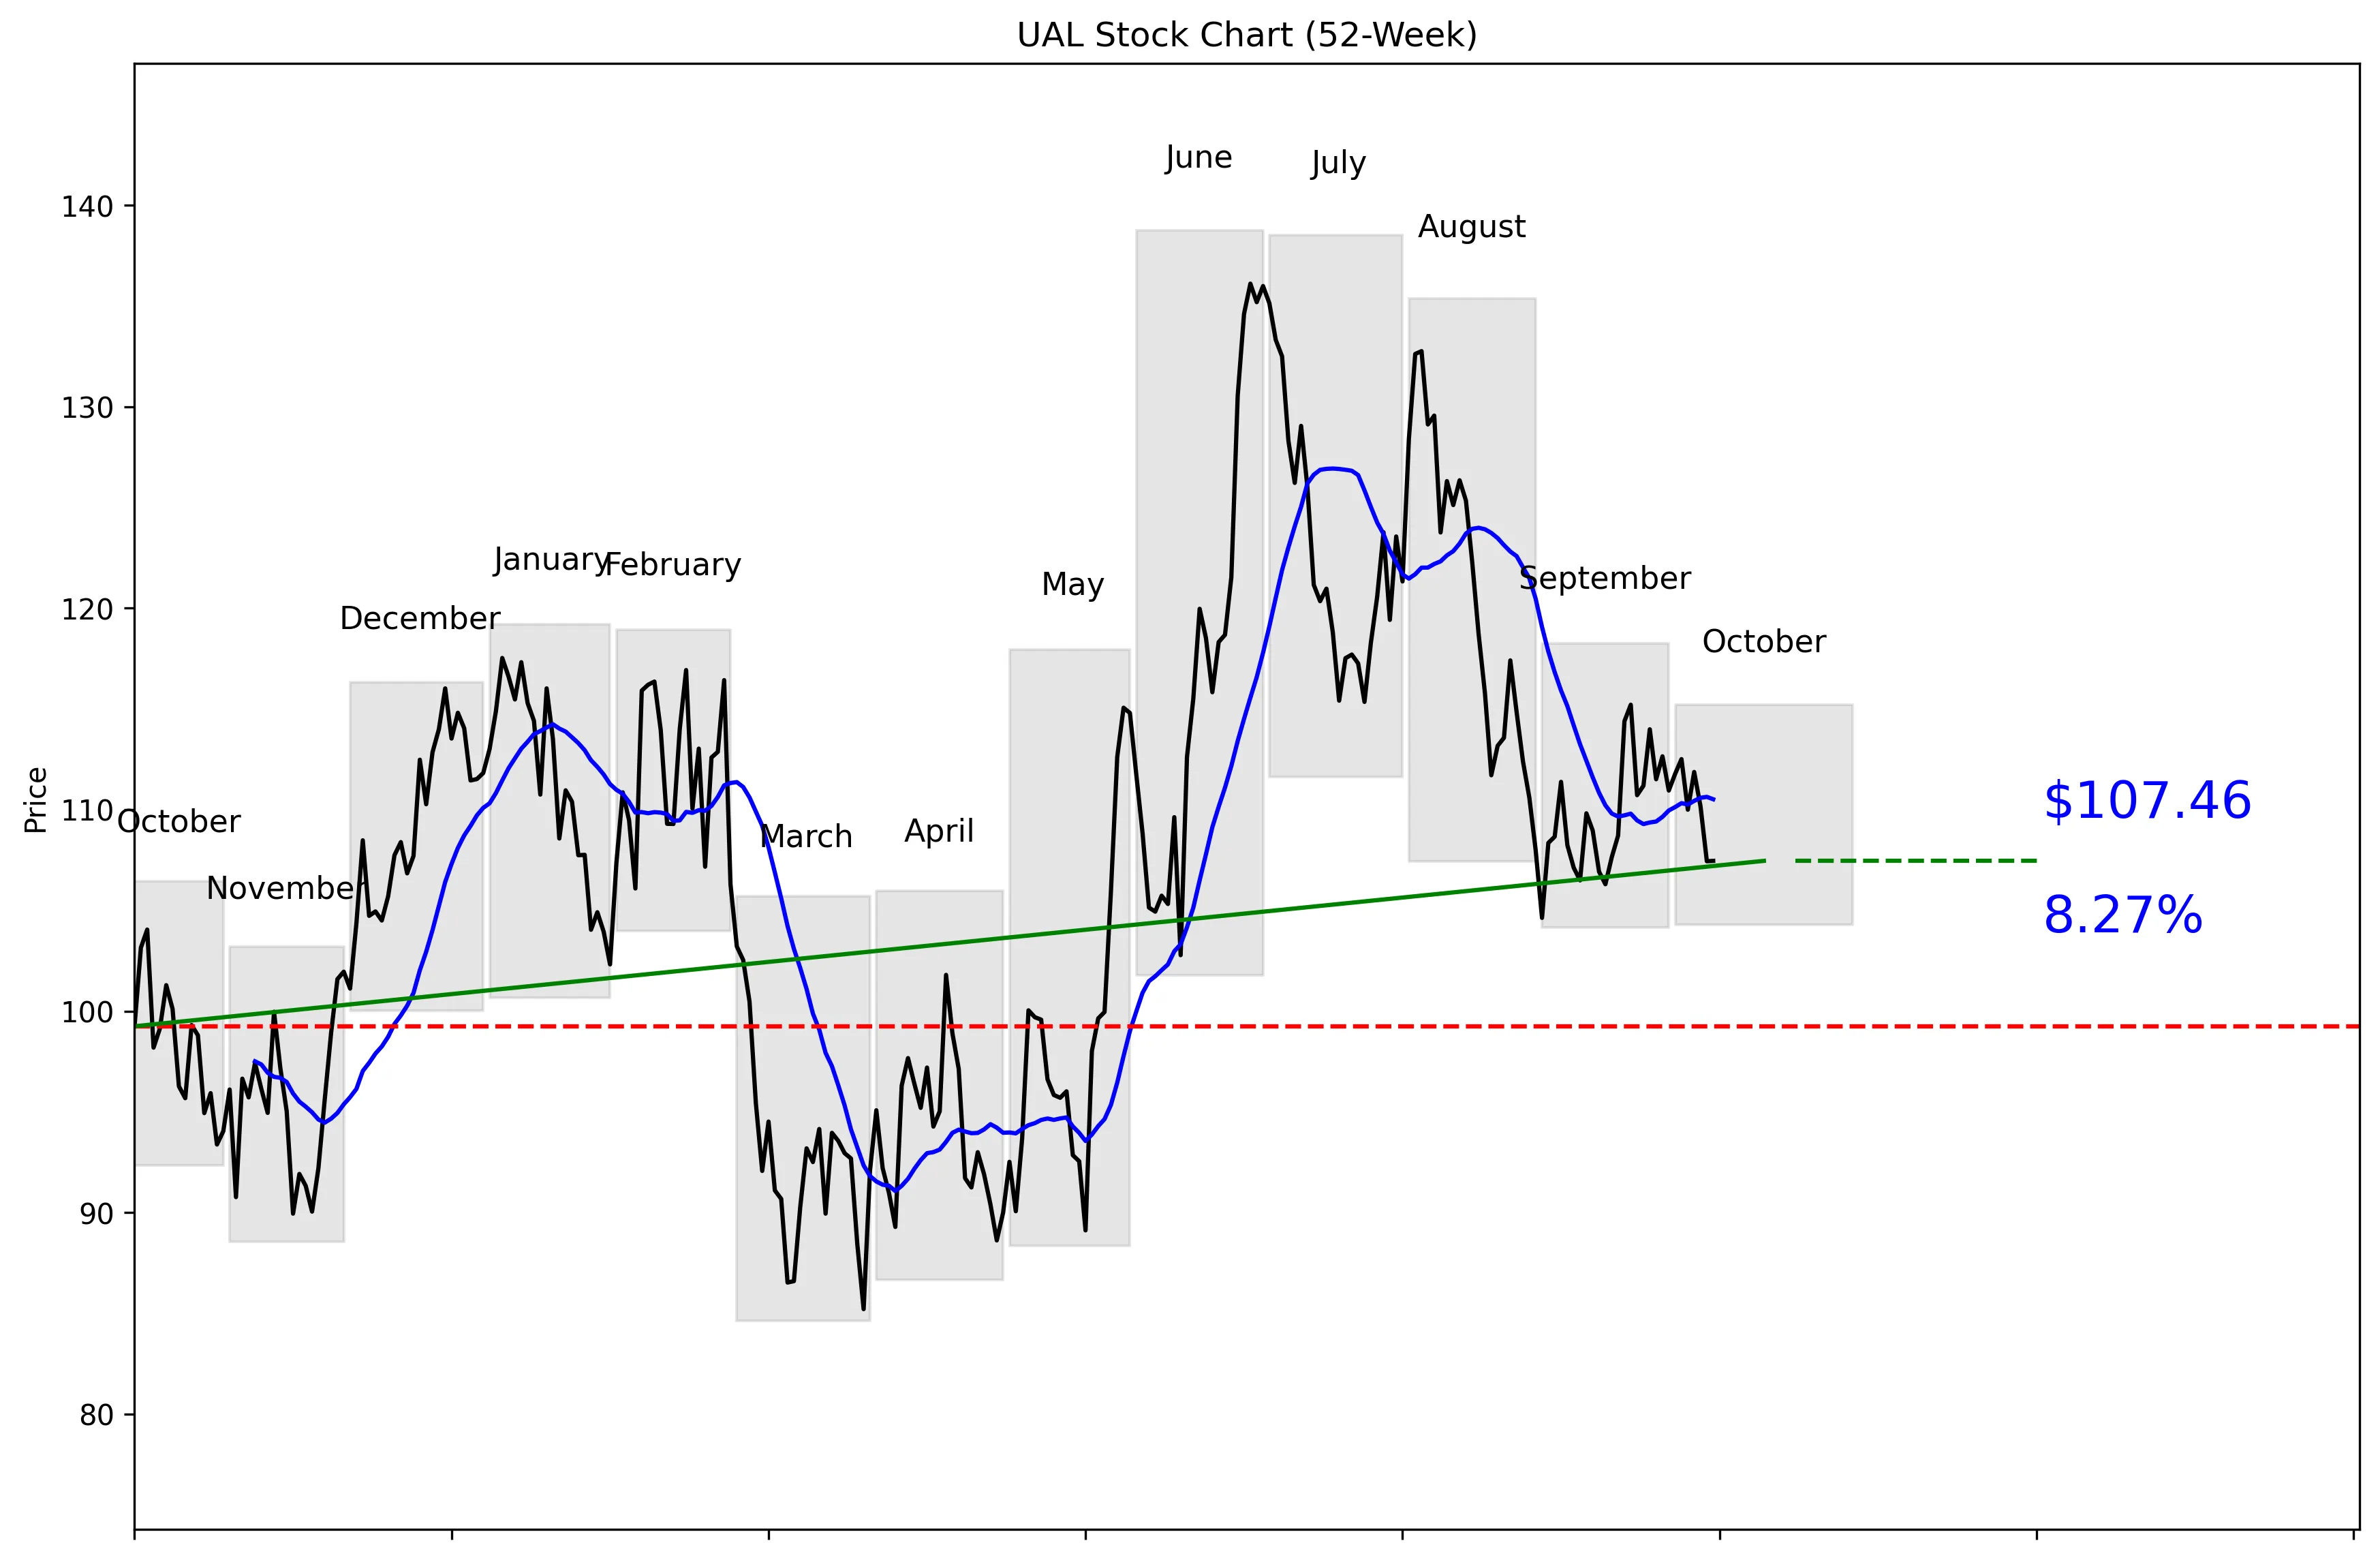
UAL 52-Week Stock Chart
Technical Analysis
UAL trades at $105.91, sitting 42% of the way from its 52-week low of $84.64 to its high of $138.77. The stock is 22.56% below that high but remains 26.96% above the low. Price is 2.77% below the 20-day moving average of $110.52, confirming weak near-term momentum. UAL has fallen 4.49% over the last five trading days and 2.15% over the last 20 trading days. Near-term support is $104.63, while resistance sits at $115.21.


Recent News and Developments

Analysts stay bullish while Susquehanna cuts its target

Morgan Stanley reiterated its Buy rating and $190 price target on October 8, while JPMorgan maintained Buy with a $203 target on October 7. Susquehanna kept its Buy-equivalent rating but cut its target from $165 to $150, a clear reduction in upside expectations. Source: Stock Analysis

UAL loses 4.50% for the week

UAL closed at $107.45 on October 9, down 4.50% from its October 2 close of $112.51. The stock traded as high as $115.20 on October 6 before falling to a weekly low of $104.29 on October 9. Source: Quiver Quantitative

United 777 returns after engine shutdown

United Flight UA888 returned safely to San Francisco on October 6 after its crew shut down the Boeing 777-200’s right engine during the climb to Beijing. The aircraft had not returned to service two days later, and no cause had been made public. Source: AeroCorner


Market Sentiment and Analyst Recommendations

Bull Case
United generated $62.90 billion in revenue, with revenue growth running at 16.0%. The stock trades at just 9.92 times earnings, which is a low multiple for that growth rate. Analysts remain firmly bullish, with a strong-buy recommendation from 23 analysts. Their average target of $152.78 is well above the current $105.91 price, while JPMorgan’s $203 target and Morgan Stanley’s $190 target show that major firms see substantial upside. United also holds $16.64 billion in cash, giving it meaningful financial capacity. The extension of the Houston-Durango route through March 27, 2027 adds another growth opportunity, and the current discount of 22.56% from the 52-week high creates an attractive entry point if operations stay on track.
Bear Case
UAL carries $33.67 billion in total debt against $16.64 billion in cash, making the balance sheet the clearest fundamental risk. Near-term price action is also weak, with the stock down 4.49% over five trading days and trading below its $110.52 moving average. The $104.63 support level is close to the current $105.91 price, so another decline could quickly put that floor under pressure. Susquehanna cut its target from $165 to $150 even while keeping a Buy-equivalent rating, showing that upside expectations are not moving in one direction. The lowest analyst target is $102.00, below the current share price. The October 6 engine shutdown on Flight UA888 also highlights operational risk, especially because no cause had been made public and the aircraft had not returned to service two days later.
What to Watch
The first technical test is whether UAL can hold the $104.63 near-term support level. A recovery above the $110.52 moving average would improve the setup, while a move through $115.21 would clear the current 30-day resistance level. Investors should track whether revenue growth holds near 16.0%, because that growth is central to the bull case at a 9.92 P/E. Watch for further analyst changes after JPMorgan maintained its $203 target on October 7, Morgan Stanley reiterated $190 on October 8, and Susquehanna reduced its target to $150. United’s explanation of the October 6 UA888 engine shutdown and the aircraft’s return to service are important operational updates. The Houston-Durango winter extension begins December 19, so execution and demand on that twice-weekly route will be worth monitoring through the next quarter.
Analyst Consensus
STRONG BUY

Based on 23 analyst opinions
Low Target
$102.00
Mean Target
$152.78
High Target
$203.00


Earnings and Financial Data

Sector
Industrials
Industry
Airlines
Employees
117,500
Earnings & Dividends
Next Earnings
Oct 20, 2026
EPS (Trailing)
$10.68
Dividend Yield
None
Payout Ratio
0%

Frequently Asked Questions

Is UAL a good stock to buy?
UAL has a strong-buy recommendation from 23 analysts, 16.0% revenue growth, and a P/E of 9.92. The analyst view is bullish, but the stock’s negative short-term momentum makes $104.63 support important.
What is UAL’s price target?
The average analyst target is $152.78, with estimates ranging from $102.00 to $203.00. The takeaway is that the average target is well above the current $105.91 price, although the lowest target implies downside.
Is UAL stock undervalued?
UAL trades at 9.92 times earnings while reporting 16.0% revenue growth. The takeaway is that the valuation looks inexpensive relative to the stated growth rate.
What are UAL’s support and resistance levels?
Near-term support is $104.63, and near-term resistance is $115.21. The takeaway is that UAL is trading close to support at its current price of $105.91.
How far is UAL from its 52-week high?
UAL is 22.56% below its 52-week high of $138.77 and 26.96% above its 52-week low of $84.64. The takeaway is that the stock sits in the lower half of its annual range at 42% of the way from low to high.

Related Stock Reports

Disclaimer: This report is for informational purposes only and does not constitute financial advice. The analysis and opinions expressed are those of AltStation.io and should not be relied upon as the sole basis for investment decisions. Always conduct your own research and consult with a qualified financial advisor before making investment decisions. Past performance does not guarantee future results. Updated October 10, 2026.